ISSN 0104-6632 Printed in Brazil
www.abeq.org.br/bjche
Vol. 34, No. 01, pp. 171 - 181, January - March, 2017 dx.doi.org/10.1590/0104-6632.20170341s20150433
Brazilian Journal
of Chemical
Engineering
EXPERIMENTAL APPROACH TO ASSESS
EVAPORATIVE COOLING UNDER FORCED
AIR FLOW
L. G. G. Rodrigues, E. I. B. Parisotto, B. A. M. Carciofi
*and J. B. Laurindo
Department of Chemical and Food Engineering, Federal University of Santa Catarina, EQA/CTC/UFSC, CEP: 88040-900, Florianópolis - SC, Brazil.
Phone.: +55 48 37215229; Fax: +55 48 37219687. E-mail: [email protected]
(Submitted: July 7, 2015 ; Revised: November 6, 2015 ; Accepted: December 22, 2015)
Abstract - Air blast is one of the most employed industrial chilling methods. It can be enhanced, i.e., increasing heat transfer and reducing cooling time, by superficial evaporative phenomena. This work reports a methodology, including experimental setup and mathematical modelling, to quantify the air chilling enhancement by wetting the surface of the object to be chilled. A spherical metal model was covered by a cotton tissue (wet or dry) and placed into a cold chamber. The effective heat transfer coefficient was determined at different temperature, air velocity, and relative humidity from time-temperature profiles into the sphere. Under the same air conditions, the effective coefficient between sphere and air was increased three-fold by moistening the cotton tissue on the sphere surface. Furthermore, comparing a dry and wet surface showed that evaporative cooling resulted in much shorter chilling times. The proposed approach was able to assess evaporative heat transfer by measuring only the time-temperature profile, and is suitable for industrial applications.
Keywords: Air blast chilling; Cold chamber; Convection; Heat and mass transfer; Effective heat transfer coefficient.
INTRODUCTION
Chilling processes are very important in many dustries, such as in the food industry, in order to in-hibit microbial growth and preserve the quality of foodstuffs from the producer to the consumer. Air blast chilling of foods can involve both heat transfer between the product and the chilling medium and mass transfer due to water evaporation (weight loss) at the wet surface (Mekprayoon and Tangduangdee, 2012). Processing time and weight loss are important parameters regarding the design of chilling lines for the quality of many food products. Conventional methods such as slow air, air blast, water immersion, and water spraying have been widely used in
in-dustrial chilling of food products (Dincer, 1997a; Sun and Wang, 2004; Laurindo et al., 2010a; Laurindo et al., 2010b), each one with its own advantages and disadvantages. Alternatively, rapid chilling methods increase food safety, improve quality, prevent micro-bial growth, and might reduce evaporative weight losses (Erdogdu et al., 2005).
et al., 2003; Amendola and Teruel, 2005). In the poultry industry, carcasses are traditionally cooled from approximately 40 °C to 4 °C by immersion in cold water (or a mixture of ice and water), which is crucial to ensure safe products (James et al., 2006; Carciofi and Laurindo, 2007; Carciofi and Laurindo, 2010). On the other hand, air chilling is gaining in popularity because of the limited availability of wa-ter, wastewater discharge restrictions, and govern-mental regulations on carcass moisture retention (Huezo et al., 2007). Evaporative air chilling, a mixed type of air chilling and water chilling, com-bine the advantages of both methods and is an alter-native to immersion chilling of poultry carcasses (Mielnik et al., 1999, Jeong et al., 2011). In a typical cold-air meat chilling process, the water vapor pres-sure at the meat surface is much higher than in the cooling air, resulting in water evaporation (weight and quality losses). Consequently, water from inside diffuses towards the surface as a result of moisture gradients, and the balance between evaporation and diffusion governs the water activity near the surface. The intensity of these coupled phenomena deter-mines the chilling time, weight loss, temperature, and surface water activity (Trujillo and Pham, 2006). Chuntranuluck et al. (1998) developed a model for predicting chilling times of foods when evaporative chilling is significant. They used finite difference analysis to simulate transient chilling of food prod-ucts of simple shapes such as spheres, infinite slabs, and cylinders. Those authors showed how to account for evaporative chilling considering the latent heat of evaporation and the evaporative weight loss rate.
The most significant factors for the design of a re-frigerated food chain are the food’s thermophysical properties (e.g., specific heat, thermal conductivity, thermal diffusivity) and the chilling heat transfer pa-rameters (heat transfer coefficients) (Dincer, 1997b). The convective heat transfer coefficient is a key pa-rameter to calculate chilling time, and, hence, in the design of food-cooling facilities (hydro-chilling, air chilling) (Cuesta et al., 2012). This coefficient is a local or global parameter, which depends mainly on the velocity of the surrounding fluid, product geome-try, flow orientation, surface roughness, and on the packaging (Incropera and Dewitt, 2002; Becker and Fricke, 2004). At high heat transfer rates, food shape will play a minor role. The effect of these various factors on convection heat transfer can be mathe-matically expressed as a relationship of dimension-less numbers: Nusselt (Nu), Reynolds (Re), Prandtl (Pr), and Grashof (Gr) (Incropera and Dewitt, 2002; Verboven et al., 2003).
Landfeld and Houska (2006) used a metallic
chicken as a simplified physical model to estimate the convective heat transfer coefficient in an air blast chilling tunnel. They reported coefficient values be-tween the metallic model and the chilling media close to 50 W m-2 K-1. Verboven et al. (2003) re-ported results of convective heat transfer coefficients between stationary spherical particles and an aqueous solution inside a hydrofluidized freezing unit ranging from 154 to 1548 W m-2K-1. These values depended on the body diameter, chilling fluid temperature, and fluid agitation level. The authors attributed the vari-ability of the measured coefficients to non-constant flow and turbulence fields in the aqueous medium.
The lack of actual data about the effect of cooling conditions on the chilling rates, weight loss, and quali-ty is a major barrier to the advancement of tech-nology related to this unit operation (James et al., 2006). In this study, the objective was to assess the heat transfer between the cooling air and a metallic sphere, chosen as a model, covered by a wet or dry cotton tissue and to propose a methodology to obtain an effective heat transfer coefficient taking into ac-count mass transfer phenomena, but without measur-ing it. The enhancement of this effective coefficient and the cooling rates provided by wetting the surface were evaluated from the experimental temperature analysis.
MATERIALS AND METHODS
In order to evaluate the contribution of evapora-tive cooling on the heat transfer between a metallic sphere and air, effective heat transfer coefficients were determined from three different arrangements: i) uncovered aluminum sphere, ii) aluminum sphere covered with a dry cotton tissue, and iii) aluminum sphere covered with a wet cotton tissue. The pur-pose-built experimental setup, the instruments used to determine the experimental conditions, and the mathematical and statistical approaches are described below.
Experimental Setup
heating element, while the compressor capacity was controlled using a frequency inverter (Danfoss, model VLT Micro Drive FC 51, Beijing, China) (Danfoss, model 136 LCZ, Osasco, Brazil). The Field Chart software (Novus, version 1.8, Porto Alegre, Brazil) registered temperature and RH data inside the cham-ber. Airflow patterns inside the chamber were pro-vided by a fan (WEG, 1000 rpm, Jaraguá do Sul, Brazil) at two average air velocities: 0.92 m s-1 (V1)
and 1.42 m s-1 (V
2). These average air velocities over
the sphere were measured by a digital anemometer (Testo 425, Lenzkirch, Germany) positioned 0.50 m from the fan, as shown in Figure 1.
Figure 1: (a) Schematics of the forced-air chilling process of a sphere. (b) Plan view of the forced-air chilling process of a sphere. (c) Schematics of the sphere covered with cotton, sensor positions, and ther-mal resistance network: convective (Rconv),
conduc-tive in the cotton (Rcot), and conductive in the sphere
(Rsph).
An aluminum sphere (diameter, DAl = 0.100 m,
and mass, mAl = 1.41 kg) was used as a model to
assess the influence of the surface condition (dry or wet) on heat transfer. For that, convective heat trans-fer coefficient values between the sphere and the cooling air were determined under different condi-tions: both velocities (V1 and V2) at three RH
condi-tions (30%, 60%, and 90%). Aluminum’s physical properties were density, ρAl = 2702 kg m-3; specific
heat, cAl= 903 J kg-1 K-1; and thermal conductivity,
kAl = 237 W m-1 K-1 (Incropera and Dewitt, 2002). A
rigid polyethylene rod was used in order to support the sphere during the cooling experiments; this poly-mer was chosen to prevent the effects of conduction heat transfer through itself.
The sphere’s core temperature (TAl) was measured
using a T-type thermocouple (IOPE, model 24 AWG, São Paulo, Brazil) inserted into the sphere's geo-metric center through a channel made with a preci-sion mechanical machine. The channel was filled with thermal paste (IPT300, Implastec, São Paulo, Brazil) and sealed with a commercial epoxy resin (Professional Araldite, Brascola, São Paulo, Brazil). Time-temperature data of cooling air (T∞) were
measured, as well as time-temperature data of inter-nal (Ti, in contact with the aluminum sphere’s
sur-face) and external (Te, in contact with air) cotton
tissue surfaces. The dry cotton tissue mass (md) was
0.009 kg, while its specific heat was 1300 J kg-1 K-1 (Incropera and Dewitt, 2002). The diameter of the sphere covered with cotton tissue was De = 0.102 m.
Figure 1c is a schematic that represents the sphere covered with cotton, the sensor positioning, and the three resistances to heat transfer present in the forced air chilling process. Contact resistances between cot-ton and aluminum were neglected. Rconv, Rcot, and
Rsph denote convective thermal resistances (between
air and surface), conductive thermal resistances in the cotton, and conductive thermal resistances in the aluminum.
All temperatures were monitored with T-type thermocouples (IOPE, model A-TX-TF-TF-R 30 AWG, São Paulo, Brazil) and recorded at 5 s inter-vals by a data acquisition system (Agilent, model 34972A, Santa Clara, USA).
Determination of Heat Transfer Coefficients Be-tween the Sphere and Forced Air
Aluminum Sphere
chamber. The cooling process was monitored until the sphere’s core temperature had reached 4.0 °C. This procedure was done in quintuplicate for cooling air at each predetermined air velocity and at 1.0 °C.
The convective heat transfer coefficient (h) be-tween the sphere and air was determined from ex-perimental time-temperature evolutions at both the sphere’s core and air chilling using the well-known lumped capacitance method. This method can be used when the thermal resistance to heat transfer by conduction within one solid is much smaller than the thermal resistance to heat transfer between the solid’s surface and fluid flow. In other words, the lumped capacitance method can be applied only when the temperature inside the solid can be con-sidered spatially uniform at any given time during the process, i.e., it is practical only if the Biot num-ber (Eq. (1)) is less than 0.1 (Incropera and Dewitt, 2002).
Al
Lh
Bi
k
(1)in which L is the solid’s characteristic dimension, defined as the ratio between its volume and interfa-cial area. For a sphere, L = DAl/6. This way, if Bi <
0.1, the global energy balance in the whole solid is given by Eq. (2).
( ) Al
Al Al Al Al
dT
hA T T m c
dt
(2)
in which AAl is the interfacial area of the aluminum
sphere and t is the cooling time.
Integrating Eq. (2) leads to Eq. (3), from which the h value can be determined using experimental time-temperature data.
( )
ln ( )
( )
o Al
o
Al Al Al
T T hA
t t
T T m c
(3)
in which To is the solid’s temperature at initial time to
(initial condition).
Aluminum Sphere Covered with Cotton Tissue
An effective convective heat transfer coefficient (hef), which has both thermal and evaporative
contri-bution, was determined from time-temperature data and Eq. (4), which represents the overall energy balance in the aluminum sphere covered with the cotton tissue,
( ) c Al
ef e e c c Al Al
dT dT
h A T T m c m c
dt dt
(4)
in which Ae is the surface area of the aluminum
sphere covered by the wet cotton tissue; and mc and
cc are the mass and the specific heat of the wet
cot-ton, respectively.
Assuming the temperature inside the aluminum sphere as spatially uniform at any given time during the process and a pseudo-stationary approach, Eq. (5) allows calculating an average temperature (Tc) in the cotton spherical shell (ri ≤ r ≤ re, from the
aluminum sphere’s surface, radius ri, and cotton
surface, radius re),
2 2 ( )4 4 e i e i r c r c r r
T r r dr T
r dr
(5)in which Tc(r) represents the temperature in the
spherical shell, as given by Eq. (6) for a steady state (Incropera and Dewitt, 2002).
1( )
1
i
c i i e
i
e
r r
T r T T T
r r (6)
Thus, after integration, Tc is given by Eq. (7).
4 3 3
3 3
3 1
2 2
e i e e i e i
c i
e i e i
T T r r r r r T T
r r r r
(7)
Mass and specific heat were assumed to be con-stant for the aluminum sphere and variable for the wet cotton as a consequence of moisture content in the tissue. Time-dependence was calculated from the cotton tissue’s moisture content, as given by Eq. (8),
c c d d w w
m c m c m c (8)
in which mdcd and mwcware the product between mass
The dry cotton tissue’s mass (md) was constant at
0.009 kg, while water mass decreased during the evaporative cooling. In order to evaluate mw as a
function of time, the wet cotton tissue was weighed outside the chamber on a semi-analytical balance (Gehaka, model BG 400, São Paulo, Brazil). At pdetermined intervals, the sphere was quickly re-moved from the chamber and placed on the balance. The result was expressed as a percentage of the wa-ter present in the cotton tissue. The initial mass was determined from ten measurements (average value = 0.0338 kg and standard deviation = 0.0003 kg). Time-water mass data were fitted by the empirical Eq. (9),
exp wm a bt c (9)
in which a, b and c are empirical constants.
One instantaneous coefficient value was calcu-lated from each recorded time interval (∆t) using Eq. (4) re-written as Eq. (10). Thus, one average coeffi-cient was determined from each cooling assay. Finally, the average value of hef is the average from five
cool-ing assays at each experimental setup investigated.
1
( )
c Al
ef c c Al Al
e e
T T
h m c m c
A T T t t
(10)
in which Te, T∞, mc, cc, ∆Tc, and ∆TAl were the
ex-perimental results recorded at each ∆t = 5 s.
The hef values when the sphere was covered by
the dry cotton tissue were determined as a particular case in which mw was constant and equal to zero.
Correlation for Air-Sphere Convective Heat Trans-fer Coefficient
Some well-known empirical correlations can be used to estimate the convective heat transfer coeffi-cient between a solid sphere and a fluid without simultaneous mass transfer. McAdams proposed an empirical correlation to estimate the convection heat transfer coefficient between a sphere and a gas (Eq. (11)) in which all properties are evaluated at the film’s temperature. This correlation is limited to 17 < Re < 70,000 (McAdams, 1954; Holman, 1992),
0 ,6
0, 3 7 (R e ) 0 , 3 7
h D D
N u
k v
(11)
in which Nu is the Nusselt Number; D is the sphere’s diameter (DAl or De); and k∞, ρ∞, and ν are the gas’s
(air) thermal conductivity, density, and kinematic viscosity, respectively. In the present study, Re
values were close to 7,000 and 10,500 at V1 and V2,
respectively.
Statistical Analysis
Estimated parameters were evaluated by one-way ANOVA at 95% probability level. In cases with sig-nificant effects (p < 0.05), the average values were compared using Tukey’s test.
RESULTS AND DISCUSSION
Convective Heat Transfer Coefficients
Table 1 summarizes h and hef values determined
from experimental time-temperature data and those estimated from McAdams correlation. It is remarka-ble that, in all experimental conditions, Bi values were equal to or less than 10-2, indicating that there were no significant temperature gradients inside the metallic sphere and that the lumped method was properly chosen. Estimated values of h and hef had
low coefficients of variation (CV < 10%), indicating reproducibility. The coefficient of determination (R2) of the linear regression (Eq. (3)) to experimental data ranged from 0.987 to 0.999.
In the present study, both predicted (McAdams correlation) and experimental coefficients are of the same order of magnitude. Predicted h values between the uncovered sphere and air flowing around it were 23.0% and 25.2% (at V1 and V2, respectively) lower
than experimental values. Appling the correlation to the aluminum sphere covered by dry tissue underes-timates the coefficients in 33.0% and 28.1% (at V1
and V2, respectively). Although the chosen
correla-tion is appropriate for air flowing around a sphere, errors up to 30% are expected from empirical corre-lations estimating convective heat transfer coeffi-cients (McAdams, 1954; Holman, 1992). McAdams correlation was obtained by a simplified linear re-gression to a big set of data, including spheres with different surface roughness and air flow under a large range of Reynolds numbers. It leads to differ-ences even between these original data used to esti-mate the correlation and the predicted values.
Evaporative phenomena increased the heat trans-fer (resulting in an effective coefficient, hef) more
than two-fold in all experimental setups with wet tissue compared with the same setup with dry tissue. Moreover, h and hef results in Table 1 show that
in-creasing air velocity promotes significant coefficient increases (p < 0.05), as expected, while the RH did not affect hef significantly (p > 0.05) at either air
Table 1: h and hef values determined by experimental time-temperature data and by McAdams correlation for the two air velocities (with and without a cotton tissue) and three RH levels (only when the wet tissue covered the sphere). Results contain: average value ± standard deviation, and coefficient of variation in parentheses.
Air velocity (m s-1)
RH (%)
Uncovered sphere
h (W m-2 K-1)
Sphere covered by the tissue
h and hef (W m-2 K-1)
Dry tissue Wet tissue
McAdams correlation
Experimental McAdams correlation
Experimental Experimental
0.92 (V1)
30
18.7 24.3 ± 2.1a,A (8.8)
18.9 28.2 ± 1.1a,B (4.0)
76.4 ± 5.3a,C (6.9)
60 72.5 ± 3.5a,C
(4.8)
90 68.0 ± 4.1
a,C (6.1)
1.42 (V2)
30
24.0 32.1 ± 1.8b,A (3.0)
24.3 33.8 ± 2.5b,A (7.3)
97.8 ± 8.2b,B (8.3)
60 93.1 ± 10.8
b,B (11.7)
90 91.3 ± 5.5
b,B (6.0)
a-b Values in the same column with different lowercase letters indicate a significant difference (p < 0.05). A-C Values in the same row with different capital letters indicate a significant difference (p < 0.05).
The difference in water vapor pressure between the wet tissue and the air (quantified by the RH values) is the driving force for mass transfer, promot-ing evaporation and increaspromot-ing heat transfer and, consequently, resulting in hef>h with the same experi-mental setup. Similar results were reported by Raini-eri et al. (2009), who determined local heat transfer coefficients on an aluminum plate coated with a non-wetting material, on which dropwise condensation of water vapor was carried by a humid air stream. The results showed that, for a given air velocity, the heat transfer coefficient between air and the wet surface was up to six times higher than the values deter-mined for the dry surface.
Chilling Times
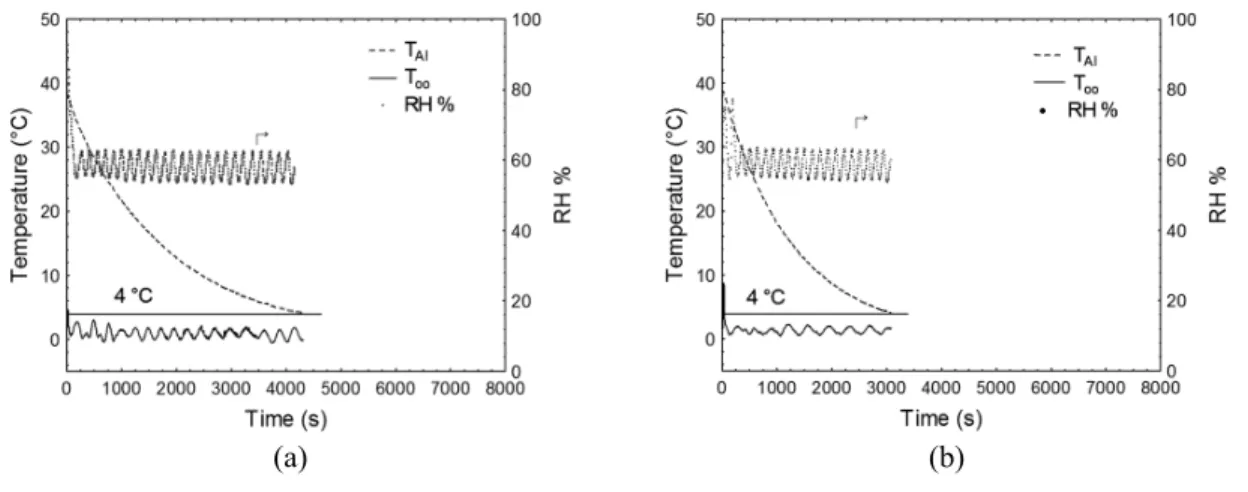
Figure 2 presents time-temperature evolutions as an example of the six experimental replicates for the uncovered aluminum sphere (TAl), covered by dry
tissue, and covered by wet tissue at both air veloci-ties. The dry tissue works as a thermal insulator, reducing heat transfer and increasing chilling time for both air velocities. On the other hand, a great reduction in cooling time was observed (e.g., more than three fold at RH = 60%), as a consequence of water evaporation on the sphere surface covered by the wet tissue. Evaporative cooling phenomena in-creased the heat transfer rates despite the thermal
(c) (d)
(e) (f)
Figure 2: Time-temperature for the aluminum sphere (TAl), cooling air (T∞), and internal (Ti) and
external (Te) cotton tissue surfaces and time-RH evolution at two air velocities (V1 = 0.92 m s-1 and
V2 = 1.42 m s-1): (a) V1and (b) V2- uncovered sphere; (c) V1 and (d) V2- sphere covered by wet tissue
(RH = 60%); (e) V1 and (f) V2- sphere covered by dry tissue.
insulation associated with the wet tissue. This be-havior was observed at all RH conditions and for both air velocities (data not shown).
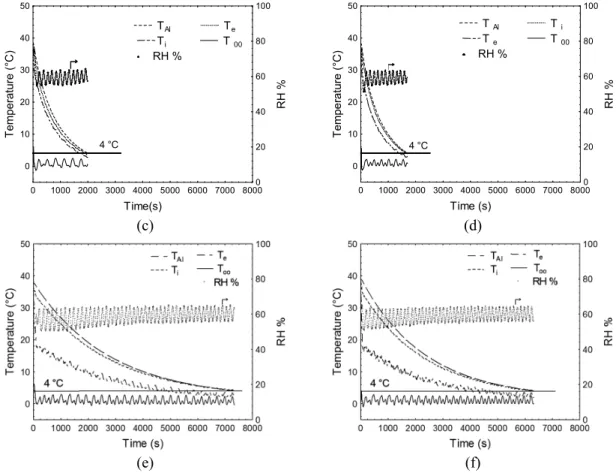
Figure 3 illustrates the cooling time taking into account the core time-temperature evolution in the sphere covered with wet tissue at different RH and air velocities. As expected, the chilling time of the sphere covered with wet tissue decreased with lower RH and with the increase of air velocity inside of chamber. It shows a time increase close to 50% to reach 15 °C and a time increase over 70% to reach 4 °C (V1-90% compared to V2-30%).
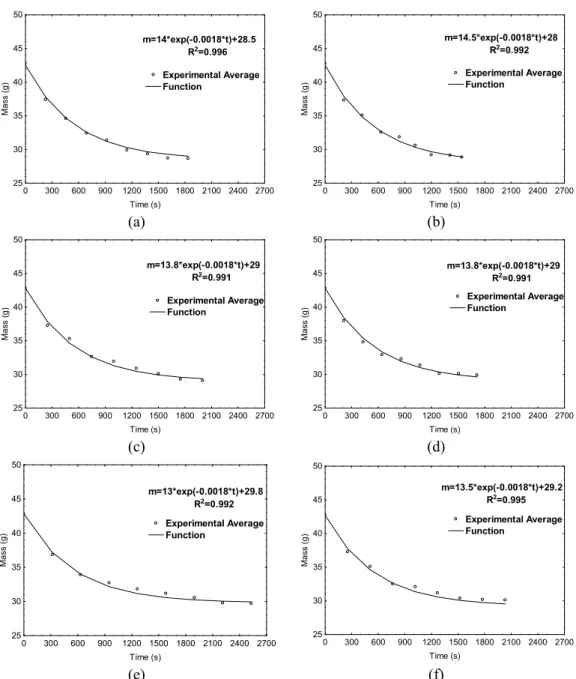
Both experimental and adjusted time-water mass evolution of cotton tissue during evaporative cooling at different RH levels (30%, 60%, and 90%) and air velocities (V1 and V2) are presented in Figure 4. An
initial water mass equal to 0.0338 kg (average values from experimental measurements) was assumed for all simulations. As illustrated in the figure, the
empirical Equation (Eq. (9)) was appropriate to repre-sent the time-water mass evolution in cotton tissue during different experimental cooling conditions.
Figure 3: Cooling time of core time-temperature evo-lution in the sphere covered with wet cotton tissue for different RH and air velocities.
0 1000 2000 3000 4000 5000 6000 7000 8000
Time(s)
0 10 20 30 40 50
T
e
mp
e
ra
tu
re
(
°C
)
0 20 40 60 80 100
R
H
%
TAl Te
Ti T 00
RH %
4 °C
0 1000 2000 3000 4000 5000 6000 7000 8000
Time (s)
0 10 20 30 40 50
T
e
mp
e
ra
tu
re
(
°C
)
0 20 40 60 80 100
R
H
%
T Al T i
T e T 00
RH %
(a) (b)
(c) (d)
(e) (f)
Figure 4: Experimental and adjusted time-water mass evolution of cotton tissue during cooling of the aluminum sphere covered by wet tissue in different conditions: (a) V1-30%,
(b) V2-30%, (c) V1-60%, (d) V2-60%, (e) V1-90%, (f) V2-30%.
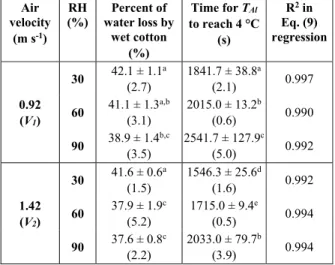
Table 2 summarizes experimental results compar-ing the influence of air velocity and RH on water loss (relative to the initial amount of water and de-termined by wet tissue weight reduction) and chilling time (time to reach TAl = 4 °C). As expected, RH
im-pacted water loss during cooling. Nevertheless, the largest difference was lower than 6% (37.6% and 42.1% of initial water content at V2-90% and V1
-30%, respectively). The longest chilling time was at
V1 and RH = 90% (the worst condition, because of
the highest RH and lowest air velocity), requiring 65% more time to reach 4 °C in the sphere’s core than the process performed at V2 and RH = 30% (the
best condition, because of the highest air velocity and lowest RH). Comparing experiments at the same air velocity, an RH increase from 30% to 90% ex-tended the cooling time by 38% and 31%, at V1 and
V2, respectively. These differences are meaningful
and show the power of evaporative phenomena to enhance heat transfer in this kind of chilling process. 0 300 600 900 1200 1500 1800 2100 2400 2700
Time (s) 25
30 35 40 45 50
Ma
s
s
(
g
) Experimental AverageFunction
m=14*exp(-0.0018*t)+28.5 R2=0.996
0 300 600 900 1200 1500 1800 2100 2400 2700 Time (s)
25 30 35 40 45 50
Ma
s
s
(
g
)
Experimental Average Function
m=14.5*exp(-0.0018*t)+28 R2=0.992
0 300 600 900 1200 1500 1800 2100 2400 2700 Time (s)
25 30 35 40 45 50
Ma
s
s
(
g
) Experimental Average
Function
m=13.8*exp(-0.0018*t)+29 R2=0.991
0 300 600 900 1200 1500 1800 2100 2400 2700 Time (s)
25 30 35 40 45 50
Ma
s
s
(
g
)
Experimental Average Function
m=13.8*exp(-0.0018*t)+29 R2=0.991
0 300 600 900 1200 1500 1800 2100 2400 2700 Time (s)
25 30 35 40 45 50
Ma
ss
(
g
)
m=13*exp(-0.0018*t)+29.8 R2=0.992
Experimental Average Function
0 300 600 900 1200 1500 1800 2100 2400 2700 Time (s)
25 30 35 40 45 50
Ma
ss
(g
)
Experimental Average Function
Table 2: Water loss by the wet tissue caused by the evaporative cooling, chilling time required to reach 4 °C, and correlation coefficients (R2) obtained from
regression of Eq. (9) to the water loss data. Data contain average value ± standard deviation, and coefficient of variation (in parentheses).
Air velocity
(m s-1)
RH (%)
Percent of water loss by
wet cotton (%)
Time for TAl to reach 4 °C
(s)
R2 in
Eq. (9) regression
0.92 (V1)
30 42.1 ± 1.1
a (2.7)
1841.7 ± 38.8a
(2.1) 0.997
60 41.1 ± 1.3
a,b (3.1)
2015.0 ± 13.2b
(0.6) 0.990
90 38.9 ± 1.4
b,c (3.5)
2541.7 ± 127.9c
(5.0) 0.992
1.42 (V2)
30 41.6 ± 0.6
a (1.5)
1546.3 ± 25.6d
(1.6) 0.992
60 37.9 ± 1.9
c (5.2)
1715.0 ± 9.4e
(0.5) 0.994
90 37.6 ± 0.8
c (2.2)
2033.0 ± 79.7b
(3.9) 0.994
a-d
Values in the same column with different letters indicate a significant difference (p < 0.05).
CONCLUSIONS
The experimental approach proposed in this study allows assessing the effective heat transfer coeffi-cient between a metal sphere covered with a moist cotton tissue and forced air. Under the investigated experimental conditions, an effective heat transfer coefficient approximately three-fold higher was found for the sphere covered with the moist cotton tissue. From a practical point of view, it is possible to increase heat transfer by spraying a solid surface (e.g., solid foods) with clean water, if it is tolerable. Moreover, the experimental results showed that it is possible to control product water loss by changing the velocity and RH of the cooling air. Many indus-trial processes, such as food cooling by air blast, can take advantage of these results. Moreover, this exper-imental approach, requiring only temperature meas-urements, can be tested in industrial plants, in which, in general, airflow and properties are expensive and impractical to be measured.
ACKNOWLEDGMENT
The authors are thankful for the financial support from CNPq/Brazil (Projects: 482581/2011-5 and 506556/2013-1) and CAPES/Brazil.
NOMENCLATURE
AAl Surface area of the aluminum sphere,
(m2)
Ae Surface area of the aluminum sphere
covered by the wet cotton tissue, (m2) CV Coefficient of variation,
cAl Specific heat of the aluminum sphere,
(J kg-1 K-1)
cc Specific heat of the wet cotton tissue,
(J kg-1 K-1)
cd Specific heat of the dry cotton tissue,
(J kg-1 K-1)
DAl Diameter of the aluminum sphere, (m)
De Diameter of the aluminum sphere covered
with cotton tissue, (m)
h Convective heat transfer coefficient, (W m-2 K-1)
hef Effective convective heat transfer
coefficient (which considers the thermal and evaporative effect), (W m-2 K-1)
kAl Thermal conductivity of the aluminum
sphere, (W m-1 K-1)
k∞ Thermal conductivity of the gas (cooling air), (W m-1 K-1)
L Characteristic dimension, (m)
mAl Mass of the aluminum sphere, (kg)
mc Mass of the wet cotton tissue, (kg)
md Mass of the dry cotton tissue, (kg)
mw Mass of the water, (kg)
Rconv Convective thermal resistance
Rcot Conductive thermal resistance of cotton
Rsph Conductive thermal resistance of the
sphere
RH Relative humidity
re External radius of the cotton tissue, (m)
ri Internal radius of the cotton tissue, (m)
t Time, (s)
t0 Initial condition of time, (s)
TAl Sphere’s core temperature, (°C)
c
T Average temperature in the cotton spherical
shell, (°C)
Tc(r) Temperature of the spherical shell as a
radial function, (°C)
Te External temperature of the cotton surface,
(°C)
Ti Internal temperature of cotton, (°C)
To Aluminum sphere temperature at time to,
(°C)
T∞ Cooling air temperature, (°C)
V1 Air velocity 1 (0.92 m s-1), (m s-1)
V1-30% Chilling process with air velocity 1 and
RH= 30%
V1-60% Chilling process with air velocity 1 and
RH= 60%
V1-90% Chilling process with air velocity 1 and
RH = 90%
V2-30% Chilling process with air velocity 2 and
RH = 30%
V2-60% Chilling process with air velocity 2 and
RH = 60%
V2-90% Chilling process with air velocity 2 and
RH = 90%
Greek Letters
ν Kinematic viscosity of cooling air, (m2 s-1)
Al Density of the aluminum sphere,
(kg m-3)
ρ∞ Density of the gas (cooling air), (kg m-3)
REFERENCES
Amendola, M. and Teruel, B., Uso de um esquema implícito e de splines para a simulação numérica do processo de resfriamento de frutas esféricas. Rev. Bras. Eng. Agríc. Amb., 9, 78-82 (2005). (In Portuguese).
Becker, B. R. and Fricke, B. A., Heat transfer coefficients for forced-air cooling and freezing of selected foods. Int. J. Refrig., 27, 540-551 (2004). Carciofi, B. A. M. and Laurindo, J. B., Water uptake
by poultry carcasses during cooling by water im-mersion. Chem. Eng. Proc., 46, 444-450 (2007). Carciofi, B. A. M. and Laurindo, J. B., Experimental
results and modeling of poultry carcass cooling by water immersion. Ciênc. Tec. Ali., 30, 447-453 (2010).
Chuntranuluck, S., Wells, C. M. and Cleland, A. C., Prediction of chilling times of foods in situations where evaporative cooling is significant–Part 1. Model development. J. Food Eng., 37, 111-125 (1998).
Cuesta, F. J., Lamúa, M. and Alique, R., A new exact numerical series for the determination of the biot number: Application for the inverse estimation of the surface heat transfer coefficient in food pro-cessing. Int. J. Heat Mass Transf., 55, 4053-4062 (2012).
Dincer, I., New effective Nusselt-Reynolds correla-tions for food-cooling applicacorrela-tions. J. Food Eng., 31, 59-67 (1997a).
Dincer, I., Heat Transfer in Food Cooling Applica-tions. Taylor & Francis, Washington, DC (1997b). Erdogdu, F., Sarkar, A. and Singh, R. P.,
Mathemati-cal modeling of air-impingement cooling of finite slab shaped objects and effect of spatial variation of heat transfer coefficient. J. Food Eng., 71, 287-294 (2005).
Holman, J. P., Heat Transfer. McGraw-Hill, London, UK (1992).
Huezo, R., Smith, D. P., Northcutt, J. K. and Fletcher, D. L., Effect of immersion or dry air chilling on broiler carcass moisture retention and breast fillet functionality. J. Appl. Poult. Res., 16, 438-447 (2007).
Incropera, F. P. and Dewitt, D. P., Fundamentos de transferência de calor e de massa. LTC, Rio de Janeiro, Brazil (2002). (In Portuguese).
James, C., Vincent, C., Lima, T. I. and James, S. J., The primary chilling of poultry carcasses - a re-view. Int. J. Refrig., 29, 847-862 (2006).
Jeong, J. Y., Janardhanan, K. K., Booren, A. M., Harte, J. B. and Kang, I., Breast meat quality and consumer sensory properties of broiler carcasses chilled by water, air, or evaporative air. Poult. Sci., 90, 694-700 (2011).
Landfeld, A. and Houska, M., Prediction of heat and mass transfer during passage of the chicken through the chilling tunnel. J. Food Eng., 72,108-112 (2006).
Laurindo, J. B., Carciofi, B. A. M., Silva, R. R. and Hense, H., On-line monitoring of heat transfer coefficients in a stirred tank from the signatures of the resultant force on a submerged body. Int. J. Refrig., 33, 600-606 (2010a).
Laurindo, J. B., Carciofi, B. A. M., Silva, R. R., Dannenhauer, C. E. and Hense, H., Evaluation of the effects of water agitation by air injection and water recirculation on the heat transfer coeffi-cients in immersion cooling. J. Food Eng., 96, 59-65 (2010b).
Lucas, T. and Raoult-Wack, A. L., Immersion chilling and freezing in aqueous refrigerating media: Review and future trends. Int. J. Refrig., 21, 419-429 (1998).
McAdams, W. H., Heat Transmission. McGraw-Hill, New York (1954).
Mielnik, M. B., Dainty, R. H., Lundby, F. and Mielnik, J., The Effect of evaporative air chilling and storage temperature on quality and shelf life of fresh chicken carcasses. Poult Sci., 78, 1065-1073 (1999).
Rainieri, S., Bozzoli, F. and Pagliarini, G., Effect of a hydrophobic coating on the local heat transfer co-efficient in forced convection under wet condi-tions. Exp. Heat Transf., 22, 163-177 (2009). Sun, D.-W. and Wang, L., Experimental investigation
of performance of vacuum cooling for commer-cial large cooked meat joints. J. Food Eng., 61, 527-532 (2004).
Teruel, B., Cortez, L. and Neves Filho, L., Estudo comparativo do resfriamento de laranja valência com ar forçado e com água. Ciênc. Tec. Ali., 23, 174-178 (2003). (In Portuguese).
Trujillo, F. C. and Pham, Q. T., A Computational fluid dynamic model of the heat and moisture transfer during beef chilling. Int. J. Refrig., 29, 998-1009 (2006).