ISSN 0104-6632 Printed in Brazil
www.abeq.org.br/bjche
Vol. 23, No. 02, pp. 163 - 170, April - June, 2006
Brazilian Journal
of Chemical
Engineering
PARAMETERS OPTIMIZATION FOR
ENZYMATIC ASSAYS USING
EXPERIMENTAL DESIGN
J. F. M. Burkert
2, S. J. Kalil
1*, F. Maugeri Filho
2, M. I. Rodrigues
21
Department of Chemistry, Federal University of Rio Grande (FURG), Phone +(55) (53) 233-8754, Fax: +(55) (53) 233-8720
Rua Engenheiro Alfredo Huch 475, CP 474, CEP 96201-900, Rio Grande - RS, Brazil. E-mail: [email protected]
2
Department of Food Engineering, School of Food Engineering, State University of Campinas, (UNICAMP), Cx. P.6121, CEP: 13083-970, Campinas - SP, Brazil.
(Received: July 9, 2003; Accepted: March 10, 2006)
Abstract - The conditions for maximization enzymatic activity were determined using experimental design and inulinase from Kluyveromyces marxianus ATCC 16045. The effects of substrate concentration (sucrose and inulin), pH and temperature on inulinase activity were verified using four factorial design and surface response analysis. Using sucrose as substrate. It has bean shown that the effects sucrose on enzymatic activity is not statistically significant and the best condition for the highest activity (110 U/mL) was achieved with temperature between 60°C and 68°C and pH between 4.5 and 5.0. Using inulin as substrate it was verified that temperature is the only variable statistically significant and the maximum activity was 7.3 U/mL at temperature between 50°C and 51°C.
Keywords: inulinase, Kluyveromyces marxianus, activity, factorial design and response surface analysis.
INTRODUCTION
Inulin occurs as a reserve carbohydrate in the roots and tubers of plants like Jerusalem artichoke, chicory, or dahlia. It represents good sources of high fructose, calorie-reduced sweeteners and consists of linear β-2,1-linked poly-fructose chains displaying a terminal glucose unit (Vandamme and Derycke, 1993). The β-fructofuranosidases were called inulinases since they hydrolyzed inulin.
Microbial inulinases have been described in fungi, e.g., Penicillium sp. TN88 (Nakamura et al., 1997), Aspergillus species (Vandamme and Derycke, 1993; Nakamura et al., 1994; Ettalibi and Barotti, 1987) and Fusarium oxysporum (Kaur et al., 1992), yeasts, e.g., Kluyveromyces marxianus CDBB-L-278
(Guerrero et al., 1995), Kluyveromyces fragilis and
Debaryomyces cantarelli (Barthomeuf et al., 1991), Candida kefyr (Negoro and Kito, 1973), and
bacteria, e.g., Bacillus circulans (Kushibe et al., 1995), Clostridium acetobutylicum ABKn8
(Efstahion et al., 1986), Pseudomonas sp. (Kim et al., 1997).
The enzymatic hydrolysis of inulin using inulinase to produce fructose has been shown to give lower by-product formation than acid hydrolysis and can be obtained with one hydrolysis step (Zittan, 1981), therefore these enzymes are potentially useful for the preparations of high fructose syrups from inulin (Ettalibi and Barotti, 1987).
conditions to obtain the highest activity. Factorial design of a limited set of variables is advantageous in relation to the conventional method of the manipulation of a single parameter per trial, as such an approach frequently fails to locate optimal conditions due to its failure to consider the effect of possible interactions between factors (Kalil et al., 2000). In this work, on the ranges usually reported by literature the effect of substrate concentration, pH and temperature on inulinase activity was studied.
MATERIAL AND METHODS
Fermentation
Kluyveromyces marxianus ATCC 16045 was
employed for inulinase production. The microorganism was grown on YM broth. The inoculum cultures were grown on a medium containing 2% sucrose with pH at 6.5. Inulinase was produced in a 500 mL flask with 100 mL of culture
medium with 14 g/L of sucrose, 10 g/L of yeast extract, 20 g/L of peptone and pH at 3.5 (Kalil et al., 2001). The fermentation was carried out with 10% inoculum at 30°C on a rotary shaker (150 rpm for 48 hours).
Experimental Design
In this work, the effects of sucrose (first factorial design) and inulin (second factorial design) concentration, pH and temperature on inulinase activity were investigated using a factorial design with 23 trials plus 3 central points. Table 1 shows the values of coded levels used in the first and second factorial design.
The variables pH and temperature were chosen for the next two complete factorial design (22 trials plus star configuration and 3 central points). One experimental design was carried out using sucrose (2% w/v) as substrate and other using inulin (2% w/v). The Table 2 shows the of coded levels used in the third and fourth factorial design.
Table 1: Values of coded levels used in the first and second factorial designs.
Level -1 0 +1
Sucrose or inulin(%) 2 3.5 5.0
pH 4.5 5.0 5.5
Temperature (°C) 50 60 70
Table 2: Values of coded levels used in the third and fourth factorial designs.
Level -1.41 -1 0 +1 +1.41
pH 4.5 4.64 5 5.36 5.5
Temperature (°C) 40 44.4 55 65.6 70
Inulinase Assay
Activity was assayed as follows: the broth was centrifuged for 10 minutes at 10000 g, 1mL of this enzyme solution was mixed with 9mL of sucrose or inulin solution on acetate buffer 0.1M, pH, temperature and concentration were in accordance with the test. The rate of appearance of fructose was determined by the DNS method (Miller, 1959). One unit of inulinase activity is defined as the amount of enzyme catalyzing the liberation of 1μmol of fructose per min under the conditions above mentioned.
RESULTS AND DISCUSSION
Table 3 shows the trials and results for the first factorial design. Enzimatic activity ranged from 3 to 100 U/mL, according the experimental condition. When high pH and high temperature were used the activity was lower.
Table 4 and Figure 1 show the effects of the variables and the interactions on inulinase activity.
statistically significant at 95% of confidence. Both variable show negative effects since the inulinase activity decrease with an increase in these variables. The same study was performed using inulin as substrate. The results of this second factorial design are shown in Table 5.
Table 6 shows the variables effects and variable interactions on inulinase activity from the second factorial design.
It can be seen that the temperature is the most important variable, with a negative effect, wich means that an increase in the temperature lead to a decrease in the enzymatic activity.
These results makes it possible to define the most important variables, so that complete factorial design can be elaborated to determine the optimal range for activity. The variables selected for each substrate were pH and temperature.
Table 3: Study of sucrose concentration, pH and temperature on inulinase activity (first factorial design).
Trial % Sucrose pH Temperature
(°C)
Activity (U/mL)
1 -1 -1 -1 98.82
2 1 -1 -1 102.57
3 -1 1 -1 70.83
4 1 1 -1 71.55
5 -1 -1 1 46.82
6 1 -1 1 53.57
7 -1 1 1 3.62
8 1 1 1 7.42
9 0 0 0 100.75
10 0 0 0 94.84
11 0 0 0 103.17
Table 4: Effect estimates from the first factorial design.
Factor Effect Std. Err. t(2) p
Mean 68.54 1.29 53.05 0.000355
Sucrose (1) 3.75 3.03 1.24 0.34
pH (2)* -37.09 3.03 -12.24 0.006608
Temperature (3)* -58.08 3.03 -19.17 0.002710
1 x 2 -1.50 3.03 -0.49 0.670590
1 x 3 1.52 3.03 0.50 0.665693
2 x 3** -7.58 3.03 -2.50 0.129336
*p<0.05 (significant for a 95 % confidence level) **p<0.15 (significant for a 85 % confidence level)
effect
-80 -60 -40 -20 0 20 40 60 80
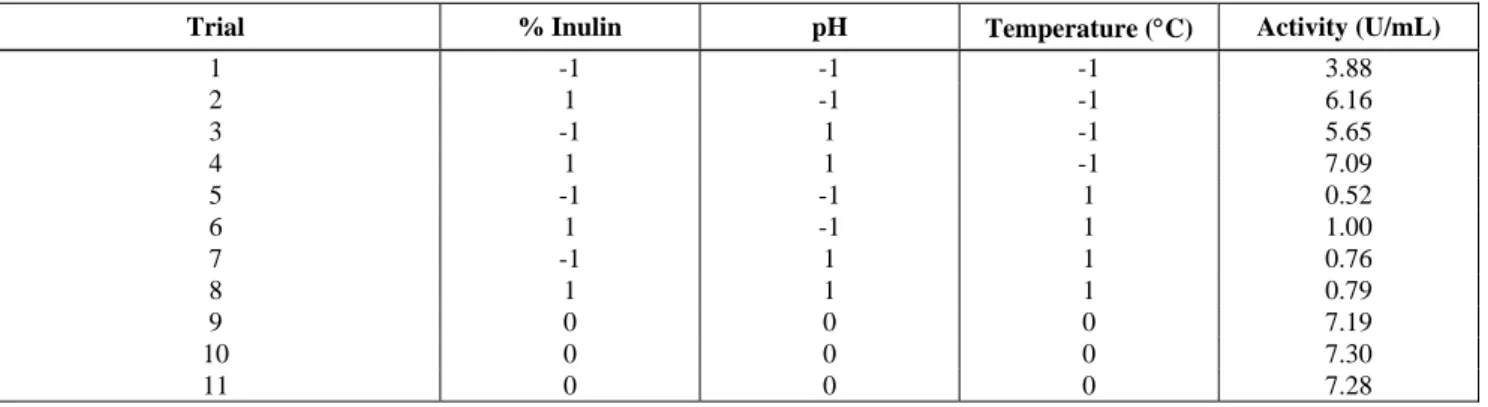
Table 5: Study of inulin the effects of concentration, pH and temperature on inulinase activity (second factorial desing).
Trial % Inulin pH Temperature (°C) Activity (U/mL)
1 -1 -1 -1 3.88
2 1 -1 -1 6.16
3 -1 1 -1 5.65
4 1 1 -1 7.09
5 -1 -1 1 0.52
6 1 -1 1 1.00
7 -1 1 1 0.76
8 1 1 1 0.79
9 0 0 0 7.19
10 0 0 0 7.30
11 0 0 0 7.28
Table 6: Effect estimates from the second factorial design.
Factor Effect Std. Err. t(2) p
Mean 4.33 0.02 271.40 0.000014
Inulin (1)* 1.06 0.04 28.26 0.001250
pH (2)* 0.68 0.04 18.24 0.002992
Temperature (3)* -4.93 0.04 -131.69 0.000058
1 x 2* -0.32 0.04 -8.62 0.013195
1 x 3* -0.80 0.04 -21.45 0.002167
2 x 3* -0.67 0.04 -17.84 0.003127
*p<0.05 (significant for a 95 % confidence level)
The third factorial design was carried out using sucrose (S) as substrate and the fourth one using inulin (I). The results for invertase (S), inulinase (I) and the ratio (S/I) are presented in the Table 7. The ratio invertase by inulinase activitys (S/I) is an important parameter because it shows if the enzyme is a true inulinase (S/I<100) or an invertase (S/I>100) (Ettalibi and Barotti, 1987). Figure 2 shows the relation S/I for each trial. It can be noticed that S/I can from 9.5 to 77.2, according to the experimental condition. However all S/I
results are lower than 100, so the enzyme is an inulinase.
It can be seen in Figure 2 show that high temperatures (level +1 and +1.41) led to low inulinase activities, while the activity on sucrose is higher and consequently the ratio S/I increase. A decrease in the temperature (level –1 and –1.41) led to a decrease in activity on sucrose and also in S/I ratio. Therefore, different reaction conditions changes the activity on inulin or sucrose, and the optimum depends of the final application desired.
Table 7: Third and fourth factorial designs.
Trial pH Temperature
Activity on sucrose (S) (U/mL)
Activity on inulin (I)
(U/mL)
S/I
1 -1 -1 61.54 5.7 9.47
2 1 -1 58.76 6.03 9.74
3 -1 1 131.83 1.54 71.64
4 1 1 105.82 2.85 37.13
5 -1.41 0 97.01 8.69 11.16
6 1.41 0 91.95 7.38 12.46
7 0 -1.41 57.44 5.6 10.26
8 0 1.41 81.81 1.06 77.18
9 0 0 109.92 7.48 14.69
10 0 0 113.79 6.52 17.45
0 20 40 60 80 100
1 2 3 4 5 6 7 8 9 10 11
Trial
S/
I
Figure 2: S/I relation for each trial in the third and fourth factorial designs.
The results obtained showed that the inulinase from
Kluyveromyces marxianus CBS 6556 has an S/I ratio
of 13 for the crude preparation of supernatant inulinase at pH 4.5 and 50°C (Rouwenhorst et al., 1990). The use of the same conditions of pH and temperature in the mathematical models established by equations 1 and 2 gives the relation with value of 13.08 for the S/I ratio, what is a similar result. The knowledge of the dependence of enzyme activity on pH, temperature allows to prediction compare the S/I ratio in different conditions.
Activity (sucrose) = 110.94 - 4,5.pH - 6.36. pH2 +
+19.02.Temp - 18.87.Temp2 -5.81.pH.Temp (1)
Table 8 shows the analysis of variance
(ANOVA) for the activity using sucrose as substrate. The correlation coefficient was 0.91for inulinase activity and F-test was higher than the listed value at 90% of confidence. Consequently, models were found to be adequate to describe the response surface of inulinase production (equation 1) (Box et al., 1978).
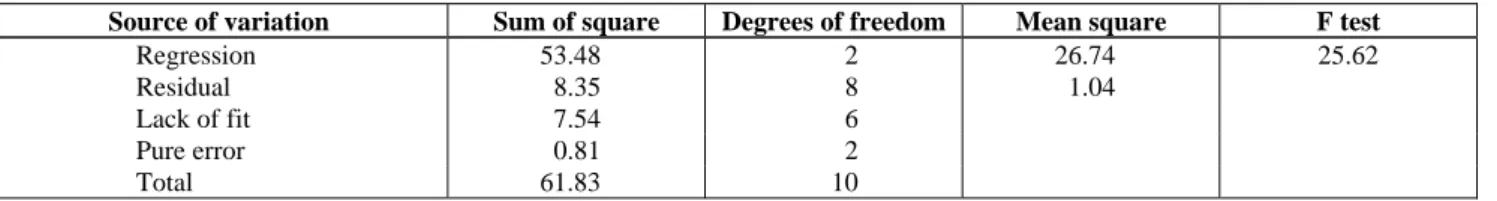
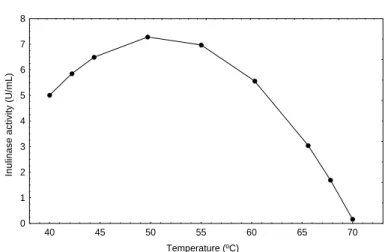
Table 9 shows the analysis of variance (ANOVA) for the inulinase activity using inulin as substrate. The correlation coefficient is 0.93 and the F value around six times higher than the listed value for 95% of confidence. When effects, which are not statistically significant, are ignored the activity becames a function only of the temperature (equation 2). The first derived of this function indicates an optimum for activity when the temperature is around 50°C.
Table 8: ANOVA for third factorial design using sucrose as substrate.
Source of variation
Sum of square
Degrees of freedom
Mean
square F test
Regression 5181.15 5 1036.23 4.98
Residual 1039.54 5 207.91
Lack of fit 1027.35 3
Pure error 12.19 2
Total 6220.69 10
F0.90; 5; 5 = 3.45; Correlation coefficient: R=0.91
Table 9: ANOVA for the fourth factorial design using inulin as substrate.
Source of variation Sum of square Degrees of freedom Mean square F test
Regression 53.48 2 26.74 25.62
Residual 8.35 8 1.04
Lack of fit 7.54 6
Pure error 0.81 2
Total 61.83 10
Activity (inulin) = 6.97 - 1.72.Temp - 2.21.Temp2 (2)
Using equations 1 and 2 is possible to obtain the response surfaces for inulinase activity as response using sucrose (Figure 3) or inulin (Figure 4) as substrate.
When the sucrose is the substrate the maximum inulinase activity is around 110 U/mL with the pH between 4.5 and 5 and temperature between 60 and 68°C. It can be seen with Figure 3 the increase in temperature led to an increase in the inulinase activity. If the substrate is inulin the pH is not statistically significant and only the temperature is important. In this case, a decrease in the temperature is shown to be favorable correlated to the increase in the enzymatic activity. The optimum is achieved with a reaction temperature around 50-51°C, with a final activity of 7.3 U/mL.
The optimum temperature for sucrose hidrolysis was higher than for inulin. Some authors reported the same behavior for both inulin and sucrose (Guerrero et al., 1995; Rouwenhorst et al., 1988). The variation of pH from 4 to 6 did not changed the activity on inulin. However, sucrose there was an increase in the activity on sucrose at pH around pH 5 (Guerrero et al., 1995). These results are similar to the ones obtained this work.
The study on the inulinase production by
Kluyveromyces marxianus using inulin as
substrate obtained 0.47 U/mL of inulinase activity (Selvakumar and Pandey, 1999). Therefore, in this work the inulinase activity optimized achieved 7.3 U/mL using inulin as substrate. This value is about 15 times higher than the finded in the literature.
34.340 39.922 45.503 51.084 56.666 62.247 67.829 73.410 78.992 84.573 90.155 95.736 101.317 106.899 112.480 above
(a)
pH
T
e
mperat
ure (
0 C)
40 44.4 55 65.6 70
4.5 4.64 5 5.36 5.5
(b)
Temperature (ºC)
Inulinase activity (U
/m
L)
0 1 2 3 4 5 6 7 8
40 45 50 55 60 65 70
Figure 4: Inulinase activity on inulin, as a function of temperature.
CONCLUSIONS
The methodology of factorial design was shown to be very useful for the process optimization. The enzyme used in this work, inulinase from
Kluyveromyces marxianus, was show to have
different profiles consider either sucrose as inulin as substrate. The inulinase activity on sucrose was influencied by temperature and pH of reaction. The best result was achieved at pH between 4.5 and 5.0 and temperature between 60°C and 68°C with final activity around 110 U/mL. When the inulin was the substrate the temperature was the only variable statistically significant and the higher activity, 7.3 U/mL, was obtained at temperature of 50°C. In this condition the relation S/I sucrose activity/inulin activity was about 15. However, it is possible to obtain ratios changing from 9.5 to 77.2, because the best conditions are not the same for each substrate. The chosen conditions depend on the application desired.
ACKNOWLEDGEMENTS
This work received financial support from FAPESP and CAPES.
REFERENCES
Barthomeuf, C., Regerat, F. and Pourrat, H., Production of inulinase by a new mold of
Penicillium rugulosum, J. Ferment. Bioeng. 72, 491-494 (1991).
Box, G.E.P., Hunter, W.G. and Hunter, J.S., Statistics for Experimenters: An Introduction to Design, Data Analysis, and Model Building, Jonh Wiley & Sons, New York (1978).
Efstathion, I., Reyset, G., and Truffaut, N., A study of inulinase activity in the Clostridium
acetobutylicum strain ABKn8, Appl. Microbiol. Biotechnol. 25, 143-149 (1986).
Ettalibi, M. and Baratti, C., Purification, properties and comparison invertase, exoinulinases and endoinulinases of Aspergillus ficuum, Appl. Microbiol. Biotechnol. 26, 13-20 (1987).
Guerrero, A. C., Pena, I. G., Barzana, E., Garibay, M. G. and Ruiz, L. G., Kluyveromyces marxianus CDBB-L-278: a wild inulinase hyperproducing strain, J. Ferment. Bioeng. 80, 159-163 (1995). Kalil, S. J., Maugeri, F. and Rodrigues, M. I.,
Response surface analysis and simulation as a tool for bioprocess design and optimization, Process Biochem. 35, 539-550 (2000).
Kalil, S. J., Suzan, R., Maugeri, F. and Rodrigues, M. I., Optimization of inulinase production by Kluyveromyces marxianus using factorial design, Applied Biochem. Biotech.94, 257-264 (2001). Kaur, N., Kaur, M., Gupta, A.K., SINGH, R.,
Properties of β-fructosidases (invertases and inulinases) of Fusarium oxysporum grown on an aqueous extract of Cichorium intybus roots, J. Chem. Tech. Biotechnol. 53, 279-284 (1992). Kim, D.H., Choi, Y.J., Song, S.K., and Yun, J.W.,
Production of inulo-oligosaccharides using endo-inulinase from a Pseudomonas sp., Biotechnol. Lett. 19, 369-374 (1997).
of cycloinulooligosaccharide fructanotransferase (CFTase) from Bacillus circullans MCI-2554, Biosci. Biotech. Biochem. 59, 31-34 (1995).
Miller, G.L., Use of dinitrosalicylic acid reagent for determination of reducing sugar, Analytical Chemistry. 31, 426-428 (1959).
Nakamura, T., Nagatomo, Y., Hamada, S., Nishino, Y., and Ohta, K., Occurrence of two forms of extracellular endoinulinase from Aspergillus niger mutant 817, J. Ferment. Bioeng. 78, 134-139 (1994).
Nakamura, T., Shitara, A., Matsuda, S., Matsuo, T., Suiko, M. and Ohta, K., Production, purification and properties of an endoinulinase of Penicillium sp. TN-88 that liberates inulotriose, J. Ferment. Bioeng. 84, 313-318 (1997).
Negoro, H., and Kito, E., β-fructofuranosidase from
Candida kefyr, J. Ferment. Technol. 51, 96-102 (1973).
Rouwenhorst, R.J., Hensing, M., Verbakel, J.,
Scheffers, W. A. and Van Dijken, J. P., Structure and properties of the extracellular inulinase of
Kluyveromyces marxianus CBS 6556, Appl.
Environ. Microbiol. 56, 3337-3345 (1990). Rouwenhorst, R. J., Visser, L. E., Van Der Baan, A.
A., Scheffers, W. A. and Van Dijken J. P., Production, distribution, and kicectic properties of inulinase in continuous cultures of
Kluyveromyces marxianus CBS 6556, Appl.
Environ. Microbiol. 54, 1131-1137 (1988).
Selvakumar, P. and Pandey, A., Solid state fermentation for the synthesis of inulinase from
Staphylococcus sp. and Kluyveromyces
marxianus, Biores. Technol. 69, 123-127 (1999). Vandamme, E. J. and Derycke, D.G., Fermentation
process, properties and applications, Advanc. Appl. Microbiol. 29, 139-176 (1993).