Article
Printed in Brazil - ©2015 Sociedade Brasileira de Química0103 - 5053 $6.00+0.00A
*e-mail: [email protected]
Optimization of Parameters for Extraction of Avenanthramides from Oat
(
Avena sativa
L.) Grain Using Response Surface Methodology (RSM)
Maria Maliarova,*,a Viera Mrazova,a Michaela Havrlentovab,c and Jozef Sokola
aDepartment of Chemistry and bDepartment of Biotechnologies, Faculty of Natural Science,
University of Ss.Cyril and Methodius (UCM), Trnava, Slovak Republic
cNational Agricultural and Food Centre, Research Institute of Plant Production (NAFC-RIPP),
Piešťany, Slovak Republic
Avenanthramides play a role as phytoalexins in oat. Recently, various bioactivities have been found in avenanthramides as an antioxidant activity, anti-inflammatory, anti-atherogenic and anti-proliferative effect. In this study, the optimal conditions for the extraction of avenanthramides 2c, 2p and 2f from oat grain, cultivar Avenuda, were determined using response surface methodology (RSM). The effects of three independent variables (methanol concentration, extraction temperature and time) on the yield of aventhramides were investigated. A second-order polynomial model adequately fitted the experimental data with the R2 values of 0.959, 0.970
and 0.984 for the response of avenanthramides 2c, 2p and 2f, respectively. The optimization method which combined RSM with desirability function was chosen to find the best extraction conditions. The optimal conditions for the highest yield of avenanthramides were a methanol concentration of 70%, extraction temperature 55 °C and time 165 min. Under these conditions, the yields of avenanthramides 2c, 2p and 2f were 9.70 ± 0.38 mg kg-1, 10.05 ± 0.44 mg kg-1 and
19.18 ± 0.80 mg kg-1 oat grain, respectively.
Keywords: avenanthramides, response surface methodology, liquid chromatography, oat
Introduction
The study of nutritional and biological activities of phytochemicals in grains has increased during the past decade. Avena sativa L., commonly known as oat, has been grown for more than 4000 years as a food and used in traditional medicine. Oat is now cultivated worldwide and is mainly produced in Russia, Canada, United States and the wetter climates of Northwest Europe. Oat is a very nutritious food, which has been recognized as a nutraceutical and a vitalizer. Nevertheless, it is consumed in much lower quantities worldwide in comparison to wheat and rice. The oat is a rich source of proteins, important minerals, lipids, and vitamins B and E.1 Moreover, it includes many
bioactive phytochemicals such as β-glucan (a mixed-linkage polysaccharide, which forms an important component of oat dietary fiber), the indol alkaloid gramine, with weak sedative effects, phenolic compounds and tocols with antioxidant activity. More importantly, more than 25 unique compounds, avenanthramides, exist exclusively in oat. They
act as antipathogens (phytoalexins) produced by the plant in response to exposure to pathogenic micro-organisms.2-4
Avenanthramides are a group of alkaloids that consist of an anthranilic acid derivative linked to a hydroxycinnamic acid derivative by a pseudo peptide bond. They have been classified according to nature of the alkaloid: anthranilic acid (type 1), 5-hydroxyanthranilic acid (type 2) and 5-hydroxy-4-methoxyanthranilic acid (type 3), and that of the linked cinnamic acids: para-coumaric acid (type p), caffeic acid (type c), ferulic acid (type f), sinapic acid (type s). Therefore, avenanthramides could be classified also as polyphenols.5,6
The most abundant avenanthramides in oat are 2c, 2p and 2f, respectively. The avenanthramides exhibit significant biochemical properties, such as antioxidant activity in vitro7-10
and in vivo,11-13 antiproliferative,14-16 anti-atherogenic,17
anti-inflammatory and antipruritic effects.18-20 These
low-molecular-weight compounds have been found in various concentrations in oat groats, hulls and leaves.21,22
The total content of avenanthramides in oat grain has been found to be about 2 to 700 mg kg-1, depending on the cultivar
and agronomic treatment.23,24 Extraction of avenanthramides
such as pure or diluted ethanol and methanol. Extraction procedures were achieved over different times at room temperature or under controlled heating (50 °C, microwave-assisted extraction).24-28 The quantitative variation of oat
avenanthramides in different extraction procedures, such as extraction solvent, extraction temperature and time has not been extensively studied. Therefore, it is vital to develop and optimize extraction methods to provide real composition and optimum levels of avenanthramides in oat grain. The traditional method of optimization is laborious and time consuming. In this method, since one factor at time is taken into consideration, the interactive effect of individual factors is unknown and hence, the chances of obtaining the true optimum conditions are dubious.29 As a consequence, the
response surface methodology (RSM), originally described by Box and Wilson,30 is an effective tool for optimizing this
process. RSM enables evaluation of the effects of several different process variables and their interactions on response variables. RSM is based on the fit of empirical models to the experimental data obtained in relation to experimental design. Toward this objective, linear or square polynomial functions are employed to describe the system studied and, consequently, to explore experimental conditions for its optimization.31,32 RSM has been successfully used to model
and optimize extraction of polyphenols, phenolic compounds and antioxidants from plants, such as wheat and wheat bran, apple, wood apple, dark fresh fig, Mangifera pajang, gardenia and lemon balm.29,33-39
The object of this study was to evaluate the effect of extraction parameters: solvent composition, extraction temperature and time on the recovery of the dominant avenanthramides 2c, 2p and 2f. In addition, to optimize the extraction conditions for obtaining maximum yield of avenanthramides using RSM, we employed a five-level, three-variable central composite design.
Experimental
Avena sativa grains samples
Naked oat, cultivar Avenuda, was cultivated in the experimental area of the Research and Breeding Station at Vígľaš-Pstruša (48o32'N, 19o10'E) of the National
Agricultural and Food Centre, Research Institute of Plant Production Piešťany, Slovak Republic. Grains were harvested in August 2012.
Reagents
Methanol, ethanol 96%, isopropanol and formic acid were obtained from Mikrochem (Slovak Republic)
and were of analytical grade. High-performance liquid chromatography (HPLC) grade acetonitrile was purchased from J. T. Baker (Netherlands). Mobile phase mixture preparations were made using ultrapure water prepared with the Simplicity from Millipore Merck purification system (USA). Avenanthramides A (2p), B (2f), C (2c) were purchased from ReseaChem (Switzerland). In accordance to certificate of analysis from ReseaChem avenanthramides were HPLC grade (99.9%).
Extraction procedure
Naked oat, cultivar Avenuda, was milled and passed through a 0.5 mm sieve just before the extraction procedure. Subsequently, ca. 300 mg of oat bran were accurately weighed in a 15 mL tube and 3 mL of corresponding solvent was added. The samples were extracted at selected temperatures and time periods (see Experimental section) on an orbital thermoshaker, in the dark. The samples were then centrifuged at 6500 g for 5 min. The supernatants were kept at −20 °C until HPLC analysis was carried out. The supernatants were immediately centrifuged repeatedly before analysis and then directly injected without dilution into the HPLC system. Extraction solutions (supernatants) were injected three times.
Chromatographic analysis
The determination and quantification of avenanthramides 2c, 2p and 2f were measured using the method proposed by Chu et al.40 with slight modification. HPLC separation,
identification and quantification were performed on Waters HPLC system (Waters, USA) equipped with HPLC 1525 binary pump, 2998 photodiode array (PDA) detector, Heather column 1500, software Empower 2 and Waters Symmetry C18 column (75 × 4.6 mm i.d., 3.5 µm). A gradient elution system consisting of solvent A (water with 5% acetonitrile and 0.1% formic acid) and B (acetonitrile with 0.1% formic acid) was used for the analysis. A linear gradient of 13 to 30% solvent B over 20 min at a flow rate of 1.0 mL min-1 was employed. The column
temperature was set at 30 oC and the injection volume
was 20 µL. The diode-array detector was performed at 340 nm. The detected peaks were identified by comparing their retention times and ultraviolet (UV) spectra with the standards avenanthramides A (2p), B (2f) and C (2c). The concentrations of avenanthramides were calculated by referring to the calibration curves. The equations of the avenanthramides calibration curves were for 2c: y = 95408x – 7500, R2 = 0.999; for 2p: y = 88248x – 3635, R2 = 0.999;
x = concentration of standard in µg mL-1, R2 = coefficient
of determination for 5 data points in calibration curves).
Experimental design
It is necessary to choose an experimental design, to fit an adequate mathematical function, and to evaluate the quality of the fitted model and its accuracy to make previsions in relation to the experimental data obtained. The central composite design is still the symmetrical second order experimental design most utilized for the development of analytical procedures. The central composite design was presented by Box and Wilson.30
This design consists of the following parts: a full factorial or fractional factorial design; an additional design, often a star design in which experimental points are at a distance from its center, and a central point.32
Three factor, five level central composit design in three block was used for experimental design. Independent variables were temperature (30-60 oC; X
1), composition
of methanol (70-90% (v/v) methanol in water; X2), and
time (80-280 min; X3). The following equation 1 was
applied to transform a real value (Xi) into a coded value
(xi) according to a determinate experimental design:
i i i i
X X X x
∆ −
= (1)
where ∆Xi is the distance between the real value in the central point and the real value in the superior or inferior level of a variable, and X–i is the real value in the central point. The independent variables, their coded and real values are shown in Table 1.
The central composite design (CCD) consists of 17 experimental runs with three replications at the centre point. Table 2 lists the actual experimental parameters corresponding to the designed levels.
Each experiment was performed in duplicate. Each HPLC analysis was performed in triplicate. The amount of avenanthramides 2c, 2p and 2f were expressed in mg per kg oat grain. The values in Table 2 are reported an averages, the relative deviations were less than 3%.
Table 1. Independent variables and their coded and real values employed in a central composite design for optimization
Independent variable Coded levels
−1.68 −1 0 1 1.68
Temperature / oC 19.8 30 45 60 70.2
Composition of methanol / % 63.2 70 80 90 96.8
time / min 12 80 180 280 348
Table 2. Central composite design of five-level in real and coded (numbers in round brackets) form of three independent variables and the responses,
dependent variables, amount of avenanthramides 2c, 2p and 2f, respectively
Number X1
Temperature / oC
X2 Composition of
methanol / %
X3 time / min
Amount of avenanthramides / (mg kg-1 oat grain)
2c (Y1) 2p (Y2) 2f (Y3)
1 30 (−1) 70 (−1) 80 (−1) 7.85 7.69 15.04
2 30 (−1) 70 (−1) 280 (+1) 8.12 8.73 16.27
3 30 (−1) 90 (+1) 80 (−1) 5.27 5.14 9.91
4 30 (−1) 90 (+1) 280 (+1) 6.85 6.31 12.90
5 60 (+1) 70 (−1) 80 (−1) 9.37 9.10 17.03
6 60 (+1) 70 (−1) 280 (+1) 10.16 11.11 21.24
7 60 (+1) 90 (+1) 80 (−1) 7.43 7.81 15.73
8 60 (+1) 90 (+1) 280 (+1) 7.06 7.75 14.99
9 20 (−1.68) 80 (0) 180 (0) 7.29 7.20 13.56
10 70 (+1.68) 80 (0) 180 (0) 8.76 9.37 17.65
11 45 (0) 63 (−1.68) 180 (0) 8.08 8.93 17.52
12 45 (0) 97 (+1.68) 180 (0) 5.48 6.27 11.38
13 45 (0) 80 (0) 12 (−1.68) 7.08 6.69 13.82
14 45 (0) 80 (0) 348 (+1.68) 8.90 8.37 15.98
15 45 (0) 80 (0) 180 (0) 9.42 9.37 18.56
16 45 (0) 80 (0) 180 (0) 9.55 8.92 17.13
Mathematical model
In order to determine a critical point (maximum, minimum), it is necessary for the polynomial function to contain quadratic terms. A second-order polynomial equation was used to express the yield of avenanthramid 2c (Y1), avenanthramide 2p (Y2) and avenanthramide 2f (Y3)
as a function of the independent variables as follows:
∑ ∑
∑
∑
−= = =
=
+ +
+ =
1
1 2 1
2
1 0
k
i j
j i ij k
i i ii k
i i i
z b bX b X b X X (2)
where Xi and Xj are independent variables responsible for response Yz, k is number of variables and bo, bi, bii, bij
represents regression coefficients of variables for intercept, linear, quadratic and interaction terms, respectively.
Statistical analysis
The regression coefficients, the optimization of the conditions and statistical processing were determined by Statgraphics Centurion XVI (Statpoint Technologies, USA).
Results and Discussion
Selection of optimization ranges
Extraction is the initial and most important method in the recovery and purification of bioactive compounds from plant material. An extraction solvent system is generally selected according to the intention of extraction, polarity of the interested compounds, polarity of the undesirable compounds, as well as the cost and safety. Aqueous alcohols with different water contents have been used to extract phenolic compounds from cereal grains and wheat bran.33,41 Pure methanol,42,43 80% methanol,28 80%
ethanol in water23,25-27,40 and 50% ethanol24 were used for
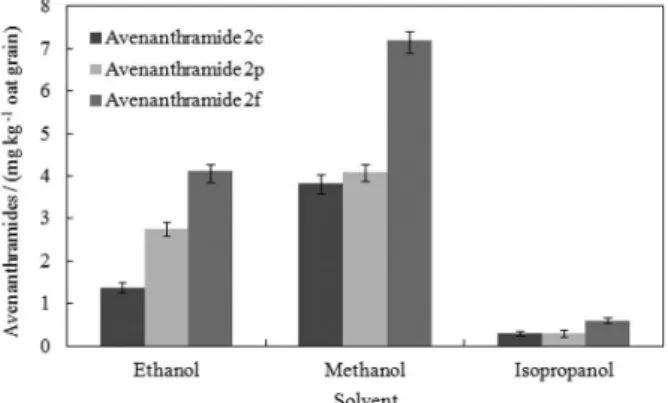
the extraction of avenathramides from oat. In this paper, the efficiency of methanol, ethanol and isopropanol on the extraction of avenanthramides from oat was compared. The yield of avenanthramides 2c, 2p and 2f in oat extracted with various solvents are shown in Figure 1.
Significant differences in aventhramides contents were observed among the various solvent extracts. Methanol extract contained the highest level of avenanthramides, followed by ethanol extract and isopropanol extract. Hence, methanol was used as extraction solvent in the following study. Figure 2 shows the effect of methanol-water mixtures on the content of avenanthramides in oat.
When methanol concentration increased from 40% to 80% (v/v), the content of avenanthramides 2c, 2p and
2f in oat extract increased. The use of the pure methanol as the extraction solvent lead to a considerable decrease of avenanthramides in oat extract. A similar result was reported in a recent study.28 Based on the observed results,
the methanol concentration range selected was 70-90% (v/v) aqueous solution of methanol.
Effects of extraction time on the contents of avenanthramides in oat grain are presented in Figure 3. Therefore, it can be considered that the optimal extration time will be between 80-280 min.
Figure 1. The content of avenanthramides in oat grain extracted with
various solvent. The vertical bars represent the standard deviation (n = 3). Extraction condition: temperature 25 °C, time 60 min.
Figure 2. Effect of methanol concentration in the recovery of
avenanthramides in oat grain. The vertical bars represent the standard deviation (n = 3). Extraction condition: temperature 25 °C, time 60 min.
Figure 3. Effect of extraction time in the recovery of avenanthramides
Temperature plays an important role in the extraction of bioactive compounds from plant materials. According to Figure 4, the most suitable temperature for extraction of avenathramides from oat grain was 60 °C. An obvious increase of the avenanthramides content was observed throughout the temperature range of 30-60 °C.
Fitting the response surface model
The more reliable way to evaluate the quality of the model fitted is by the application of analysis of variance (ANOVA). The central idea of ANOVA is to compare the
variation due to the treatment (change in the combination of variable levels) with the variation due to random errors inherent to the measurements of the generated responses. From this comparison, it is possible to evaluate the significance of the regression used to foresee responses considering the sources of experimental variance.32
Data were analyzed by multiple regressions through the least-square method. The mathematical analyses of the data were conducted using Statgraphics Centurion XVI. The test of statistical significance was based on the total error criteria with a confidence level of 95.0%. Tables 3-5 summarize the regression coefficients of the models and results of variance analysis (ANOVA).
The significant contribution of each coefficient was determined by p-value of F-test (p < 0.05). In general, it can be considered that higher Fisher’s F-test values and lower p-values indicate the relative significance of each term. The quality of the fit of the polynomial models equations were expressed by the coefficients of determination (R2).
The coefficients of determination were 0.959, 0.970 and 0.984 for the response of avenanthramides 2c, 2p and 2f, respectively. The adjusted coefficients of determination (adjusted R2), which is more suitable for comparing models
with different numbers of independent variables, were 0.869, 0.904 and 0.949 for the response of avenanthramides
Figure 4. Effect of extraction temperature in the recovery of
avenanthramides in oat grain. The vertical bars represent the standard deviation (n = 3). Extraction condition: methanol concentration 80%, time 120 min.
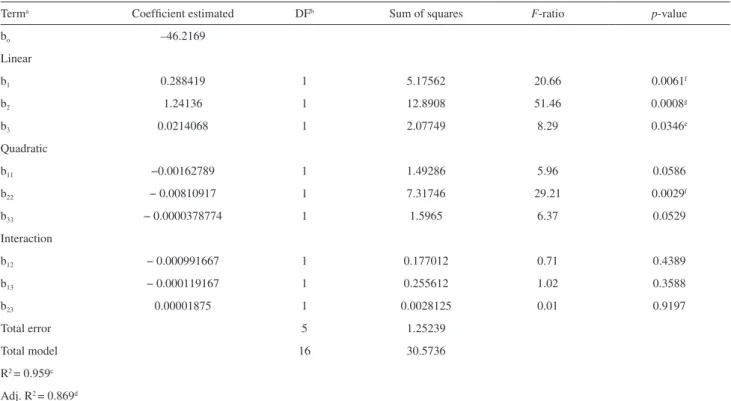
Table 3. Regression coefficients of the predictive second-order polynomial models and results of variance analysis (ANOVA) for effect of extraction
temperature, methanol concentration and temperature on amount of avenanthramide 2c
Terma Coefficient estimated DFb Sum of squares F-ratio p-value
bo –46.2169
Linear
b1 0.288419 1 5.17562 20.66 0.0061f
b2 1.24136 1 12.8908 51.46 0.0008g
b3 0.0214068 1 2.07749 8.29 0.0346e
Quadratic
b11 −0.00162789 1 1.49286 5.96 0.0586
b22 − 0.00810917 1 7.31746 29.21 0.0029f
b33 − 0.0000378774 1 1.5965 6.37 0.0529
Interaction
b12 − 0.000991667 1 0.177012 0.71 0.4389
b13 − 0.000119167 1 0.255612 1.02 0.3588
b23 0.00001875 1 0.0028125 0.01 0.9197
Total error 5 1.25239
Total model 16 30.5736
R2 = 0.959c
Adj. R2 = 0.869d
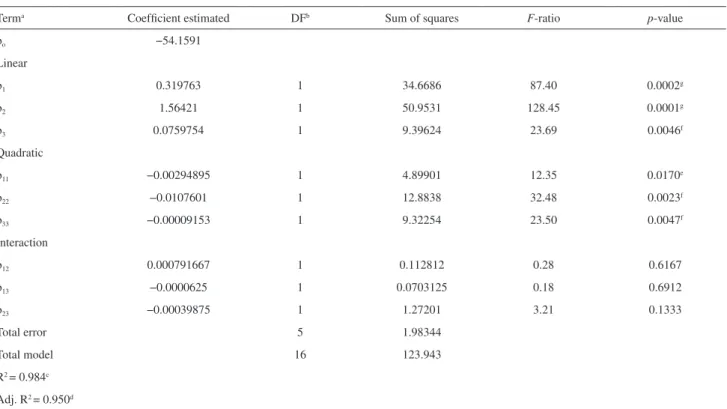
Table 5. Regression coefficients of the predictive second-order polynomial models and results of variance analysis (ANOVA) for effect of extraction temperature, methanol concentration and temperature on amount of avenanthramide 2f
Terma Coefficient estimated DFb Sum of squares F-ratio p-value
bo −54.1591
Linear
b1 0.319763 1 34.6686 87.40 0.0002g
b2 1.56421 1 50.9531 128.45 0.0001g
b3 0.0759754 1 9.39624 23.69 0.0046f
Quadratic
b11 −0.00294895 1 4.89901 12.35 0.0170e
b22 −0.0107601 1 12.8838 32.48 0.0023f
b33 −0.00009153 1 9.32254 23.50 0.0047f
Interaction
b12 0.000791667 1 0.112812 0.28 0.6167
b13 −0.0000625 1 0.0703125 0.18 0.6912
b23 −0.00039875 1 1.27201 3.21 0.1333
Total error 5 1.98344
Total model 16 123.943
R2 = 0.984c
Adj. R2 = 0.950d
aInferior indexes: 1 = extraction temperature, 2 = methanol concentration, 3 = time; bdegrees of freedom; ccoefficient of determination; dadjusted R2; ep < 0.05; fp < 0.01; gp < 0.001.
Table 4. Regression coefficients of the predictive second-order polynomial models and results of variance analysis (ANOVA) for effect of extraction
temperature, methanol concentration and temperature on amount of avenanthramide 2p
Terma Coefficient estimated DFb Sum of squares F-ratio p-value
bo −19.3134
Linear
b1 0.111657 1 9.77694 48.01 0.0010g
b2 0.609875 1 14.5584 71.49 0.0004g
b3 0.0417389 1 3.57333 17.55 0.0086f
Quadratic
b11 −0.000806277 1 0.366219 1.8 0.2376
b22 −0.00426055 1 2.01994 9.92 0.0254e
b33 −0.0000451055 1 2.26395 11.12 0.0207e
Interaction
b12 0.000266667 1 0.0128 0.06 0.8120
b13 −0.0000216667 1 0.00845 0.04 0.8466
b23 −0.0002425 0.47045 2.31 0.1890
Total error 5 1.01823
Total model 16 33.7794
R2 = 0.970c
Adj. R2 = 0.904d
2c, 2p and 2f, respectively. These results indicate that models have adequately represented the real relationship among the parameters chosen.
Analysis of the response surface models
From Table 5, equation 3 shows the relationship between yield of avenathramide 2c (Y1) and significant
extraction parameters.
Y1 = −46.2169 + 0.288419X1 + 1.24136X2 +
0.0214068X3 − 0.00810917X22 (3)
An advantageous way of demonstrating the effect of different variables on the response function was to generate surface response plots, which was carried out by varying two variables while the third is kept constant. Figure 5 is a 3D response surface plot showing the effect of methanol concentration and time (Figure 5a) and the effect of temperature and methanol concentration (Figure 5b) on extraction of avenanthramide 2c.
An increase in avenanthramide 2c content was noted with increased concentration of methanol and maximum yield was obtained with methanol 75-85%, and subsequently it decreased at higher methanol concentration of 85-100% (Figure 5a). In consequence, the methanol concentration had positive linear effect (p < 0.001) and negative quadratic effect (p < 0.01) on the amount of avenanthramide 2c. The
avenanthramide 2c content increased with the increase in temperature up to 50-75 °C (Figure 5b) and then slowly decreased. The avenanthramide 2c content slowly increased with time up to 150-300 min and then slowly decreased (Figure 5a). Thus, positive linear effects of temperature (p < 0.01) and time (p < 0.05) were observed. The second-order quadratic effects of time, temperature and all the interactions were not significant.
In the case avenathramide 2p, equation 4 shows the relationship between yield of avenathramide 2p (Y2) and
significant extraction parameters (Table 4).
Y2 = −19.3134 + 0.111657X1 + 0.609875X2 +
0.0417389X3 − 0.00426055X22 − 0.0000451055X32 (4)
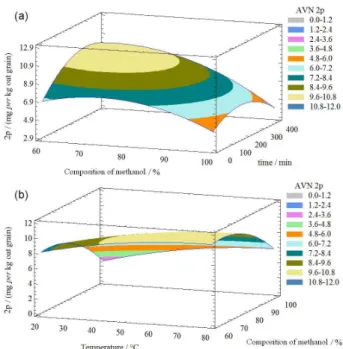
The effects of methanol concentration and time and the effect of temperature and methanol concentration on extraction of avenanthramide 2p are shown in Figure 6.
The maximum yield of avenanthramide 2p was obtained with methanol concentration of 60-90%, but it decreased at methanol concentration over 90% (Figure 6a). Hence, the methanol concentration had positive linear effect (p < 0.001) and negative quadratic effect (p < 0.05) on the yield of avenanthramide 2p. The maximum yield was also obtained at temperature 40-80 °C (Figure 6b). There was a positive linear effect (p < 0.001) observed. For a long extraction time, the negative quadratic effect was also significant (p < 0.01). The second-order quadratic
Figure 5. Response surface plot of the avenanthramide 2c amount as a
function of methanol concentration and extraction time at temperature of 59 oC in (a) and a function of temperature and methanol concentration at 208 min in (b).
Figure 6. Response surface plot of the avenanthramide 2p amount as a
effects of temperature and all the interactions were not significant.
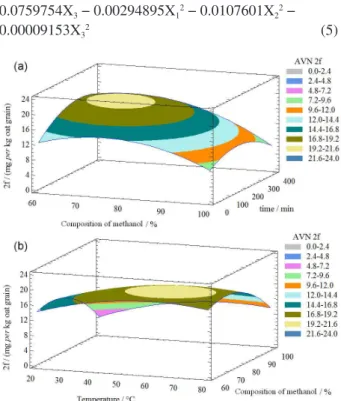
For extraction of avenathramide 2f equation 5 and Figure 7 show the relationship between yield of avenathramide 2f (Y2)
and significant extraction parameters (Table 5).
Y3 = −54.1591 + 0.319763X1 + 1.56421X2 +
0.0759754X3 − 0.00294895X12 − 0.0107601X22 −
0.00009153X32 (5)
The maximum yield of avenanthramide 2f was found at a methanol concentration of 70-85%, but it decreased at a concentration over 85% (Figure 7a). There were both positive linear effect (p < 0.001) and negative quadratic effect (p < 0.01) detected. Similarly, maximum yield was obtained at 55-75 °C (Figure 6b). For a long extraction time (p < 0.01) and higher temperature (p < 0.05), the negative quadratic effects were also significant. All interactions were not significant.
Our results show that extraction of avenanthramides 2c, 2p and 2f was strongly influenced by varying percentage of methanol, then by higher temperature. According to some authors, the extraction time has less effect than the extraction solvent and temperature.29,44 The extraction
of phenolic compounds, including avenanthramides, depends predominantly on the polarity of the solvents employed and the compounds to be extracted, hence a combination of alcohol with water is more effective than the pure alcohol.35
At higher temperature, the solubility of phenolic compounds in cereal grain could be enhanced and, the viscosity of cereal extracts decreased, accelerating the whole extraction process.33 Moreover, the dielectric
constant of water decreases at higher temperature, resulting in a better extraction of phenolic compounds.35
Optimization of extraction parameters
The numerical optimization of extraction parameters was carried out using Statgraphics Centurion XVI software. Our target was to obtain from the oat grain the highest yield of avenanthramides 2c, 2p and 2f, respectively. The maximal yield of avenanthramide 2c predicted by RSM was 9.904 mg kg-1 oat grain under the following extraction
condition: extraction temperature of 58.6 °C, methanol concentration of 73.2% and time 208 min. The following optimal extraction parameters of avenanthramide 2p were predicted: the extraction temperature of 70.1 °C, methanol concentration of 66.1% and time 268 min. The maximal yield of avenanthramide 2p was 10.728 mg kg-1 oat grain.
Optimal conditions for avenanthramide 2f determined by RSM were at extraction temperature of 61.1 °C, methanol concentration of 70.5% and time of 240 min with a maximal yield of avenanthramide 2f of 19.875 mg kg-1 oat grain.
It is relatively simple to find the optimal conditions for a single response using surface response designs. However, we were interested in optimizing several responses simultaneously. The extraction condition would be considered optimum if the yields of the avenanthramides all reached maximum values. The Derringer function or desirability function is the most important and most currently used multicriteria methodology in the optimization of analytical procedures. This methodology is initially based on constructing a desirability function for each individual response. In summary, the measured properties related to each response are transformed into a dimensionless individual desirability scale. The scale of the individual desirability function ranges between d = 0, for a completely undesirable response, and d = 1, for a fully desired response, above which further improvements would have no importance. With the individual desirabilities, it is then possible to obtain the overall desirability. The application of desirability functions in analytical chemistry brings advantages as efficiency, economy, and objectivity in the optimization of multiple response procedures.32
Multiple response optimization using desirability functions were used to optimize the extraction of crocin and geniposide from gardenia,34 to optimize the extraction of
phenolic and antioxidant capacity from apple35 and dark
fresh fig.39
Figure 7. Response surface plot of the avenanthramide 2f amount as a
In our case, the optimal conditions were determined by maximizing desirability using Statgraphics Centurion XVI prediction profiler. The most desirable results were obtained at 60 °C, time 280 min and a methanol concentration of 70% (Table 2, number 6). Figure 8 shows the surface plot of optimizing three responses at 60 °C.
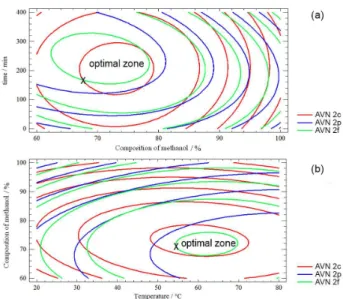
Another method is to use visual inspection. If the amount of significant factors allows the graphical visualization of adjusted models, the surfaces can be overlapped to enable finding the experimental region that can satisfy all the responses studied.32 This resulted in an
optimum zone, in which every point would represent a combination of extraction parameters that would give the optimum yield for three dependent variables. For practical (cost-saving) consideration, the point representing the lowest possible combination of the time and methanol concentration within the optimum zone would be preferred to other combinations.34,45 For this reason, the point at
165 min (Figure 9a) was chosen as the fixed value to generate the contour plot for temperature and methanol concentration (Figure 9b). This generated another optimum zone.
According to that, the point at 55 °C, 70% methanol and 165 min was indicated as the optimum condition for avenanthramides extraction. At this condition, yields of avenanthramides 2c, 2p and 2f were predicted by RSM models to be 9.70 mg kg-1, 9.90 mg kg-1 and
19.20 mg kg-1 oat grain, respectively. The suitability
of the model equations for predicting the optimum response values were verified using comparing the
Figure 8. Surface plot of optimization of three responses at temperature
of 60 °C.
Table 6. The comparison of predicted values of the dependent variables and experimentally measured values at optimal conditions
Dependent variable Predicted value / (mg kg-1 oat grain) Experimental valuea / (mg kg-1 oat grain)
Avenanthramide 2c (Y1) 9.62 9.59 ± 0.38
Avenanthramide 2p (Y2) 10.04 10.05 ± 0.44
Avenanthramide 2f (Y3) 19.19 19.18 ± 0.80
aMean ± standard deviation (n = 3)
Figure 9. Superimposed contour plot for yield of avenanthramides 2c,
2p and 2f from oat grain as a function of methanol concentration and extraction time at 60 °C in (a) and a function of methanol concentration and temperature at 165 min in (b).
predicted and the experimental values for the responses (Table 6).
Predicted values for extraction of avenanthramides were comparable with experimentally measured values at the level of the statistical significance (p < 0.05). Achieved results confirm the possibility to predict the course of the extraction of avenanthramides from oat grain by the model under particular experimental conditions.
Conclusions
Acknowledgements
The authors thank Mark J. Timmis, BPharm (hons), editor from United Kingdom for English correction. This paper was supported by grant No. APVV-0758-11 and APVV-0398-12.
References
1. Singh, R.; De, S.; Belkheir, A.; Crit. Rev. Food Sci. Nutr.2013,
53, 126.
2. Ishihara, A.; Ohtsu, Y.; Iwamura, H.; Phytochemistry1999, 50, 237.
3. Meydani, M.; Nutr. Rev. 2009, 67, 731.
4. Wise, M. L.; Doehlert, D. C.; McMullen, M. S.; Cereal Chem.
2008, 85, 639.
5. Collins, F. W.; J. Agric. Food Chem.1989, 37, 60.
6. Bratt, K.; Sunnerheim, K.; Bryngelsson, S.; Fagerlund, A.; Engman, L.; Andersson, R. E.; Dimberg, L. H.; J. Agric. Food Chem.2003, 51, 594.
7. Dimberg, L. H.; Theander, O.; Lingnert, H.; Cereal Chem. 1993, 70, 637.
8. Peterson, D. M.; Hahn, M. J.; Emmons, C. L.; Food Chem.
2002, 79, 473.
9. Fagerlund, A.; Sunnerheim, K.; Dimberg, L. H.; Food Chem.
2009, 113, 550.
10. Yang, J.; Ou, B.; Wise, M.; Chu, Y.; Food Chem.2014, 160, 338.
11. Ji, L. L.; Lay, D.; Chung, E.; Fu, Y.; Peterson, D. M.; Nutr. Res.
2003, 23, 1579.
12. Chen, C. O.; Milbury, P. E.; Collins, F. W.; Blumberg, J. B.; J. Nutr.2007, 137, 1375.
13. Liu, S.; Yang, N.; Hou, Z.; Yao, Y.; Lu, L.; Zhou, X.; Ren, G.; Agr. Sci. China2011, 10, 1301.
14. Nie, L.; Wise, M.; Peterson, D.; Meydani, M.; Atherosclerosis
2006, 186, 260.
15. Nie, L.; Wise, M.; Peterson, D.; Meydani, M.; Free Radical Bio. Med.2006, 41, 702.
16. Guo, W.; Nie, L.; Wu, D.; Wise, M. L.; Collins, F. W.; Meydani, S. N.; Meydani, M.; Nutr. Cancer 2010, 62, 1007.
17. Liu, L.; Zubik, L.; Collins, F. W.; Marko, M.; Meydani, M.; Atherosclerosis2004, 175, 39.
18. Guo, W.; Wise, M. L.; Collins, F. W.; Meydani, M.; Free Radical Bio. Med.2008, 44, 415.
19. Sur, R.; Nigam, A.; Grote, D.; Liebel, F.; Southall, M. D.; Arch. Dermatol. Res.2008, 300, 569.
20. Koenig, R.; Dickman, J. R.; Kang, C.; Zang, T.; Chu, Y.; Ji, L. L.; Nutrition J.2014, 13, 21.
21. Emmons, C. L.; Peterson, D. M.; Cereal Chem. 1999, 76, 902.
22. Peterson, D. M.; Dimberg, L. H.; J. Cereal Sci.2008, 47, 101. 23. Dimberg, L. H.; Molteberg, E. L.; Solheim, R.; Frolich, W.;
J. Cereal Sci.1996, 24, 263.
24. Tong, L.; Liu, L.; Zhong, K.; Wang, Y.; Guo, L.; Zhou, S.; J. Integr. Agr.2014, 13, 1809.
25. Emmons, C. L.; Peterson, D. M.; Crop Sci.2001, 41, 1676. 26. Peterson, D. M.; Emmons, C. L.; Hibbs, A. H.; J. Cereal Sci.
2001, 33, 97.
27. Dokuyucu, T.; Peterson, D. M.; Akkaya, A.; Cereal Chem.2003, 80, 542.
28. Verardo, V.; Serea, C.; Segal, R.; Caboni, M. F.; J. Cereal Sci.
2011, 54, 211.
29. Liyana-Patiharana, C.; Shahidi, F.; Food Chem.2005, 93, 47. 30. Box, G. E. P.; Wilson, K. B.; J. Roy. Statist. Soc. Ser.B1951,
13, 1.
31. Myers, R. H.; Montgomery, D. C.; Response Surface Methodology: Process and Product Optimization Using
Designed Experiments; Wiley, New York: 1995.
32. Bezerra, M. A.; Santelli, R. E.; Oliveira, E. P.; Villar, L. S.; Escaleira, L. A.; Talanta2008, 76, 965.
33. Wang, J.; Sun, B.; Cao, Y.; Tian, Y.; Li, X.; Food Chem.2008, 106, 804.
34. Yang, B.; Liu, X.; Gao, Y.; Innov. Food Sci. Emerg.2009, 10, 610.
35. Prasad, K. N.; Hassan, F. A.; Yang, B.; Kong, K.W.; Ramanan, R. N.; Azlan, A.; Ismail, A.; Food Chem.2011, 128, 1121. 36. Onrejovič, M.; Kraic, F.; Benkovičová, H.; Šilhár, S.; Czech J.
Food Sci.2012, 30, 385.
37. Ilayaraja, N.; Likhith, K. R.; Babu, G. R. S.; Khanum, F.; Food Chem.2015, 173, 348.
38. Alberti, A.; Zielinski, A. A. F.; Zardo, D. M.; Demiate, I. M.; Nogueira, A.; Mafra, L. I.; Food Chem.2014, 149, 151. 39. Bachirbey, M.; Meziant, L.; Benchikh, Y.; Louaileche, H.; Food
Chem.2014, 162, 277.
40. Chu, Y.; Wise, M. L.; Gulvady, A. A.; Chang, T.; Kendra, D. F.; Klinken, B. J.; Shi, Y.; O’Shea, M.; Food Chem.2013, 139, 426. 41. Irakli, M. N.; Samanidou, V. F.; Biliaderis, C. G.; Papadoyannis,
I. N.; Food Chem.2012, 134, 1624.
42. Bryngelsson, S.; Dimberg, L. H.; Kamal-Eldin, A.; J. Agric. Food Chem.2002, 50, 1890.
43. Xu, J. G.; Tian, C. R.; Hu, Q. P.; Luo, J. Y.; Wang, X. D.; Tian, X. D.; J. Agric. Food Chem.2009, 57, 10392.
44. Michiels, J. A.; Kevers, C.; Pincemail, J.; Defraigne, J. O.; Dommes, J.; Food Chem.2012, 130, 986.
45. Xu, X.; Gao, Y.; Liu, G.; Wang, Q.; Zhao, J.; Food Sci. Technol.
2008, 41, 1223.
Submitted: June 3, 2015