*Correspondence: F. Demirkaya-Miloglu. Analytical Chemistry Department, Faculty of Pharmacy, Ataturk University, 25240, Erzurum, Turkey. E-mail: [email protected]
A
vol. 50, n. 3, jul./sep., 2014 http://dx.doi.org/10.1590/S1984-82502014000300021
Optimization of a spectrofluorimetric method based on a central
composite design for the determination of potassium losartan in
pharmaceutical products
Fatma Demirkaya-Miloglu
1,*, Mehmet Emrah Yaman
1, Yucel Kadioglu
11Analytical Chemistry Department, Faculty of Pharmacy, Ataturk University
Here, a spectroluorimetric method for the determination of potassium losartan (PL) in pharmaceutical products is described. The effects of critical parameters, pH, acid molarity, and temperature, on the luorescence intensity of PL were analyzed, and these parameters were optimized using a central composite design (CCD). The highest luorescent intensity at excitation (λex) and emission (λem) wavelengths of 248 nm and 410 nm, respectively, was achieved using 0.01 M sulfurous acid (pH 2) at 21.6 °C. Under optimum conditions, the method was linear from 0.025–0.5 µg/mL, with a reasonably high correlation coeficient (0.9993). Furthermore, the method was very sensitive (LOQ, 0.006), accurate (RE, ≤7.06), and precise (%RSD, ≤6.51). After development and validation of the method, samples containing PL were analyzed with this method, and the obtained data were statistically compared with those obtained with a previously published reference method using a two one-sided equivalence test (TOST). According to the data, the results from the proposed and reference assays were equivalent.
Uniterms: Potassium losartan/central composite design. Spectroluorimetry/quantitative analysis. Pharmaceutical formulations/quantitative analyis.
Descreve-se método espectroluorométrico para a determinação de losartana potássica (PL) em produtos farmacêuticos. Os efeitos de parâmetros críticos (pH, molaridade ácida e temperatura) na intensidade da luorecência foram otimizados usando o planejamento de componente central (DCC). A mais alta intensidade luorescente com λex=248 nm e λem= 410 nm foi obtida usando ácido sulfúrico 0.01 M (pH 2) e 21.6 ºC. Nas condições ideais, a linearidade do método foi estabelecida na faixa de concentração de 0.025-0.5 µg/mL com coeiciente de correlação bastante elevado (0.9993). Além disso, o método foi muito sensível com valor de LOQ 0.006, exato (RE≤7.06) e preciso (RSD%≤6.51). Depois do desenvolvimento e validação do método, amostras de medicamentos contendo PL foram analisadas com este método e os resultados obtidos foram comparados estatisticamente com método de referência, publicado anteriormente, usando o Teste de equivalência TOST (Teste de Equivalência Unilateral). De acordo com os dados estatísticos, os resultados do ensaio de referência e do método proposto foram equivalentes.
Uniterms: Losartana potássica/planejamento de componente central. Espectroluorimetria/análise quantitativa. Formulações farmacêuticas/análise quantitativa.
INTRODUCTION
Several antagonists of angiotensin II receptors, which block these receptors, are used to control blood pressure (Burnier, Brunner, 1998). Angiotensin II receptor antagonists are antihypertensive drugs that block the action of angiotensin II by preventing it from binding to receptors
on blood vessels, and these drugs have no signiicant side effects (Weber, 1997). Intake of these drugs, together with lifestyle and dietary changes, by hypertensive patients can reduce cardiovascular mortality. Losartan potassium (2-butyl-4-chloro-1-[p-(o-1H-tetrazol-5-yl phenyl)benzyl
A literature review showed that several analytical methods, including high-performance liquid chromatography (HPLC) coupled with UV (Carlucci
et al., 2000; Erk, 2001; Ozkan, 2001; Hertzog et al., 2002; Ansari et al., 2004; Bonfilio et al., 2009) or
fluorescence (Ritter, Furtek, Lo,1997)detection, UV and derivative spectrophotometry methods (Prabhakar, Giridhar, 2002; Lastra et al., 2003; Sankar et al., 2003;
Rahman, Siddiqui, Azmi, 2006; Latheeshjlal et al., 2010; El-Shiekh et al., 2011; Rao et al., 2011; Subbarao et al., 2012), and reversed-phase high-performance thin-layer chromatography (HPTLC) (McCarthy et al., 1998), have
been published for the analysis of PL in pharmaceuticals. Only two spectroluorimetric methods have been reported for analyzing PL by its native luorescence in an acidic medium (Cagigal et al., 2001; El-Shaboury et al., 2012). In one method, reported by El-Shaboury et al.
(2012), the levels of PL and other sartans were analyzed in pharmaceuticals using Teorell and Stenhagen buffer at pH 2.3. In the other method, which was reported by Cagigal et al. (2001), PL and valsartan in human urine were analyzed
using phosphate buffer at pH 2.
In these studies, it was reported that some external parameters, such as the solvent, solvent ratio, acid molarity, pH, and temperature, have a strong effect on the luorescence intensity of PL. In the only study of PL in pharmaceuticals (El-Shaboury et al., 2012), single factor
optimization, which does not allow interactions between factors, was utilized. This method is not practical because it requires numerous experiments to determine the optimum of each factor. The central composite design (CCD) was used in the proposed study allowed for determination of the optimum levels of various factors on the luorescence intensity of PL and the observed interactions between the factors.
The aim of this study was to develop, optimize, and validate a specific, sensitive, accurate, precise, and reproducible quantitative method to determine PL in pharmaceutical formulations. A CCD was used to examine the effect of acid molarity, pH, and temperature on the luorescence intensity of PL, and to optimize these parameters.
EXPERIMENTAL
Reagents and material
PL and sulfurous acid were purchased from Sigma-Aldrich (Germany). Methanol was purchased from Merck (Germany). Ultrapure water was obtained from a Milli-Q water purification system (EASYpure RF,
Barnstead, USA). All other chemicals and solvents were of analytical grade and were from commercial sources. PL tablets (Cozaar, Eklips, Loxibin, Sarilen, and Sarvas) were purchased from the Turkish drug market. Each tablet contained 50 mg of PL as the active ingredient.
Stock solutions of 2 mg/mL PL were prepared in methanol and were stored at 4 °C. Several sulfurous
acid solutions were prepared in deionized water at the desired concentrations and pH values established by the experimental design. Calibration working solutions (0.025, 0.05, 0.1, 0.2, 0.3, 0.4, and 0.5 µg/mL) and quality control (QC) samples (0.05, 0.2, and 0.4 µg/mL) were prepared daily by diluting the stock solution with a sulfurous acid solution (0.01 M, pH 2).
Instrumentation
All fluorescence measurements were made with an LS 45 spectroluorophotometer (Perkin Elmer, USA) equipped with a xenon lamp and a Monk-Gillieson type monochromator (wavelength range, 200-800 nm) controlled by a Vestel computer system (TURKEY). The instrument excitation and emission slits were adjusted to 10 nm. The luorescence of PL was measured at 410 nm, with the excitation wavelength set at 248 nm.
Preparation of sample solutions
T h e s a m p l e s e t c o n s i s t e d o f f i v e d i ff e r e n t pharmaceutical preparations that contained 50 mg of PL. Ten tablets of each formulation were weighed and inely powdered. One tablet, which contained approximately 50 mg of PL, was placed into a flask with 40 mL of methanol. It was sonicated for 15 minutes, cooled to room temperature, and the volume was adjusted to50 mL. The concentrations desired for measurements were obtained by diluting this stock solution with 0.01 M sulfurous acid solution (pH 2).
Experimental design
may introduce bias into the measurements. Six replicates of the intermediate values were performed to estimate the experimental error.
Software
The experimental design was determined and statistical analyses were performed using Excel 2010 (Microsoft, Redmond, WA, USA), SPSS 11.5 (SPSS, Chicago, USA), and Design-Expert 8.0 (Stat-Ease Inc., Minneapolis, MN, USA).
RESULTS AND DISCUSSION
Optimization of spectrofluorimetric conditions
Initial experiments on fluorescent intensity
To determine the highest fluorescence intensity of PL in its various ionization states, several solvents, water, methanol, ethanol, chloroform, ether, acetone, acetonitrile, and hexane, were tested with different acid solutions under controlled pH values between pH 1.5 and 3.0 (HNO3, H2SO4, HCl, and H2SO3). PL is very soluble
TABLE I - Solvent effects on the luorescence intensity of losartan potassium (PL)
Solvent Acid or buffer λex λem Fluorescence intensity (IF)
Blank solvent solution PL (0.5 µg/mL)
Water 0.01 M HCl 247.81 387.56 35 428
Methanol 0.01 M HCl 251.08 374.82 43 448
Ethanol 0.01 M HCl 247.75 377.65 65 385
Acetonitrile 0.01 M HCl 279.15 369.12 44 381
Methanol 0.01 M HNO3 252.35 381.70 42 400
0.01 M H2SO4 249.53 383.45 47 372
0.01 M H2SO3 284.12 410.09 16 484
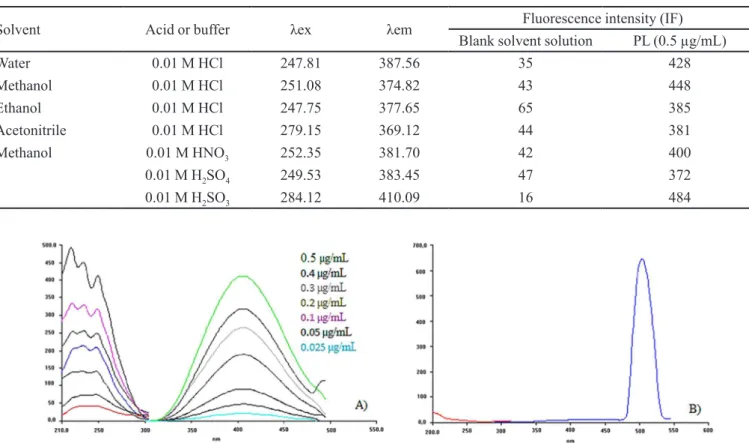
FIGURE 1- Fluorescence spectra (A) of standard PL solutions (0.025–0.5 µg/mL) and (B) a reagent blank (methanol-sulfurous
acid solution at pH 2.0).
in water, methanol, and ethanol, and it is partially soluble in organic solvents such as acetonitrile, chloroform, ether, hexane, and acetone. As shown in Table I, the highest PL luorescence intensity was observed in methanol that was diluted with a sulfurous acid solution.
These spectra were obtained by measuring the fluorescence at excitation and emission wavelengths ranging from 210 to 310 nm and from 300 to 500 nm, respectively. PL showed a maximum peak at 410 nm following excitation at 248 nm (Figure 1A). The sulfurous acid solution had no emission peak that interfered with that of PL at the studied wavelengths (Figure 1B). This absence of interference from the solvent mixture is one of the advantages of this method.
Central composite design (CCD)
It is well known that the relative fluorescence intensity of a chemical compound is greatly affected by chemical variables (solvents, acids, bases, pH, and temperature).It was previously reported that PL shows native luorescence only in acidic medium (El-Shaboury
et al., 2012), because the pKa of PL at 3.15 is acidic. PL
and if the medium becomes alkaline, its fluorescence intensity decreases. Three studies of the pH optima of PL fluorescence found that optimum fluorescence was obtained at pH 2–2.5 (El-Shaboury et al., 2012),
pH 2 (Cagigal et al., 2001), and pH 2.5 (Ritter, Furtek,
Lo,1997). We based our experimental design on this information, and determined the optimum pH under our conditions by varying the pH (A) from 1.5 to 3.
The intensity of luorescence may also be affected by acid concentration. Cagigal et al. (2001) (phosphate
buffer concentration: 0.05–0.25 M) and El-Shaboury et al. (2012) (citric acid concentration: 0.1–1 M) conducted
some experiments at higher acid concentrations, whereas we aimed to use relatively low concentrations (0.006-0.02 M) of acid to determine if acid concentration (B) affects the intensity of PL luorescence.
Another parameter that may affect PL luorescence intensity is temperature. It was previously shown that the fluorescence intensity of PL decreased at higher temperatures in both theoretical (due to a loss of energy by non-radiant emission processes) and experimental (Cagigal et al., 2001 and El-Shaboury et al., 2012; in experiments conducted at 20 °C ± 5 °C and room temperature, respectively) studies. Therefore, we conducted our experiments at temperatures ranging from 20 °C to 30 °C.
The experimental conditions for CCD and fluorescence intensity are presented in Table II. The
objective of these experiments was to determine the conditions under which the highest PL fluorescence intensity could be obtained in the shortest possible run time.
The general function for a CCD with three factors (1):
IF = β0 + β1X1 + β2X2 + β3X3 + β12X1X2 + β13X1X3 + β23X2X3 + β11X21 + β11X12 + β22X22 + β33X32 +
β123X1X2X3 (1)
where IF is the fluorescent intensity, β is the regression coeficient, and X1, X2, and X3 are factors A, B, and C, respectively. The data collected in Table II were analyzed with the Design-Expert 8.0 program following the methodology described above. The model was described by the following equation (2):
IF = +487.70 – 14.44A – 12.29B – 29.06C + 1388AB + 15.13AC + 10.63BC – 42.0A2 – 47.85B2 – 27.52C2 (2)
According to the statistical parameters obtained from the ANOVA of the reduced model, the adjusted R2 was 0.8007, which was within the acceptable limits of R2 ≥ 0.80 (Montgomery, 1991). The experimental results were itted to a second-order model relating luorescent intensity to the three factors. The P value for the reduced model was 0.045, and this model was signiicant (P< 0.05).
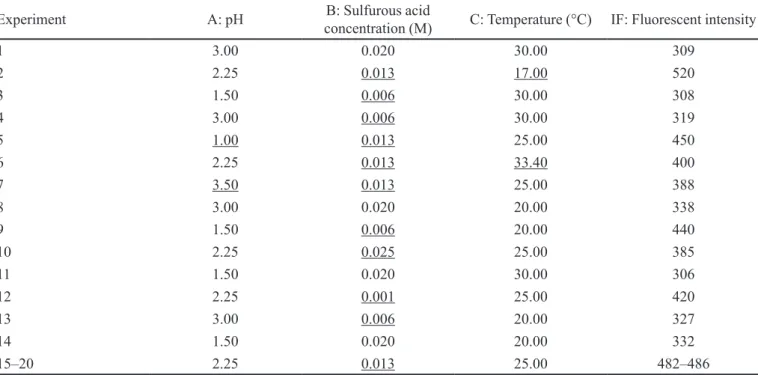
TABLE II - Optimization of parameters for the central composite design and luorescent intensity
Experiment A: pH concentration (M)B: Sulfurous acid C: Temperature (°C) IF: Fluorescent intensity
1 3.00 0.020 30.00 309
2 2.25 0.013 17.00 520
3 1.50 0.006 30.00 308
4 3.00 0.006 30.00 319
5 1.00 0.013 25.00 450
6 2.25 0.013 33.40 400
7 3.50 0.013 25.00 388
8 3.00 0.020 20.00 338
9 1.50 0.006 20.00 440
10 2.25 0.025 25.00 385
11 1.50 0.020 30.00 306
12 2.25 0.001 25.00 420
13 3.00 0.006 20.00 327
14 1.50 0.020 20.00 332
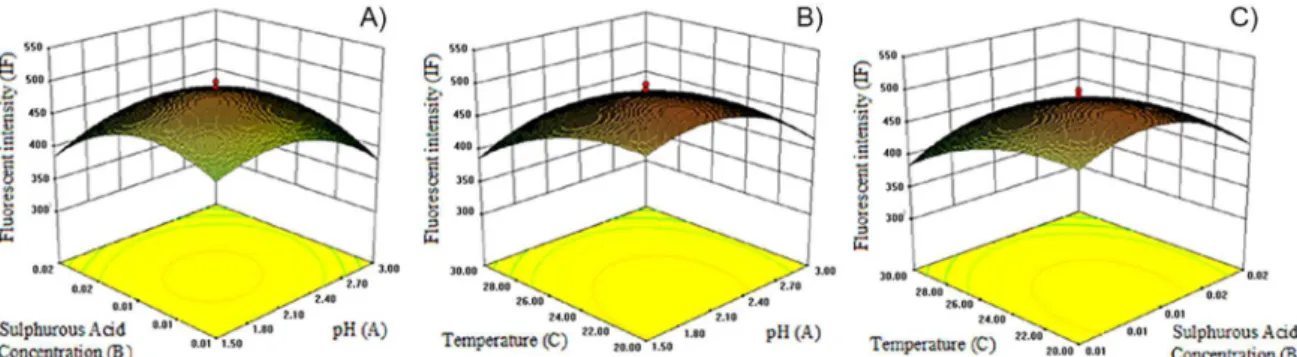
FIGURE 2 - Three-dimensional response surface plot for PL luorescence intensity (IF). A) Variation of the response IF as a
function of A and B, with temperature (C) as a ixed factor (21.6 °C), B) Variation of the response IF as a function of A and C, with sulfurous acid concentration (B) as a ixed factor (0.01 M), C) Variation of the response IF as a function of B and C, with pH (A) as a ixed factor (pH = 2).
The signal (response) to noise (deviation) ratio was 4.32, and a ratio >4 is desirable (Montgomery, 1991).
To understand the impact of each variable, three-dimensional (3D) graphs were generated for the estimated responses, which were the bases of the polynomial model for the analysis of the interactive effect of the two factors on the fluorescence intensity within the experimental ranges shown in Figure 2. The interactions are discussed below.
Interactive effect of pH and acid concentration
It seems that fluorescence intensity increased with increasing pH until pH 2.00. In addition, the acid concentration slightly affected the luorescence intensity, and the optimum acid concentration in our model was 0.01 M. When the optimum pH and acid molarity were provided for the model, the luorescence intensity reached its highest value. This interactive connection is shown in Figure 2A.
Interactive effect of temperature and pH
There was a strong interactive connection between temperature and pH. Fluorescence intensity increased as the temperature decreased. The effect of pH was also investigated, and pH 2.00 was found to be the optimum pH for the model. When these optimum pH and temperature conditions were provided, the fluorescence intensity reached its highest value, and this strong connection is shown in Figure 2B.
Interactive effect of temperature and acid concentration
An interactive connection was observed between temperature and acid molarity, and this connection is shown in Figure 2C as a 3D graph. This graph claims that luorescence intensity increased as temperature decreased and at moderate acid molarity (0.01 M). According to the
graph, the luorescence intensity reached the highest value, at 0.01 M acid and 21.6 °C.
When all the data described above were integrated, the optimum values of pH (A), acid molarity (B), and temperature (C) for the proposed model were 2.00, 0.01 M, and 21.6 °C, respectively. When these conditions were applied, the theoretical luorescence intensity was 501.3. The model was compared with the real samples, and the luorescence intensity was determined to be 484.6 ± 1.63 which is very close (96.7 ± 0.32%) to the theoretical value.
Validation Studies
Linearity/Working range
Linearity was analyzed by using PL calibration curves ranging from 0.025 to 0.5 μg/mL generated by diluting the PL stock solution (2 mg/mL) with 0.01 M sulfurous acid solution (pH 2). Linearity was evaluated by linear regression analysis, which was calculated by least-squares regression analysis. The luorescence intensity was measured, and the mean linear regression equation was calculated based on six calibration curves as follows (3):
IF: 893.77 C + 16.77 (3)
where C is the concentration (µg/mL) of PL, and IF is the luorescence intensity of PL. The standard error of the intercept (1.397) and slope (0.560) and the correlation coeficients of the linear regression equations were also calculated. The high correlation coeficient (r = 0.9993) indicates that the method is linear.
Accuracy and precision
analytic run. The precision and accuracy of the assays were determined by the percent relative standard deviation (%RSD=100×standard deviation/mean) and relative error (RE= (calculated concentration-known concentration)×100/known concentration), respectively. The values of %RSD and RE for the intra-day and inter-day variation are shown in Table III.
The % RSD values of the intra-day and inter-day precision for the proposed method were determined as the mean values of six determinations, and they ranged from 2.23 to 4.95 and 1.98 to 6.51, respectively. The RE values for the intra-day and inter-day accuracy studies of these methods were between 6.44 and 6.52 and 0.21 and 7.06, respectively. These data supported the precision and accuracy of the method.
Sensitivity
The limit of detection (LOD) was determined by diluting the standard solution until the signal to noise (S/N) ratio was approximately 3. The limit of quantification
(LOQ) was deined as the analyte concentration at the lowest measurable luorescence intensity with acceptable precision (%RSD ≤ 10%).The LOD and LOQ for PL by using the proposed method were 0.002 µg/mL and 0.006µg/mL, respectively.The calculated LOD was well below that required for PL analysis in pharmaceutical preparations.
Recovery
Recovery was determined by adding the PL QC samples (0.05, 0.2, and 0.4 μg/mL) to solutions (0.1μg/mL) prepared from Cozaar® (50 mg), Eklips® (50 mg), Loxibin® (50 mg), Sarilen® (50 mg), and Sarvas® (50 mg) pharmaceutical preparations containing PL via the standard-addition technique, and then PL was quantiied by the proposed method. The experiment was repeated six times at each QC concentration. The results are shown in Table IV, and the mean PL recovery values for Cozaar, Eklips, Loxibin, Sarilen, and Sarvas were 97.84%, 99.78%, 99.30%, 97.01%, and 98.23%, respectively, with good accuracy.
TABLE III - Intra-day and inter-day precision and accuracy of the PL concentrations measured by using the proposed method
Addedb (µg/mL) Intra-day Inter-day
Detected ± SD (µg/mL) RE %RSD Detected ± SD (µg/mL) RE %RSD
0.05 0.053 ± 0.002 6.52 4.95 0.050 ± 0.003 0.21 6.51
0.2 0.212 ± 0.004 6.49 2.23 0.214 ± 0.005 7.06 2.73
0.4 0.425 ± 0.010 6.44 2.57 0.422 ± 0.008 5.54 1.98
SD: standard deviation (n = 6), %RSD: relative standard deviation (n = 6), RE: relative error
TABLE IV - PL recovery from spiked pharmaceutical preparations
Drug Added (µg/mL) Detected ± SD (µg/mL) %Recovery %RSD
Cozaar 0.1 µg/mL
0.05 0.051 ± 0.001 101.96 1.42
0.20 0.191 ± 0.002 95.47 0.82
0.40 0.384 ± 0.006 96.10 1.64
Eklips
0.1 µg/mL
0.05 0.052 ± 0.002 103.32 3.67
0.20 0.199 ± 0.001 99.94 0.68
0.40 0.384 ± 0.005 96.08 1.29
Loxibin
0.1 µg/mL
0.05 0.052 ± 0.002 104.55 3.28
0.20 0.193 ± 0.001 96.50 0.31
0.40 0.387 ± 0.006 96.86 1.63
Sarilen
0.1 µg/mL
0.05 0.049 ± 0.001 99.32 1.86
0.20 0.193 ± 0.004 96.25 2.29
0.40 0.382 ± 0.006 95.47 1.70
Sarvas
0.1µg/mL
0.05 0.051 ±0.003 101.74 5.62
0.20 0.194 ±0.002 96.99 1.24
0.40 0.384 ± 0.003 95.96 0.65
Stability
To determine the stability of PL, QC samples (0.025, 0.2, and 0.4 μg/mL) were analyzed initially and at different time intervals (6 hours for room temperature [25 °C] and 24, 48, and 60 hours for 4 °C and -20 °C). Stability was determined according to the acceptance criteria that the variation in recovery (%) should not be more than ±15 according to the FDA guidelines (2013). According to the acceptance criteria, PL was stable for at least 6 hours at room temperature and for at least 60 hours at 4 °C and -20 °C.
Application and comparison of the proposed method to a reference method
The developed method was applied to the analysis of commercially available formulations (Cozaar®, Eklips®, Loxibin®, Sarilen®, and Sarvas® tablets). The luorescence spectra of the pharmaceutical solutions are shown in Figure 3A–E.
To evaluate the amount of PL present in commercial pharmaceutical tablets, samples were analyzed twenty times after preparing the drug as described above in
Sample Preparation of the Experimental section. The
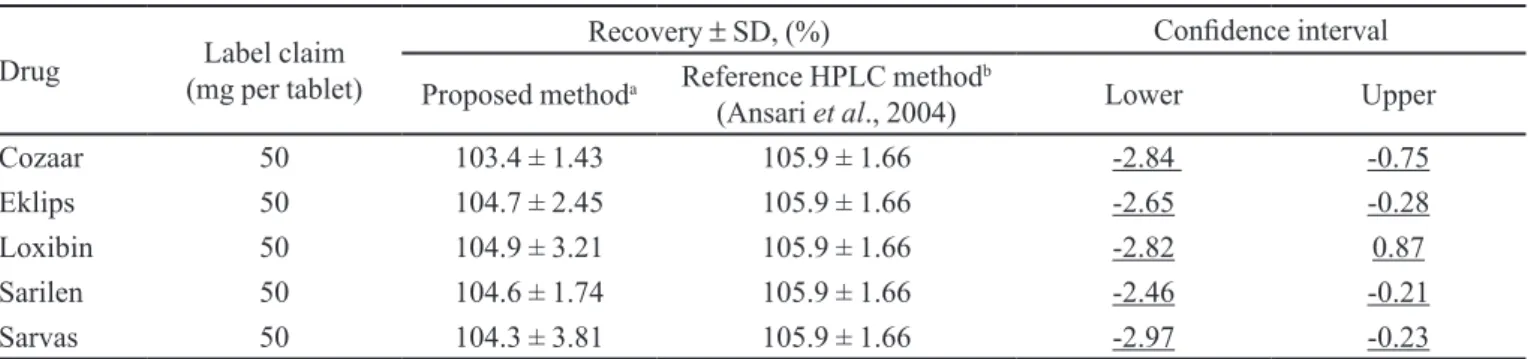
PL content of pharmaceutical tablets was calculated based on a standard calibration curve, and the obtained results, expressed as a percentage of the amount of drug listed on the label, are shown in Table V. These results were compared with previous results obtained with the reference HPLC method (Ansari et al., 2004) by a two
one-sided equivalence test (TOST). The upper and lower acceptable limits for the difference in the amount of the
active ingredient at each dosage have been predetermined as -3.0% to 3.0% (Lung et al., 2003). The critical t value
for 28 degrees of freedom with a set for the TOST at 0.05 was 1.701. The calculated confidence intervals for Cozaar® (-2.84 to -0.75), Eklips® (-2.65 to -0.28), Loxibin® (-2.82 to 0.87), Sarilen® (-2.46 to -0.21), and Sarvas® (-2.97 to -0.23) tablets were within the upper and lower limits (-3.0 to 3.0). Therefore, we concluded that the results obtained with the proposedspectroluorimetric method and the HPLC reference assay were equivalent.
In addition, the performance of the proposed spectrofluorimetric method was compared to that of the HPLC and spectrophotometric methods. The HPLC method is sensitive and accurate; however, it requires time-consuming pretreatments (mobile phase preparation and column equilibration) before analysis. This technique is also expensive due to the cost of the column, mobile phase, and instrumentation. The previous spectrophotometric method is also rapid, but the accuracy and sensitivity are poorer than those of the HPLC method. The spectroluorimetric method can be only applied to luorescent compounds. Therefore, such methods are not as common as HPLC methods. However, the proposed spectrofluorimetric method is simpler than the HPLC method, it does not require instrument pretreatment, and it has excellent sensitivity for determining fluorescent compounds.
Based on our statistical data, we claim that our spectrofluorimetric method is more sensitive than the HPLC method because it has a lower LOQ (0.006 µg/mL). The LOQ for the published HPLC method ranged from 0.15 to 4.20 µg/mL (Carlucci et al., 2000; Erk, 2001;
FIGURE 3 - Fluorescence spectra of drug solutions (0.1 and 0.3 µg/mL) containing (A) Cozaar, (B) Eklips, (C) Loxibin, (D)
Hertzog et al., 2002; Ansari et al., 2004; Bonilio et al., 2009), whereas the LOQ for published spectrophotometric methods ranged from 0.19 to 2.97 µg/mL (Prabhakar, Giridhar, 2002; Lastra et al., 2003; Sankar et al., 2003;
Rahman, Siddiqui, Azmi, 2006; Latheeshjlal et al., 2010; El-Shiekh et al., 2011; Rao et al., 2011; Subbarao et al.,
2012), and the LOQ of a published spectroluorimetric method for the analysis of PL in pharmaceuticals was 0.5 µg/mL (Cagigal et al., 2001).
CONCLUSION
Here, a spectroluorimetric method was developed to determine PL in pharmaceuticals. Three factors that play important roles in the luorescence intensity of PL (pH, acid molarity, and temperature) were simultaneously optimized by using a response surface methodology based on the central composite design, which can save time and effort by estimating the optimum conditions. The validation study supported selection of the assay conditions by confirming that the assay was specific, sensitive, accurate, and precise. Additionally, this method does not involve many procedural steps, and it can be easily and directly applied to pharmaceuticals due to its rapidity and simplicity.
REFERENCES
ANSARI, M.; KAZEMIPOUR, M.; KHOSRAVI, F.; BARADARAN, M. A comparative study of first-derivative spectrophotometry and high-performance liquid chromatography applied to the determination of losartan potassium in tablets. Chem. Pharm. Bull., v.52, p.1166-1170, 2004.
BONFILIO, R.; TARLEY, C.R.T.; PEREIRA, G.R.; SALGADO, H.R.N.; DE ARAÚJO, M.B. Multivariate optimization and validation of an analytical methodology by RP-HPLC for the determination of losartan potassium in capsules. Talanta, v.80, p.236-241, 2009.
BURNIER, M.; BRUNNER H.R. Angiotensin II receptor antagonists in hypertension. Kidney Int., v.54, p.107-111, 1998.
BURNIER, M. Angiotensin II type 1 receptor blockers. Circulation, v.103, p.904-912, 2001.
CAGIGAL, E.; GONZALEZ, L.; ALONSO, R.; JIMENEZ, R. Experimental design methodologies to optimise the spectroluorimetric determination of Losartan and Valsartan in human urine. Talanta, v.54, p.1121-1133, 2001.
CARLUCCI, G.; PALUMBO, G.; MAZZEO, P.; GIOVANNA-QUAGLIA, M. Simultaneous determination of losartan and hydrochlorothiazide in tablets by high-performance liquid chromatography. J. Pharm. Biomed. Anal., v.23, p.185-189, 2000.
EL-SHABOURY, S.R.; HUSSEIN, S.A.; MOHAMED, N.A.; EL-SUTOHY, M.M. Spectrofluorimetric method for determination of some angiotensin II receptor antagonists. J. Pharm. Anal., v.2, p.12-18, 2012.
EL-SHIEKH, R.; AKL, M.; GOUDA, A.; ALI, W. Extractive spectrophotometric determination of some drugs through Ion-pair complex formation with thiocyanate and cobalt (II) or molybdenum (V). J. Am. Sci., v.7, p.794-807, 2011.
TABLE V - Comparison of PL determination in commercial tablets using the proposed method and a reference HPLC assay
Drug (mg per tablet)Label claim
Recovery ± SD, (%) Conidence interval
Proposed methoda Reference HPLC method b
(Ansari et al., 2004) Lower Upper
Cozaar 50 103.4 ± 1.43 105.9 ± 1.66 -2.84 -0.75
Eklips 50 104.7 ± 2.45 105.9 ± 1.66 -2.65 -0.28
Loxibin 50 104.9 ± 3.21 105.9 ± 1.66 -2.82 0.87
Sarilen 50 104.6 ± 1.74 105.9 ± 1.66 -2.46 -0.21
Sarvas 50 104.3 ± 3.81 105.9 ± 1.66 -2.97 -0.23
ERK, N. Analysis of binary mixtures of losartan potassium and hydrochlorothiazide by using high performance liquid chromatography, ratio derivative spectrophotometric and compensation technique. J. Pharm. Biomed. Anal., v.24, p.603-611, 2001.
FOOD AND DRUG ADMINISTRATION. FDA. Center for Drug Evaluation and Research. Center for Veterinary Medicine. Guidance for industry bioanalytical method validation. Rockville: FDA, 2013. 8 p.
HERTZOG, D.L.; MCCAFFERTY, J.F.; FANG, X.; TYRRELL, R.J.; REED, R.A. Development and validation of a stability-indicating HPLC method for the simultaneous determination of Losartan potassium, hydrochlorothiazide, and their degradation products. J. Pharm. Biomed. Anal., v.30, p.747-760, 2002.
LASTRA, O.C.; LEMUS, I.G.; SÁNCHEZ, H.J.; PÉREZ, R.F. Development and validation of an UV derivative spectrophotometric determination of losartan potassium in tablets. J. Pharm. Biomed. Anal., v.33, p.175-180, 2003.
LATHEESHJLAL, L.; PARTHIBAN, P.; ALAGARSAMY, V.; SUNIL, M.; MAHUL, J.V.; MOHAN, T.R. Spectrophotometric determination of losartan potassium and its dosage form by bromothymol blue and phosphate buffer. E-J. Chem., v.7, p.320-324, 2010.
LUNG, K.R.; GORKO, M.A.; LLEWELYN, J.; WIGGINS, N. Statistical method for the determination of equivalence of automated test procedures. J. Autom. Methods Manag. Chem., v.25, p.123-127, 2003.
McCARTHY, K.E.; WANG, Q.; TSAI, E.W.; GILBERT, R.E.; IP, D.P.; BROOKS, M.A. Determination of losartan and its
degradates in COZAAR® tablets by reversed-phase
high-performance thin-layer chromatography. J. Pharm. Biomed. Anal., v.17, p.671-677, 1998.
MONTGOMERY, D.C. Design and analysis of experiments. New York: John Wiley and Sons, 1991. 145 p.
OZKAN, S.A. Simultaneous determination of losartan potassium and hydrochlorothiazide from tablets and human serum by RP-HPLC. J. Liq. Chromatogr. Related Technol., v.24, p.2337-2346, 2001.
PRABHAKAR, A.H.; GIRIDHAR, R. A rapid colorimetric method for the determination of Losartan potassium in bulk and in synthetic mixture for solid dosage form. J Pharm. Biomed. Anal., v.27, p.861-866, 2002.
RAHMAN, N.; SIDDIQUI, M.R.; AZMI, S.N.H. Development and validation of kinetic spectrophotometric method for the determination of losartan potassium in pure and commercial tablets. J. Chin. Chem. Soc., v.53, p.735-743, 2006.
RAO P.L.K.M.; VENUGOPAL, V.; ANIL-KUMAR, G.; RAJESH, B.; PRASAD, G.A.L.; RAVINDERGOUD, D. Quantitative estimation of losartan potassium in pharmaceutical dosage forms by UV spectrophotometry. Int. J. Res. Pharm. Chem., v.1, p.295-302, 2011.
RITTER, M.A.; FURTEK, C.I.; LO, M.W. An improved method for the simultaneous determination of losartan and its major metabolite, EXP3174, in human plasma and urine by high-performance liquid chromatography with fluorescence detection. J. Pharm. Biomed. Anal., v.15, p.1021-1029, 1997.
SANKAR, D.G.; RAJU, M.S.M.; MURTHY, T.K.; KUMAR, J.M.R.; SASTRY, C.S.P. Extractive spectrophotometric determination of losartan potassium using acidic and basic dyes. Indian Drugs, v.40, p.724-726, 2003.
SUBBARAO, J.; RAO, P.V.; VIDYADHARA, S.; RAO, B.V.; SASIDHAR, R.L.C. UV spectrophotometric validation for identiication and determination of losartan potassium in tablets. Int. J. Pharm. Technol., v.4, p.4137-4143, 2012.
WEBER, M. Clinical safety and tolerability of losartan. Clin. Ther., v.19, p.604-616, 1997.
Received for publication on 25th September 2013