*e-mail: [email protected] †in memoriam
Correlation Among Volumetric Conductivity, Electrical Threshold Field and
Compensation Plots by Oxidation Induction Time on LDPE/CB Composites
Adhemar Ruvolo Filhoa
*
, Aparecido Junior de Menezesa, Paulo Sergio do Nascimento Scarpab†a
Departamento de Química, Universidade Federal de São Carlos – UFSCar
São Carlos - SP, Brazil
b
Unidade de Tecnologia em Polímeros e Dielétricos,
Instituto de Tecnologia para o Desenvolvimento
Curitiba - PR, Brazil
Received: January 23, 2008; Revised: April 25, 2008
The thermodynamic compensation effect plot derived from Eyring rate process theory was applied to the thermal and UV ageing of LDPE/Carbon Black composites containing commercial carbon black (CB) and carbon black surface oxidized with nitric acid. Correlations were tested among compensation effect, electrical threshold field and volumetric electrical conductivity. Compensation plots from OIT measurements correlate with thermal
and UV ageing effect on activation ∆S and ∆H values, giving a good linear correlation for all samples studied.
The relative changes in dc conductivity and electrical threshold field are consistent with the OIT compensation plot, demonstrating that this analysis can be used to monitor LDPE/CB composite degradation under thermal or UV ageing. It can also be used to evaluate, quite accurately, the effect of oxidizing the surface of the CB on the electrical properties (dc conductivity and electrical threshold field) of the LDPE/CB composites.
Keywords: LDPE, Carbon black, compensation plots, OIT, volumetric conductivity, electrical threshold field
1. Introduction
Currently, polyethylene, in either its low-density form (LDPE) or especially its cross-linked form (XLPE), is one of the most widely used materials in underground distribution electric cables. There is an increasing interest in developing techniques to diagnose the operating state and predict the remaining life of electrical power equipment in service. Specifically, in Brazil, the need for such techniques is particularly important, due to the intense ultraviolet (UV) radiation, high temperature, and amount of rainfall.
Some researchers1-4 have suggested that the ageing mechanism
in polyethylene subjected to continual ac electrical stress in a humid environment involves the diffusion of injected ionic species and sub-sequently the build up of local space charges. Normally, for electrical
ageing test conditions, an ac field of about 6 kV.mm–1 has been used
for an extended period of time5,6. However, structural degradation,
mainly due to UV radiation, can lead to electrical discharges in the bulk polymer and on its surface, reducing its lifetime, and carbon black (CB) filler has been incorporated into the polyethylene (PE) matrix, which it protects efficiently against UV radiation. The content, as well the distribution or dispersion, of the CB plays an important role in the volumetric conductivity of these PE/CB composites.
Montanari7 pointed out that a life model which describes the
mechanisms of insulation degradation due to the presence of space charges is based on the assumption that even if the applied ac electric field is not large enough to inject hot electrons capable to breaking inter and/or intra-molecular bonds, the trapped charges are respon-sible for local storage of electromechanical and electrostatic energy which may favour degradation reactions by lowering an activation
barrier. This occurs above a certain level of ac electric fi eld, denomi-This occurs above a certain level of ac electric field,
denomi-nated the threshold field, which can be seen as the lowest electrical ageing threshold for insulating polymers. Obviously this threshold field depends strongly on the material and its processing history. An
investigation of this threshold may be of fundamental importance when correlated with the possible contribution of the CB aggregates to the properties of the LDPE/CB composites, since working at electric stresses below the threshold could mean prolonging the life with regard to electrical ageing.
The ageing phenomenon in polymeric insulation materials in-volves a multitude of effects acting sinergically, making their analysis as separate factors very challenging and unrealistic. The DSC-OIT or TGA-OIT measurements are widely used to determine the so-called oxidative induction time (OIT), which is a measure of the material’s oxidative stability. As a matter of fact, the oxidative stability of polymer insulation depends on many factors, some of which may be induced by ageing, such as increased concentration of oxidative by- products, decrease of antioxidants, synergic or antagonistic interactions between antioxidants, UV stabilizers and carbon black, cold crystallization, and water absorption. Then, it would be expected that changes in the polymer insulation oxidative stability may reflect its operating conditions, making the OIT measurement a possible diagnostic control tool. The main advantage of this technique is its high sensivity and ability to yield reliable results with a very small specimen sizes, 1-15 mg.
As pointed out by Montanari et al.8, the diagnostic power of
the DSC-OIT measurement is improved significantly when the test results are analysed according to Eyring rate theory and displayed
on the so-called compensation plot (activation entropy, ∆S, plotted
as a function of the activation enthalpy, ∆H)9.
commercial samples of virgin LDPE and LDPE/CB composite were used as reference materials.
2. Experimental
2.1. Raw materials
Two types of commercial sheets of LDPE, 60 µm thickness, were obtained from UNION CARBIDE, the first pure LDPE and the sec-ond a composite material with being around 3% carbon black filler. Also powdered LDPE MN 379 from POLIOLEFINAS (Brazil) was used to prepare composite materials with previously surface-treated carbon black N 220 from UNION CARBIDE.
2.2. Treatment of Carbon Black (CB)
CB N 220 (UNION CARBIDE) was mixed with concentrated
nitric acid in the proportion HNO3/ CB of 7: 1 w:w, and the
suspen-sion was refluxed for 4 hours at 100 °C to promote surface oxidation of the CB. After that the suspension was allowed to settle, decanted and filtered and the CB was thoroughly rinsed with distilled water to ensure that all traces of acid were removed. Finally, the CB was oven-dried in air at 50 °C for 4 days.
2.3. LDPE/ Carbon Black composite
Polymer composites of LDPE MN 379 with 3% (w/w) CB were prepared in a batch mixer equipped with six shoulder blades on a horizontal steel axle. The melting was promoted by viscous dissipa-tion of energy as a consequence of the high shear rate (blades rotating near 4000 rpm). The mixing time was controlled by monitoring the current consumption. The end-point was defined as 1.0 minute after the current passed through a maximum that corresponds to the region of wet-out of the filler or to the region of maximum temperature, as mixing occurs.
3. Characterization
3.1. Thermal measurements
Differential scanning calorimetric (DSC) spectra were recorded
with a DuPont DSC 2010 TA calorimeter with resolution of 1µW.mg–1,
and precision of 1%, with a maximum base-line background noise of
0.5 µW.mg–1. The instrument was calibrated against 3 different metal
standards (In, Sn and Pb ). All measurements were made at heating rate 10 °C/min from 30 °C up to 300 °C, on 10 mg of sample in the
form of a disc (5 mm of diameter), in a dynamic N2 atmosphere
flow-ing at 75 cm3/min.
Thermo-gravimetric analysis (TGA) was recorded with a DuPont
TGA 2050 TA analyser of resolution 0.2 µg. All measurements were
made at heating rate of 10 °C/min, from 30 °C up to 700 °C, on 7 mg
of sample in disc form (5 mm diameter), under N2 or O2 flowing at
10 cm3/min.
3.2. Electrical measurements
Press-moulded films of the LDPE/CB composite, denominated sample LDPECBTS, and commercial sheets of LDPE, with and without carbon black, respectively denominated samples LDPECBC
and LDPEBR, all with average thickness 60 µm were used for
conduction current measurement. Before all tests the samples were short-circuited for 24 hours at room temperature to avoid after- effect phenomena. After that, electrodes of diameter 15 mm were prepared by sputtering aluminium on both surfaces of disc-shaper polymer film samples. Charging was performed by a three terminal cell, at different levels of constant dc voltage with a Hewlett Packard HP
Model 6521A DC power supply, at room temperature for period of 700 minutes. Discharge current was than monitored with a Keithley Model 617 electrometer and the value obtained after 10 minutes was used to calculate the volumetric conductivity.
3.3. Scanning Electronic Microscopy (SEM).
The distribution and the degree of dispersion of carbon black ag-gregates in the LDPE/CB composite materials were analysed in SEM DSM 940 Zeiss microscopy images of the liquid-nitrogen fracture surface of polymer samples.
3.4. Ageing experiments
The LDPE and LDPE/CB composite films were subjected to three ageing treatments:
TA90: immersion in water at 90 °C for 7 days; TS90: oven-dried in air at 90 °C for 7 days; and
UV300: UV radiation in a specially designed cell. Inside the cell,
a low-pressure mercury G10T5172 lamp (GERMITEC) of 16 W
emitted ultra-pure UV light, main emission line 254 nm
correspond-ing to an energy of 5.44 eV (equivalent to an UV emission of 1.85 x
10–4 eV/s from the mercury lamp of 16 W). The ageing process was
carried out at 30 °C, in air, with the samples located 50 mm from the UV radiation source, for up to 300 hours.
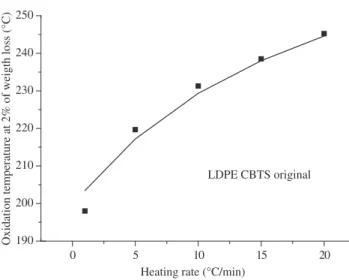
TGA-OIT measurements: To measure the OIT, the following methodology was used: i) the TGA was performed at 5 different heat-ing rates (1, 5, 10, 15, 20 and 30 °C/min); ii) takheat-ing an isopleth (2% of lost weight in the degradation region of the TG curve), from the curves obtained at each heating rate, the corresponding onset oxida-tion temperature(OOT) was obtained; iii) from a plot of oxidaoxida-tion temperature at 2% loss of weight vs. the heating rate, it is possible to extrapolate to a reference oxidation temperature (To) for zero heating
rate10, the values obtained being shown in Table 1 and a typical curve
in Figure 1; and iv) for each sample, the OIT measurements were made by pre-selecting 4 temperatures: two of them 5 and 10 °C below To and the other two 5 and 10 °C above To. The OIT measurements
were made, as in Statherpoulos et al.11, by placing the specimen in
a TGA cell enclosed in the TGA furnace. Inert gas (nitrogen) was passed through the cell at a rate of 90 mL/min. The cell was then heated at a constant rate of 20°C/min to a pre-selected temperature. After the temperature had stabilized the inert gas was replaced by dry oxygen flowing at the same rate. The TGA furnace was maintained at the same temperature until the output signal (sample weight) indicated oxidation.
According to the Eyring thermodynamic rate theory, the time t required to proceed from the original to the final state of an activated
process can be expressed as9:
t = h/kT exp(∆G/kT) = h/kT exp(–∆S/k) exp(∆H/kT) (1)
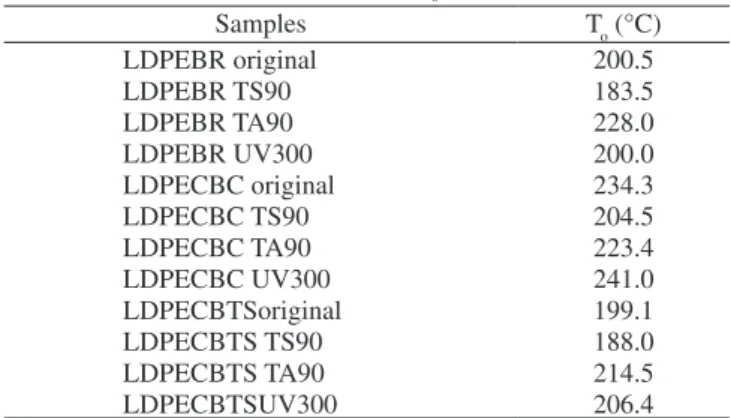
Table 1. Reference oxidation temperature (To)
Samples To (°C)
LDPEBR original 200.5
LDPEBR TS90 183.5
LDPEBR TA90 228.0
LDPEBR UV300 200.0
LDPECBC original 234.3
LDPECBC TS90 204.5
LDPECBC TA90 223.4
LDPECBC UV300 241.0
LDPECBTSoriginal 199.1
LDPECBTS TS90 188.0
LDPECBTS TA90 214.5
Vol. 11, No. 2, 2008 Compensation Plots by Oxidation Induction Time on LDPE/CB Composites 177
0 5 10 15 20
190 200 210 220 230 240 250
LDPE CBTS original
Oxidation temperature at 2% of weigth loss (°C)
Heating rate (°C/min)
Figure 1. Typical curve of OOT as a function of heat rate.
0 100 200 300 400 500 600 700
0 0.2 0.4 0.6 0.8 1.0
Temperature (°C)
Weight loss (%)
-0.1 0.0 0.1 0.2 0.3 0.4 0.5
Residue: 2.853% (0.1986 mg)
96.70% Stage 1 (6.730 mg)
Weight loss derivative (%/C)
a - Weight loss b - Derivative
(a) (b)
0 100 200 300 400 500 600 700
0 0.2 0.4 0.6 0.8 1.0
Temperature (°C)
Weight loss (%)
-0.1 0.0 0.1 0.2 0.3 0.4
Residue: 2.932% (0.2029 mg)
97,07% Stage 1 (6.715 mg)
Weight loss derivative (%/°C)
a - Weight loss b - Derivative
Figure 2. a) TG curve of LDPE CBC sample; and b) TG curve of LDPE CBTS sample.
500 nm 500 nm
(a) (b)
where, h and k, are the Planck and Boltzmann constants and ∆S and ∆H the entropy and enthalpy of activation during the OIT measure-ments. From Equation 1, a relationship between log (t.T) and 1/T can be derived:
log(t.T) = (log h/k – ∆S/k’) + ∆H/k’T = A + B. 1/T (2)
where k’ = k/log e ~ 2.3 k.
Letting t = OIT, determined from the experiments carried out at the different temperatures, A and B can be estimated by applying regression analysis to the experimental results plotted on the Eyring
coordinates (log (t.T)) and (1/T). Thus, from A and B the ∆S and ∆H
can be calculated. The existence of the compensation effect can be verified if a linear relationship exists between ∆S and ∆H.
4. Results and Discussion
Figure 2 shows the TGA analysis and carbon black content (residue) in the LDPE/CB composites. Both commercial and pre-pared samples gave practically the same values, 2.85 and 2.93% respectively.
Figure 3 shows, for comparison, SEM micrographs of the LDPE/ CB composites. As can be seen and estimated, the carbon black
aggregate has dimensions of the order 100 nm and 200 nm for the samples LDPECBTS and LDPECBC respectively. Also, note that the distribution and dispersion of the CB aggregates are better in the sample LDPECBTS, suggesting that processing under high shear has a positive effect on these properties.
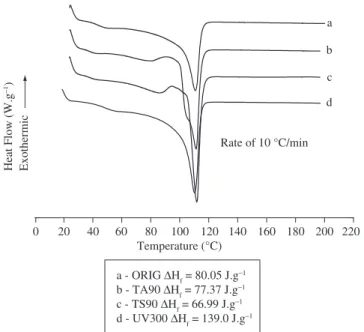
Figures 4, 5 and 6 show the DSC thermograms for the original and aged LDPEBR, LDPECBC and LDPECBTS samples.
Comparing the DSC melting behaviour in Figures 4-6, the fol-lowing events can be observed:
a) For all samples treated at 90 °C, in the presence of water (TA90), two endothermic events: a broad peak, like a shoulder extending from 95-105 °C and a sharp peak at about 110 °C. These results suggest that water can act as a plasticizer, induc-ing a recrystallization durinduc-ing the thermal treatment at 90 °C, and generating two populations of crystals of different size;
b) For all samples treated at 90 °C, in the absence of water (TS90), the melting behaviour for the samples BR and CBTS is the same, showing a single sharp endothermic peak at about 110 °C, whereas for the sample CBC, there is a sharp peak at about 115 °C and multiple small endothermic peaks extend-ing from 70-110 °C which can be attributed to polymorphic behaviour. In the same way, a broad isotherm peak appear in the curves 4b, 4c, 5b, 6b and 6c extending from 60-95 °C. Taking into account that the CBC showed a poor distribution
and dispersion and larger aggregates, as can be seen by com-paring Figures 3a and 3b, it could be postulated that if this phenomenon can reduce the reptation movement of the polymer chain segments, then during ageing at 90 °C the recrystalliza-tion process takes place, but results in a wide distriburecrystalliza-tion of crystals with different lamellar sizes that, during fusion, exhibit a polymorphic behaviour.
c) For all UV-irradiated samples, the melting behaviour seems to be the same, with just one endothermic peak at about 110 °C, but broader than that observed for the original sample at the same melting temperature.
These results confirm the effect of UV radiation on the mecha-nism of chain scission commonly observed in LDPE. The broadening observed in the melting endothermic peak indicates that during the 300 hours of UV time exposure, the LDPE can recrystallize, giving rise to a large population of crystals of different size, that corroborates with the higher melting enthalpy values show in Figures 4-6.
Figure 7 shows examples of OIT data plotted in the Eyring coordinates.
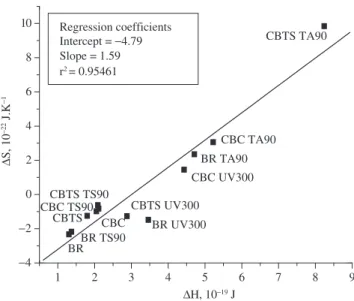
The activation ∆S vs. ∆H compensation plot, shown in Figure 8,
collects the data for all samples analysed after all the ageing condi-tions described in the experimental section. These components of activation energy are calculated from the slopes and intercepts of the linear plots of OIT data represented in Eyring coordinates, as shown in Figure 7.
It can be observed in Figure 8 that the points representing the diverse ageing conditions can be fitted by linear regression to one
compensation line with a coefficient of determination (r2) of 0.95,
giving a reasonable linear fit. The position of data points on the compensation plots can move along the compensation line,
demon-0 20 40 60 80 100 120 140 160 180 200 220
c
Rate of 10 °C/min d b a
Heat Flow (W.g
1)
Exothermic
Temperature (°C)
a - ORIG ∆Hf = 80.05 J.g1
b - TA90 ∆Hf = 77.37 J.g 1
c - TS90 ∆Hf = 66.99 J.g 1
d - UV300 ∆Hf = 139.0 J.g1
Figure 4. DSC thermogram for the LDPE BR sample.
0 20 40 60 80 100 120 140 160 180 200 220
Rate of 10 °C/min d c b a
Heat Flow (W.g
1)
Exothermic
Temperature (°C)
a - ORIG ∆Hf = 81.64 J.g 1
b - TA90 ∆Hf = 76.54 J.g1
c - TS90 ∆Hf = 98.53 J.g 1
d - UV3000 ∆Hf = 123.4 J.g
1
Figure 5. DSC thermogram for the LDPE CBC sample.
0 20 40 60 80 100 120 140 160 180 200 220
Rate of 10 °C/min d c b a
Heat Flow (W.g
1)
Exothermic
Temperature (°C)
a - ORIG ∆H = 110.9 J.g1
b - TA90 ∆H = 84.15 J.g1
c - TS90 ∆H = 76.12 J.g1
d - UV300 ∆H = 124.1 J.g1
Vol. 11, No. 2, 2008 Compensation Plots by Oxidation Induction Time on LDPE/CB Composites 179
strating the severity of the ageing conditions. Thus, with respect to the unaged samples, if the points move towards lower negative ∆S
and ∆H values, ageing seems to be accelerated. On the other hand,
if the points move to higher positive ∆S and ∆H values it seems that
the samples retain/or augment their original properties. Hence, from the results shown in Figure 8, the samples: CBC TA90, CBC UV300 and BR TA90, can be considered as having their original properties enlarged, and, CBTS TA90 as having its original properties markedly enhanced. This result is consistent with the thermal behaviour shown in Figures 5b, 5d, 4b and 6b, suggesting that the compensation plot reflects changes in the properties of a material, caused by thermal or UV ageing. Specifically, for the samples analysed, thermal ageing in the presence of water may eliminate some inhomogeneous stress frozen into the polymer matrix, which can be generated during processing, and induce its crystallization. Therefore it is relevant that, for the sample CBTS TA90, the surface treatment of the carbon black, which reduces its aggregate size, can contribute, to an increase in crystallinity, reducing the oxygen uptake taking place during the OIT measurements.
Another consideration can be made by comparing the result for the sample CBC UV300 with the sample CBTS UV300. The commercial samples, beyond carbon black, contain primary and secondary additives to prevent thermo-oxidation whereas our CBTS sample is free of these additives. Therefore, as pointed out by Peña
et al.12,13, the nature of the CB plays an important role in controlling
its performance as a stabilizing agent alone, as well as its interactions with light stabilizers and antioxidants, via adsorption-desorption processes as well as other chemical interactions. Thus, if there is a synergistic interaction between the additives and carbon black, it can improve the thermal behaviour of the LDPE matrix during the OIT measurements.
At this point it is important to consider some correlations be-tween the electrical properties measured (presented in Table 2) and
the ∆H values.
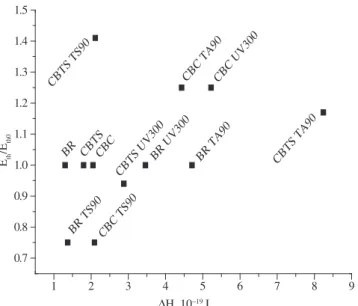
Figures 9 and 10 shown plots of the relative changes in dc
volu-metric conductivity = σ/σo, and electrical threshold field = Eth/Etho,
against ∆H values, where σo and Etho are the values before ageing.
In Figure 9, it can be observed that the same sample tests that
result in more positive ∆S values after ageing, as can be seen in
Figure 8, give relative changes in dc volumetric conductivity lower than unity and higher ∆H values. Furthermore, in Figure 10, it can be observed that these samples also exhibit increases around 20-30%
0.00198 0.00200 0.00202 0.00204 0.00206 0.00208 0.00210
5.6 5.7 5.8 5.9 6.0 6.1 6.2
6.3 LDPE CBC original
Log(tT), s.K
1/T, K1
r2 = 0.99441
Slop = 6459.09 Intercept = 7.22 Regression coefficients
(a)
0.00208 0.00210 0.00212 0.00214 0.00216 0.00218
5.5 5.6 5.7 5.8 5.9 6.0 6.1
LDPE CBTS original Regression coefficients
Intercept= 6.37
Slope = 5682.93
Log(tT), s.K
1/T,K1
r2 = 0.99051
(b)
Figure 7. Examples of OIT data plotted in Eiring coordinates: a) original CBC sample and b) original CBTS sample.
1 2 3 4 5 6 7 8 9
4 2 0 2 4 6 8
10 Regression coefficients
Intercept = 4.79 Slope = 1.59
CBC CBTS
BR TS90 BR CBTS TS90
CBC TS90 CBTS UV300
BR UV300 CBC UV300
BR TA90
CBTS TA90
CBC TA90
∆
S, 10
22 J.K
1
∆H, 1019 J
r2 = 0.95461
Figure 8. The ∆S vs. ∆H compensation plot for all the samples, before and after ageing treatments.
Table 2. Electrical properties measured for the samples after and before ageing conditions.
Samples σ,
10–19 S.mm–1
Eth, kV.mm–1
LDPEBR original 18 8.0
LDPEBR TS90 2.2 6.0
LDPEBR TA90 6.8 8.0
LDPEBR UV300 2.9 8.0
LDPECBC original 77 8.0
LDPECBC TS90 140 6.0
LDPECBC TA90 1.9 10
LDPECBC UV300 1.5 10
LDPECBTS original 0.66 8.5
LDPECBTS TS90 2.9 12
LDPECBTS TA90 0.31 10
in relative electrical threshold field. One surprise is the increase of around 40%, observed for the sample CBTS TS90. Therefore, it is important to take into account that the value obtained for the relative change of volumetric conductivity, for this sample, was four times higher than that of the original sample.
Carbon black consists of spherical, so-called primary particles. The basic buildings blocks of these particles are graphene layers, orientated concentrically. While these graphene layers can contain chemical discontinuities, in spite of these imperfections, the electri-cal conductivity inside the particle is certainly relatively high. Some
of the graphene layers can be extended over two adjacent particles14
and these overlapping graphene layers can ensure a relatively high conductivity between particles of the same aggregate. Hence, the most important factor contributing to the electrical resistance is certainly the interface between particles of different aggregates. It may thus be postulated that the chemical nature of the carbon black surface
strongly influences the electrical conductivity at this interface and that the distribution, dispersion and size of the carbon black aggregates are of crucial importance. The surface treatment of the carbon black with nitric acid increases the fraction of hydroxyl and other oxygen-containing groups. These groups, covering the surface of the carbon black particles, can raise the potential barrier to electrons moving from one aggregate to another or forms an insulating shield around
the particles15, so that the electrical conductivity of the carbon black
aggregate is diminished by oxidation with nitric acid. This analysis is consistent with the results shown in Table 2, where it can be ob-served that the volumetric conductivities of all CBTS samples (with exception of CBTS UV300) are lower than those of the commercial CBC samples.
5. Conclusions
The dc volumetric conductivity and electrical threshold field of LDPE/CB composites, in which the carbon black had been subjected to oxidative surface treatment, were measured before and after ther-mal or UV ageing.
Compensation plots derived from OIT measurements showed a correlation with the thermal and UV ageing effect on the values of activation ∆S and ∆H, giving a good linear relation between these thermodynamic parameters for all samples studied.
The relative changes in the dc conductivity and electrical thresh-old field were consistent with the OIT compensation plot, showing that this analysis can be used to monitor the LDPE/CB composite degradation under thermal or UV ageing. It also can provide, with a good accuracy, a measure of the improving effect of the oxidiz-ing the surface of the carbon black, on the electrical properties (dc conductivity and electrical threshold field) measured in LDPE/CB composites.
Acknowledgments
The authors are grateful to the Conselho Nacional para o Desen-volvimento Científico e Tecnológico do Brasil (CNPq) for financial support for this work.
References
1. Steenis EF, Krueger FH. Water treeing in polyethylene cables. IEEE
Trans. Dielectr. Electr. Insul. 1990; 25(5):989-1028.
2. Fouracre RA, Given MJ, Crichton BH. The effect of alternating electric
fields on ion migration in solid dielectrics. J. Phys. C.: Solid State Phys.
1986; 19:1949-1958.
3. Das-Gupta DK, Svatik A, Bulinski AT, Densley RJ, Bamji S, Carlsson DJ. On the nature of AC field aging of cross-linked polyethylene using
liquid electrodes. J. Phys. D: Appl. Phys. 1990; 23:1599-1607.
4. Dissado LA, Fothergill JC. Electrical Degradation and Breakdown in Polymers. Wiltshire, UK: Redwood; 1992.
5. Das-Gupta DK, Scarpa PCN. Polarization and dielectric behaviour
of AC aged polyethylene. IEEE Trans. Dielectr. Electr. Insul. 1996;
3(3):366-374.
6. Scarpa PCN, Svatik A, Das-Gupta DK. Dielectric spectroscopy of
polyethylene in the frequency range of 10–5 Hz to 106 Hz. Polym. Eng.
Sci. 1996; 36(8):1072-1081.
7. Montanari GC. The electrical degradation threshold of polyethylene
investigated by space charge and conduction current measurements. IEEE
Trans. Dielectr. Electr. Insul. 2000; 7(3):309-315.
8. Montanari GC, Motori A, Bulinski AT, Bamji SS, Densley J. Application of oxidation induction time and compensation effect to the diagnosis of
HV polymeric cable insulation. IEEE Trans. Dielectr. Electr. Insul. 1996;
3(3):351-360.
1 2 3 4 5 6 7 8 9
0.1 1.0 10.0
CBTS TA90 CBC UV300
BR TA90
CBC TA90 BR UV300 CBC TS90 CBTS TS90
CBTS UV300
CBC CBTS
BR TS90 BR
σσ
∆H, 1019 J
Figure 9. The σ/σo vs. ∆H plot for all the samples,before and after ageing treatments.
1 2 3 4 5 6 7 8 9
0.7 0.8 0.9 1.0 1.1 1.2 1.3 1.4 1.5
CBTS TA90 CBC UV300
CBC TA90 CBTS TS90
BR TA90 BR UV300 CBTS UV300 CBC CBTS BR
CBC TS90 BR TS90
Eth
/E
th0
∆H, 1019 J
Vol. 11, No. 2, 2008 Compensation Plots by Oxidation Induction Time on LDPE/CB Composites 181
9. Crine JP. A thermodynamic model for the compensation law and
its physical significance for polymers. J. Macromol. Sci. 1984;
B23:201-219.
10. Ruvolo-Filho A, Sampaio EMV, Marconcini, JM. Determinação da temperatura termodinâmica de início de oxidação. Anais do Encontro Regional de Usuários de Técnicas Termoanalíticas; 2003 Out 20; São Carlos, SP, Brasil: editora USP; 2003.
11. Kyriakou SA, Statherpoulos M, Parissakis GK, Papaspyrides CD, Kartalis CN. Oxidative induction time method based on thermogravimetry for
monitoring the restabilization of post-use LDPE. Polym. Degrad. and
Stab. 1999; 66:49-53.
12. Peña JM, Allen NS, Edge M, Liauw CM, Valange B. Interactions between
carbon black and stabilisers in LDPE thermal oxidation. Polym. Degrad.
and Stab. 2001; 72:163-174.
13. Peña JM, Allen NS, Edge M, Liauw CM, Valange B. Studies of synergism
between carbon black and stabilisers in LDPE photodegradation. Polym.
Degrad. and Stab. 2001; 72:259-270.
14. Hess WM, Herd CR. In: Donnet J, Bansal RC, Wang M, (editors). 2nd ed.
Carbon black science and thechnology. New York, USA: Marcel Dekker; 1993.
15. Gang Y, Zhang MQ, Zeng HM. Carbon-black-filled polyolefin as a positive temperature coefficient material: Effect of composition, processing and