Optimizing exponential growth of
Triticum aestivum
by
application of the relative addition rate (RAR) technique
utilizing a computer-controlled nutrient delivery system
José Carlos Pintro1*, Gregory James Taylor2 and Paula Toshimi Matumoto-Pintro1
1Department of Agronomy, State University of Maringá, CEP 87020-900 Maringá, PR, Brazil; 2Department of Biological Sciences,
University of Alberta, Edmonton, Alberta, Canadá, T6G 2E9. *Corresponding author: [email protected] Received: 17/09/2004, Accepted: 25/11/2004
We conducted experiments designed to assess whether plants can be grown under conditions of low ionic strength simulating natural soil conditions. Wheat (Triticum aestivum, cv. Atlas 66) plants were grown using ten different relative nutrient addition rates (RAR) of nutrients (0.00, 0.06, 0.09, 0.12, 0.15, 0.18, 0.21, 0.24, 0.27, and 0.30 day-1)with a background
solution containing 50 µmol.L-1 N and all other essential nutrients in optimal proportions relative to N. The relative growth
rate (RGR) of plants over a 19-day experimental period responded directly to RAR (from 0.06 to 0.21 day-1) with a linear slope
of 0.56 and an intercept of 0.085 day-1. Solution electrical conductivity (EC) values remained relatively stable over the
experimental period. We examined the effect of varying nutrient concentrations in background solutions on growth of wheat plants at a RAR of 0.20 day-1. Plant dry mass production in the 50 µmol.L-1 N background solution was higher than the
theoretical regression. On the other hand, plant dry mass production in the 0 µmol.L-1 N background solution was close to
theoretical regression (considering a relative growth rate of 0.20 g.g-1.day-1) throughout most of the experimental period.
Minimal fluctuations in solution EC values were observed over the experimental period. With the use of the computer-controlled nutrient delivery system and the RAR technique, it was possible to grow plants under conditions of low electrical conductivity simulating natural soil conditions.
Key words: growth, ionic strength, nutrient solution, wheat.
Otimização do crescimento exponencial de Triticum aestivum pela aplicação da técnica da adição relativa de nutrientes
utilizando um sistema computacional para a adição de nutrientes: Plantas de trigo (Triticum aestivum cv. Atlas 66) foram cultivadas em solução nutritiva utilizando 10 valores de adição relativa de nutrientes (ARN) (0,00; 0,06; 0,09; 0,12; 0,15; 0,18; 0,21; 0,24; 0,27 e 0,30 dia-1) com uma solução de base de 50 µmol.L-1 de nitrogênio (N) e demais nutrientes em quantidades
e proporções relativas ao N. O crescimento relativo das plantas (CRP) de trigo, durante 19 dias, apresentou correspondência positiva com os valores de ARN de 0,06 a 0,21 dia-1, com valor de coeficiente angular de 0,56 e coeficiente linear de 0,085 dia -1. Os valores de condutividade elétrica (CE) das soluções de cultivo não apresentaram grandes variações durante o período
experimental. Os efeitos da variação dos nutrientes na solução de base de cultivo sobre o crescimento exponencial das plantas de trigo foram avaliados considerando um valor de ARN de 0,20 dia-1. Os valores determinados de massa seca das plantas de
trigo foram superiores aos teóricos, quando na solução de base se utilizaram 50 µmol.L-1 de N. Quando, porem, não se
adicionaram nutrientes na solução de base de cultivo, os valores de massa seca determinados corresponderam aos valores teóricos (considerando um crescimento relativo de 0,20 g.g-1.dia-1). Constataram-se variações mínimas nos valores de CE das
soluções durante o período experimental. Com o uso da técnica da ARN, foi possível cultivar as plantas de trigo em soluções com valor de CE baixo, simulando as condições das soluções dos solos.
INTRODUCTION
It is difficult to individually study each factor that limits growth of plants using traditional techniques of soil culture (Blamey et al., 1983). To gain a better understanding of the potential effects of metals (i.e. aluminum) on growth of plants, an extensive amount of research has been conducted using solution culture techniques (Blamey et al., 1983; Furlani and Hanna, 1984; Blamey et al., 1991). Unfortunately, many studies have used nutrient and metal concentrations several fold higher than levels found in soil solution (Nelson and Keisling, 1980; Malavolta et al., 1981; Blamey et al., 1991; Clune and Copeland, 1999). It is important to simulate natural soil conditions in experiments carried out in nutrient solutions. Use of high concentrations of nutrients or metals creates an artificial rooting environment that can potentially alter nutrient acquisition and uptake patterns (Ingestad and Lund, 1979). If experimental conditions simulate natural environments, plant responses should more closely resemble those that would be observed under natural conditions. Experimental results may then be extrapolated to natural ecosystems with more confidence (Brunet, 1994). The calculated ionic strengths of acid soil solutions are normally lower than 5,000 µM (Gillman and Bell, 1978; Blamey et al., 1983; Pintro, 1995; Pintro et al., 1999).
The relative nutrient addition rate (RAR) technique was developed to study plant growth in low ionic strength solutions (Ingestad, 1982). Utilization of the RAR technique avoids many problems that can be encountered using other techniques (e.g. circulating solution culture, flowing solution culture, non-recirculating flow-through hydroponic system). Adequate nutrient replenishment in the growth solution using the RAR technique is achieved by frequent additions of nutrient to experimental containers (Stadt et al., 1992; Blair, 1997; Taylor et al., 1998).
In using the RAR technique, it has been demonstrated that plants adjust their relative growth rate (RGR, g.g-1.day-1) to
match the RAR of nutrients until the maximum potential growth rate (Rmax) of the plants is achieved (Ericsson, 1981; Ingestad, 1981; Stadt et al., 1992). The use of optimal proportions and quantities of nutrients in the additions is important for maintenance of maximum growth, efficient nutrient utilization, and low concentrations in the root medium (Ingestad, 1981). Despite the advantages of using this technique, most experiments have been carried out using background nutrients in the initial solutions (Stadt et al., 1992; Blair, 1997; Taylor et al., 1998). Use of background
concentration of nutrients in nutrient solutions has been required to support healthy growth of plants at low ionic strength, particularly in early stages of growth when daily nutrient additions are limited. Unfortunately, these background nutrient solutions also provide a source of nutrients that can be utilized by plants to support relative growth rates (RGRs) in excess of RAR. Supply of background nutrient solutions can also contribute to changes in plant-induced pH and electrical conductivity (EC) of growth solutions.
The objective of this work was to apply the RAR technique using a computer-controlled nutrient delivery system in order to control RGR of Triticum aestivum (cv. Atlas 66) and to mimic nutrient stress under field conditions. We set out to determine if high RGRs of wheat plants could be achieved in the absence of a background supply of any nutrients other than calcium. Blair and Taylor (2004) suggested that a minimum concentration of 400 µmol.L-1 Ca
is required for healthy growth of wheat. Pettersson and Strid (1989) and Pettersson (1995) also found that an initial Ca concentration of 500 µmol.L-1 was required in experiments
with wheat and barley. Traditionally these background concentrations of calcium have been provided as part of a complete nutrient solution.
MATERIAL AND METHODS
Seeds of Triticum aestivum, cultivar Atlas 66, were surface sterilized in a 1.05 % solution of sodium hypochlorite (v/v) for 20 min, then imbibed overnight in an aerated solution containing 0.005 g.L-1 Vitavax.
Germinated seeds were then grown in four aquaria (~300 seeds per aquarium) suspended over an aerated complete solution (10 L) containing 50 µmol.L-1 background
solution and an additional 400 µmol.L-1 Ca, adjusted to
pH 4.3 (using 1.0 mol.L-1 or 0.1 mol.L-1 HCl). The
complete nutrient solution with proportions adjusted to 50
µmol.L-1 N (used for all experiments) is presented in the
table 1. Four days after germination, plants were thinned to 90 uniform sized plants per aquarium and suspended over new background nutrient solution. At this time, 24 seedlings were dried for two hours (to constant weight) at 60oC to determine initial dry weight (W
o) for calculation
At = [C Wo MN-1]eRAR(t)[eRAR-1] 106 N
N-1 (1)
where,
At = nutrient addition (µL per aquarium)
C = concentration of nitrogen (N) present in plant tissue (0.04 g.g-1 dry weight)
Wo = the average of plant dry mass (g)
MN = the molecular weight of nitrogen (14.007 g.mol-1)
t = number of days after pretreatment (or treatment) initiation RAR = relative addition rate (day–1) during pretreatment and
treatment period
NN = normality of nitrogen in the addition solution
During the pretreatment period, nutrient additions were calculated at a RAR of 0.15 day-1, but reduced by half, as seed
reserves provide seedlings with sufficient nutrients, which accelerates the relative growth rate beyond desired levels (Blair and Taylor, 2004). During germination and the pretreatment period the pH of the solutions was not readjusted.
Seven days after germination (the start of the treatment period - day zero), spent seeds were removed from plants and 8 uniform seedlings were transferred to each of 60 polyethylene containers filled with 10 L aerated background solution (table 1) and an additional 400 µmol.L-1 Ca
(experimental solutions). Seedlings were suspended on
opaque Plexiglass covers, which were placed over the containers to inhibit algal growth. At the same time, 8 plants per replicate (six for all experiments) were collected, dried, and were used to calculated Wo for calculation of nutrient additions for the experimental period.
A computer-controlled nutrient delivery system was utilized to provide an accurate, daily supply of nutrients to experimental containers (Blair and Taylor, 2004). Two Watson Marlow multi-channel peristaltic pumps (model 202S) delivered nutrient solutions from the three nutrient reservoirs to three sets of 60 valves. One set of 60 valves supplied one solution to each of 60 growth containers. When open, each valve controlled the flow of one solution to one growth container. When all valves were closed, the nutrient solution circulated back to the nutrient reservoir. The system allows independent delivery of three separate solutions to each growth container (table 2). Nutrient delivery was controlled by a computer software program, which calculates nutrient additions (At) according to equation 1. Distilled water was added periodically to the nutrient solutions to maintain a volume of 10 L (to compensate for water loss by evaporation and transpiration). Containers were suspended in a common water bath to limit temperature fluctuations and maintain a constant temperature across all experimental containers.
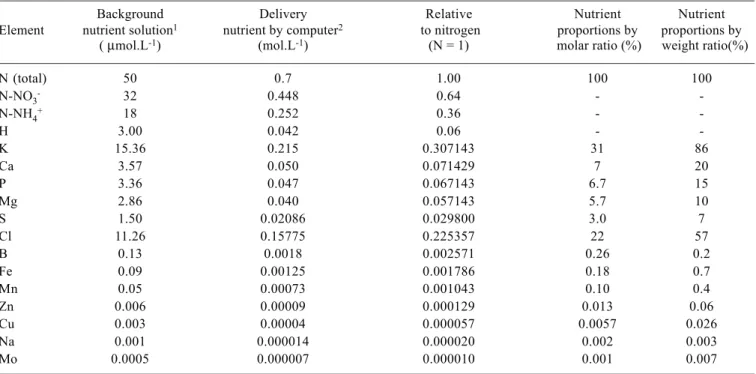
Table 1. Nutrient composition of the relative addition rate (RAR) delivery solution and background nutrient solution. Proportions by molar ratio and weight ratio in proportion to nitrogen (N = 100).
Background Delivery Relative Nutrient Nutrient
Element nutrient solution1 nutrient by computer2 to nitrogen proportions by proportions by
( µmol.L-1) (mol.L-1) (N = 1) molar ratio (%) weight ratio(%)
N (total) 50 0.7 1.00 100 100
N-NO3- 32 0.448 0.64 -
-N-NH4+ 18 0.252 0.36 -
-H 3.00 0.042 0.06 -
-K 15.36 0.215 0.307143 31 86
Ca 3.57 0.050 0.071429 7 20
P 3.36 0.047 0.067143 6.7 15
Mg 2.86 0.040 0.057143 5.7 10
S 1.50 0.02086 0.029800 3.0 7
Cl 11.26 0.15775 0.225357 22 57
B 0.13 0.0018 0.002571 0.26 0.2
Fe 0.09 0.00125 0.001786 0.18 0.7
Mn 0.05 0.00073 0.001043 0.10 0.4
Zn 0.006 0.00009 0.000129 0.013 0.06
Cu 0.003 0.00004 0.000057 0.0057 0.026
Na 0.001 0.000014 0.000020 0.002 0.003
Mo 0.0005 0.000007 0.000010 0.001 0.007
1during the pretreatment period
2during the treatment period
In background solutions an additional 400 µmol.L-1 CaCl
Solution pH and EC were monitored periodically with a Radiometer pHM80 pH meter and a Radiometer CDM80 electrical conductivity meter with a CDC 104 probe. Measurements were taken prior to planting and before nutrient additions.
Experiments were conducted in a controlled-environment growth chamber (7 m x 4 m), with 16 h light and 8 h darkness. Temperature for the light period ranged from 20 to 23oC and from 17 to 19oC during darkness.
Relative humidity varied from 55 to 65% in the light period and from 75 to 90 % in darkness. Light was provided by 57 cool white fluorescent lamps (25W) located 1 m above the Plexiglass covers. Photosynthetic flux density ranged from 311 (border container) to 609 (central container) µmol.m-2.s-1, with 90% of values ranging from
500 to 609 µmol.m-2.s-1.
Experiments: The goal of the first experiment was to determine the relative growth rate of wheat plants (cv. Atlas 66) cultivated in low background nutrient solutions (50
µmol.L-1 N, plus 400 µmol.L-1 Ca, Table 1) at ten relative
addition rates: 0.00, 0.06, 0.09, 0.12, 0.15, 0.18, 0.21, 0.24, 0.27, and 0.30 day-1) in a factorial design with 6 replicate
blocks. Plants were harvested at the end of a 19 d experimental period and were dried to a constant weight at 60oC. The RGR was calculated using the following
equation (Stadt et al., 1992):
RGR = (lnWt – lnWo) (t)-1 (2)
where,
Wt = final dry mass per pot (g) Wo = initial dry mass per pot (g)
t = number of days after treatment initiation
A second experiment was carried out to evaluate the growth response of plants to two background nutrient solution levels (0 and 50 µmol.L-1 N, plus 400 µmol.L-1 Ca) at a RAR
of 0.20 day-1. The duration of this experiment was 20 days. The
factorial design consisted of two background levels, ten harvest times (every 2 days) with 3 replicate blocks. After every harvest, plants were dried at 60oC for 2 days and weighed.
RESULTS AND DISCUSSION
The effect of RAR on RGR: The growth of wheat plants was influenced by the RAR treatments (figure 1). In the RAR treatments of 0.00 to 0.06 day-1, the RGR values exceed the
RAR values. This can be accounted for by the fact there was a mobilisation of reserves from seeds, which provided the plants with additional nutrients above those supplied by nutrients additions. Also, seedlings were cultivated during the pretreatment period in a dilute nutrient solution (background solution) containing 50 µmol.L-1 N and other
essential nutrients in the concentrations and proportions indicated in table 1. The RGR of plants responded directly to RAR with a linear slope (0.56 day-1) from 0.06 to 0.21
(figure. 1, see inset). The existence of a strong relationship between the values of RAR and the RGR of plants has been well demonstrated with Betula verrucosa (Ingestad and Lund, 1979), Salix spp. (Ericsson, 1981), Populus simonii, Paulownia tomentosa (Jia and Ingestad, 1984), and Triticum aestivum, cv. Neepawa (Stadt et al., 1992). At high RARs (from 0.21 to 0.30 day-1), the RAR exceed the RGR. In this
situation, there was no further increase in the plant mass production values (figure 1).
The intensity of chlorosis symptoms of late leaves was reduced when the RAR value was increased from 0.00 to 0.21 day-1. A normal green color of early and late leaves
was observed at a RAR of 0.21 day-1. In this treatment, no
sign of mineral stress was observed in the principal, lateral, and adventitious roots. When the RAR values increased above 0.21 day-1, early and late leaves showed a dark green
color, with a brown color of roots. The growth of the root system was dramatically reduced as RAR values were increased above 0.21 day-1.
The RAR treatments had a strong effect on solution EC values over the 19-day experimental period (figure 2). When
Table 2. Composition of stock nutrient solutions.
Reagents Molecular weight g.L-1 mol.L-1
Solution 1
NH4NO3 80.04 14.0070 0.175
NH4Cl 53.49 4.1189 0.077
Mg(NO3)2.6H2O 256.41 0.3846 0.0015
MgCl2.6H2O 203.31 7.8274 0.0385
Ca(NO3)2.4H2O 236.15 11.8075 0.050
HNO3 63.01 2.658 mL 0.042
Solution 2
KH2PO4 136.09 6.3962 0.047
KNO3 101.11 12.9421 0.128
K2SO4 174.27 3.4854 0.020
MnSO4.H2O 169.01 0.1234 0.00073
H3BO3 61.83 0.1113 0.0018
ZnSO4.7H2O 287.54 0.0259 0.00009
CuSO4.5H2O 249.68 0.0100 0.00004
Na2MoO4.2H2O 241.95 0.0017 0.000007
Solution 3
the RAR treatments were above 0.21 day-1, solution EC increased
during the last 10 days of the experimental period (figure 2). The increase in EC was the result of a greater rate of nutrient addition than nutrient uptake. Solution EC values were relatively stable over the experimental period for RAR treatments from 0.00 to 0.21 day-1.
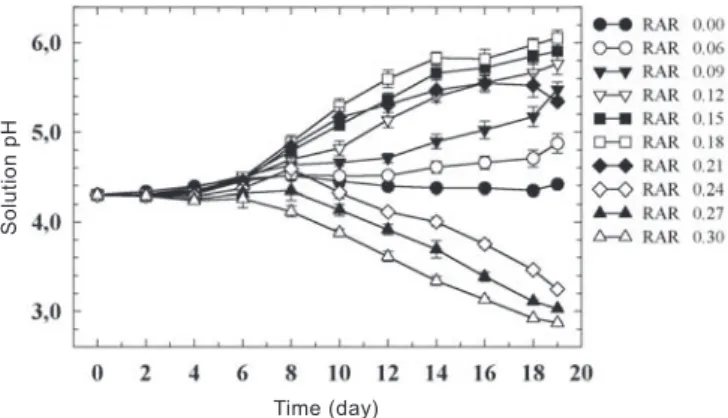
The RAR treatments also had a strong effect on solution pH over the experimental period (figure 3). The only RAR treatment that resulted in a constant pH over time was the RAR of 0.00 day-1 (figure 3). RAR treatments from 0.06 to
0.21 day-1 caused an increase in solution pH, beginning 4 - 6
days after planting. On the other hand, when the RAR treatments were higher than 0.21 day-1, solution pH declined.
The intensity of pH reduction was more evident with time. When the RAR treatments ranged from 0.06 to 0.21 day-1,
the solution pH values increased, particularly from the eighth day of the experimental period. An increase in the pH values was also observed by Stadt et al. (1992) and Blair (1997) working with wheat under similar experimental conditions. In this range of RARs, the nutrient additions did not exceed nutrient uptake and the EC remained relatively stable over time, indicating that the rate of nutrient uptake was in balance with the nutrient supply and nutrients did not build up in the growth solution. A possible explanation for the pH increase might be that anion uptake was higher than cation uptake by the roots. Anion uptake (e.g. nitrate) results in release of HCO3- (or influx of H+), which results in pH
increases (Loneragan, 1979; Troelstra, 1983).
Decreasing pH values (figure 3) could result from nutrient accumulation, which would result in a larger concentration of NH4+ available for uptake. As NH
4+ is preferentially
assimilated by plants and assimilation is accompanied by a release of H+, increased assimilation of NH
4+ results in a
decrease in pH values (Loneragan, 1979). In addition, the accumulation of NH4+ in the growth solution can result in
toxicity effects that could account for the discolouration of roots observed in these treatments (Ingestad, 1972; Ingestad and Stoy, 1982; Findenegg, 1987; Stadt et al., 1992).
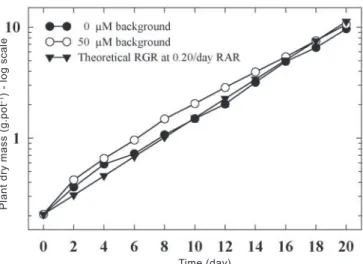
The effect of background solution on exponential growth: An experiment was designed to investigate the influence of two background solution concentrations on the growth of cultivar Atlas 66, supplied by a RAR of 0.20 day-1. At both
background levels, plant growth rate was close to the theoretical RGR (figure 4). The plant mass production in the 50 µmol.L-1 background was higher then the theoretical
regression for most (~14 days) of the experimental period.
Figure 1. Growth of wheat plants (cv. Atlas 66) under different relative addition rate values at a background concentration of 50 µmol.L-1 nitrogen for a 19-day experimental period.
Values are means ± SE of 6 replicates. Inset illustrates linear relationship between RAR and RGR at RAR values between 0.06 and 0.21.
Figure 2. Changes in the electrical conductivity of solutions supporting growth of wheat, cv. Atlas 66, over a 19-day experimental period. Values are means ± SE of 6 replicates. Inset illustrates conductivity changes for RAR treatments ranging from 0.0 to 0.21 day-1 using an expanded y-axis.
Figure 3. Changes in the pH of solutions supporting growth of wheat, cv. Altas 66, over a 19-day experimental period. Values are means ± SE of 6 replicates.
Relative addition rate (day-1)
Pl
a
n
t
d
ry
ma
ss
(g
.p
o
t
-1)
-
lo
g
sca
le
Time (day)
C
o
n
d
u
ti
vi
ty
(
µ
S.
cm
-1)
Time (day)
So
lu
ti
o
n
p
For the 0 µmol.L-1 background, the plant mass production
was higher than the theoretical regression after 2 and 4 days of growth, but was close to theoretical regression throughout the remainder of the experimental period. In contrast with the results obtained by Blair (1997), the results of this experiment suggest that plants growing under conditions of low ionic strength (i.e. low electrical conductivity) may not need a background supply of any nutrients other than calcium (400 µmol.L-1). These results are in agreement with those
obtained by Stadt et al. (1992), who observed that the background concentrations (ranging from 0 to 360 µmol.L-1) had no effect
on growth of wheat plants (cv. Neepawa) when the RAR was of 0.15 day-1. No signs of nutrient stress (shoot and roots) were
visually observed during the experimental period at both background levels (0 and 50 µmol.L-1) in our experiments.
Figure 4. Growth of wheat plants, cv. Atlas, with two different background solutions (0, 50 µmol.L-1) and a RAR of 0.20
day-1 for a 20-day experimental period. Values are means
of 3 replicates.
Figure 5. Changes in conductivity of solutions supporting growth of wheat plants, cv. Atlas 66, over a 20-day experimental period. Values are means ± SE of 3 replicates.
Figure 6. Changes in pH of solutions supporting growth of wheat plants, cv. Atlas 66, over a 20-day experimental period. Values are means ± SE of 3 replicates.
Little difference in the solution EC values was observed between the two background levels and solution EC values were relatively stable over time (122 d” EC d” 168 µS.cm-1)
(figure 5). In this experiment, solution pH values increased from the second to fourteenth day of the experimental period and decreased after this time for both background levels (figure 6). Solution pH values of 50 µmol.L-1 background
solutions were higher than those of 0 µmol.L-1 background
solutions. When solution pH increased (figure 6) the EC values tended to decline (figure 5). When solution pH decreased, the EC values tended to increase. During two weeks of the experimental period, the RGR was higher than RAR. In this situation, anion uptake exceeded cation uptake, resulting in an increase of solution pH (Loneragan, 1979). In the last week of the experimental period, RGR was lower than RAR. Cation uptake exceeded anion uptake and the result was a release of H+, which resulted in decrease of
solution pH (Loneragan, 1979).
We have demonstrated that a computer-controlled nutrient delivery system and the RAR technique can be used to grow plants with RGR controlled by the RAR of nutrients. In addition, we have shown that the RAR technique can be used to grow plants under conditions of low ionic strength (low electrical conductivity) with no requirement for a background supply of any nutrients other than calcium (400 µmol.L-1). This provides
a method for growth of plants under conditions simulating nutrient stress under natural field conditions.
Acknowledgements: to Coodenação de Aperfeiçoamento de Pessoal de Nível Superior (CAPES) for financial support (scholarship).
Time (day)
Pl
a
n
t
d
ry
ma
ss
(g
.p
o
t
-1)
-
lo
g
sca
le
Time (day)
C
o
n
d
u
ti
vi
ty
(
µ
S.
cm
-1)
Time (day)
So
lu
ti
o
n
p
REFERENCES
Blair LM (1997) Optimizing growth in low ionic strength solutions and the ameliorative effects of increased ionic strength on copper toxicity in Triticum aestivum (wheat).Edmonton, Alberta, Canada, University of Alberta. M.Sc. thesis.
Blair LM, Taylor GJ (2004) Maintaining exponential growth, solution conductivity, and solution pH in low-ionic strength solution culture using a computer-controlled nutrient delivery system. J. Exp. Bot. (in press). Blamey FPC, Edmeades DC, Asher C J, Edwards DC,
Wheeler DM (1991) Evaluation of solution culture technique for studying aluminum toxicity in plants. In: Wright RJ, Baligar VC, Murrmann RP (eds), Plant-Soil Interactions at Low pH, pp. 905-912. Kluwer Academic Publisher, Dordrecht, The Netherlands.
Blamey FPC, Edwards DG, Asher CJ (1983) Effects of aluminum, OH:Al and P:Al molar ratios, and ionic strength on soybean root elongation in solution culture. Soil Sci. 136:197-207.
Brunet J (1994) Interacting effects of pH, aluminum and base cations on growth and mineral composition of the woodland grasses Bromus benekenii and Hordelymus europaeus. Plant Soil 161:157-166.
Clune TS, Copeland L (1999) Effects of aluminium on canola roots. Plant Soil 216:27-33.
Ericsson T (1981) Growth and nutrition of three Salix clones in low conductivity solutions. Physiol. Plant. 52:239-244. Findenegg GR (1987) A comparative study of ammonium toxicity at different constant pH of the nutrient solution. Plant Soil 103:239-243.
Furlani PR, Hanna LG (1984) Avaliação da tolerância de plantas de arroz e milho ao alumínio em solução nutritiva. Rev. Bras. Ciên. Solo 8:205-208.
Gillman GP, Bell LC (1978) Soil solutions studies on weathered soil from tropical north Queensland. Aust. J. Soil Res. 16:67-77.
Ingestad T (1972) Mineral nutrient requirements of cucumber seedlings. Plant Physiol. 52:332-338.
Ingestad T (1982) Relative addition rate and external concentration: driving variables used in plant nutrition research. Plant Cell Environ. 5:443-453.
Ingestad T, Lund A-B (1979) Nitrogen stress in birch seedlings. I. Growth technique and growth. Physiol. Plant. 45:137-148.
Ingestad T, Stoy V (1982) Mineral nutrition of wheat, rye, barley, and oat seedlings in nutrient solutions. Swedish J. Agric. Res. 12:185-192.
Ingestad T (1981) Nutrition and growth of birch and grey alder seedlings in low conductivity solutions and at varied relative rates of nutrient addition. Physiol. Plant. 52:454-466. Jia H, Ingestad T (1984) Nutrient requirements and stress
response of Populus simonii and Paulownia tomentosa. Physiol. Plant. 62:117-124.
Loneragan JF (1979) The interface in relation to root function and growth. In: Harley JH, Russell RS (eds), The Soil-Root Interface, pp.351-367. Academic Press, New York. Malavolta E, Nogueira FD, Oliveira IP, Nakayama L, Eimori
I (1981) Aluminum tolerance of sorghum and bean – Methods and results. J. Plant Nutr. 3:687-694.
Nelson LR, Keisling TC (1980) Selection for ryegrass genotypes with tolerance to aluminum toxicity. Commun. Soil Sci. Plant Anal. 11:451-458.
Pettersson S, Strid H (1989) Aluminum toxicity in two cultivars of wheat (Triticum aestivum L.) with different sensitivity to Al as affected by the level of nutrient supply. Swedish J. Agric. Res. 19:183-191.
Pettersson S (1995) Low root zone temperature effects on net mineral nutrient uptake and distribution in barley (Hordeum vulgare). J. Plant Physiol. 145:459-464. Pintro J (1995) Effets de la toxite aluminique sur les plantules
de mais cultivees en solution nutritive de faible force ionique: Approches de quelques mecanismes explicatifs de la tolerance a l’aluminium. Rennes, France, ENSAR, These de doctorat.
Pintro J, Inoue TT, Tescaro MD (1999) Influence of the ionic strength of nutrient solutions and tropical acid soil solutions on aluminum activity. J. Plant Nutr. 22:1211-1221. Stadt KJ, Taylor GJ, Dale MRT (1992) Control of relative
growth rate by application of the relative addition rate technique to a traditional solution culture system. Plant Soil 142:113-122.
Taylor GJ, Blamey FPC, Edwards DG (1998) Antagonistic and synergistic interactions between aluminum and manganese on growth of Vigna unguiculata at low ionic strength. Physiol. Plant. 104:183-194.