Materials Research, Vol. 10, No. 3, 293-296, 2007 © 2007
*e-mail: [email protected]
The Effect of Polarisation on the Electrochemical
Behavior of Ti-13Nb-13Zr Alloy
Sérgio Luiz de Assis, Isolda Costa*
Materials Science and Technology Centre, IPEN/CNEN-SP,
Av. Prof. Lineu Prestes, 2242, 05508-900 São Paulo, SP, Brazil
Received: March 16, 2007; Revised: June 22, 2007
The effect of potentiostatic polarisation on the electrochemical behavior of the Ti-13Nb-13Zr alloy was investigated by electrochemical impedance spectroscopy (EIS) and potentiodynamic polarisation curves in Hanks’ solution at 37 °C. Potentiodynamic polarisation curves show a passive behavior with a slight current increase as potentials around 1300 mV(SCE). Based on these curves, different potentials were chosen to perform potentiostatic EIS experiments. EIS experimental data were interpreted using different equivalent circuits associated with the duplex nature of the oxide layer. The fitting procedure evidenced the thickening of a defective oxide layer with the applied potentials, corresponding to key points in the potentiodynamic polarisation curves.
Keywords: passive films, Ti-13Nb-13Zr, biomaterials, EIS
1. Introduction
Titanium alloys are very resistant to corrosion due to the highly protective oxide film, mainly composed of TiO2 that covers the me-tallic substrate. This oxide film is spontaneously formed on the Ti alloy surface when exposed to the atmosphere, and its thickness is initially approximately 1.4 nm, but it can reach 5 nm after 70 days, 8 to 9 nm after 545 days and 25 nm after 4 years of atmospheric exposure1. When the film is damaged, resulting in the exposure of
the metallic substrate, it is rapidly repaired in the presence of even traces of oxygen or humidity. Due to their high corrosion resistance associated to good mechanical properties and high strength-to-weight ratio, these alloys find wide applications, among them as biomaterials for implant fabrication.
The corrosion behavior and oxide properties characterisation of Ti and its alloys have been largely investigated and, in many of these studies, electrochemical methods, such as EIS and polarisation meth-ods, have been used. Zhu Cai et al.2,3 investigated the electrochemical
behavior of titanium and titanium alloys with various surface finish-ing in acid lactic/NaCl solution and modified Fusayama artificial saliva and the results showed an extensive passive region for these materials from the corrosion potential until approximately 1600 mV (Ag/AgCl). A large increase in current density occurred for potentials higher than this last potential, and the authors related it to the oxide film breakdown. However, at higher potentials, a decrease in current density was indicated in the polarisation curves, and these authors attributed it to repassivation.
Kolman and Scully4,5 studied the passivity behavior of β-type
titanium alloys in chloride solutions and also observed an increase in current density at potentials of approximately 1600 mV(SCE). Op-positely to Zhu Cai et al., Kolman and Scully attributed the current increase to the oxygen evolution reaction. They used optical micro-scopy to investigate the alloy surface after polarisation but pits were not found on it. According to these authors, pitting does not occur on these alloys until polarisation potentials of the order of 9 V. Kolman and Scully attributed the decrease in current density at potentials of approximately 1900 mV(SCE) to the decrease in the rate of the oxygen evolution reaction caused by the hindering of charge transfer
through the growing oxide film. This was also observed for other Ti alloys, at different potentials. Other researchers6 have also observed
this current density increase around this potential, at even larger rates, when the polarisation curves were obtained in more complex solu-tions, such as a MEM culture medium7, however, there is no general
agreement on what causes this current increase followed by its drop, in this potential range. The aim of this study was to evaluate the effect of potentiodynamic polarisation on the electrochemical behavior of Ti-13Nb-13Zr alloy using polarisation curves and electrochemical impedance spectroscopy (EIS), besides of investigate the causes of current density variations at around 1300 mV(SCE).
2. Materials and Methods
The near-β Ti-13Nb-13Zr alloy used in this study was laboratory prepared by Schneider8, and its chemical composition determined by
inductively coupled plasma - atomic emission spectroscopy (ICP-AES) is shown in Table 1. The alloy was obtained by melting pure Ti and Nb (99.9%) and Zr containing up to 4.5% of Hf, in an arc melting furnace, using a non consumable electrode, in an argon atmosphere. After melting, the ingot was heat treated for 1 hour at 1000 °C, fol-lowed by water-cooling for homogenisation. Subsequently, the alloy was cold worked (forged) to a diameter of 6.5 mm. During the forging stage the alloy was once again heat treated at 1000 °C, followed by water cooling8.
Working electrodes were prepared by cold epoxy resin mounting, leaving an exposed area of 0.33 cm2. The surface was prepared by
294 Assis & Costa Materials Research
After surface preparation and prior to EIS tests, all the samples remained immersed for 72 hours in the test electrolyte and the open circuit potential was accompanied until a steady state was reached. Afterwards EIS diagrams were sequentially obtained firstly at the open circuit potential (OCP), and then at 500 mV(SCE) and 1300 mV(SCE), in these last two cases a 20 minutes polarisation step was applied prior to the EIS experiments. The EIS data at the various potentials were obtained with only one working electrode.
EIS tests were carried out by means of a Solartron SI-1255 fre-quency response analyser coupled to a EG&G PARC 273A poten-tiostat and controlled by the software Zplot. EIS measurements were performed in potentiostatic mode and the frequency range was from 100 kHz to 10 mHz. The amplitude of the perturbation signal was 10 mV with 6 points per decade acquisition rate.
Polarisation was carried out using an EG&G PARC 273A Poten-tiostat in the potential range from –800 mV(SCE) to 3000 mV(SCE) and the scan rate was 1 mV.s-1.
3. Results and Discussion
Figure 1 shows a polarisation curve for the Ti-13Nb-13Zr after 72 hours of immersion in Hanks’ solution. The current density increased with the polarisation potential from the OCP until ap-proximately 500 mV(SCE). From this last potential until nearly 1300 mV(SCE) the current was fairly constant and in the order of 10-6 A.cm-2, that is typical of a passive behavior. The current increase
with potential from OCP to 500 mV(SCE) might be due to the rela-tively high scan rate used and consequently the thickening of the oxide film being insufficient to compensate the high field effects of the overpotential. At 1300 mV(SCE) the current density increased again but at approximately 1700 mV(SCE) the current density sta-bilised once more with the potential increase at nearly 14 µA.cm-2
until 3 V(SCE), when the polarisation test was finished.
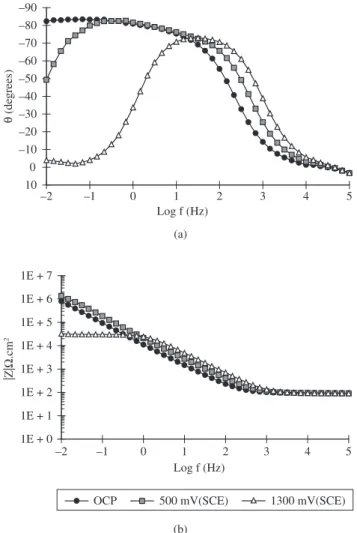
The Bode diagrams corresponding to the EIS results obtained at OCP, 500 mV(SCE) and 1300 mV(SCE) are shown in Figure 2. The polarisation potentials at which the EIS data were obtained were chosen from the results of the polarisation curves and represent the begin of the first current plateau and the second current increase, respectively. The impedance diagrams obtained at OCP show a highly capacitive behavior from medium to low frequencies with phase an-gles approaching –90°, typical of passive materials. For the samples polarised at 500 mV (SCE) however, there is a significant decrease Table 1. Chemical composition of Ti-13Nb-13Zr alloy.
Element C H N O S Hf Fe Nb Zr Ti
% (mass) 0.035 0.011 0.004 0.075 <0.001 0.055 0.085 13.18 13.49 Bal.
Table 2. Chemical composition of Hanks’ solution.
Component Concentration (Mol.L-1)
NaCl 0.1369
KCl 0.0054
MgSO4.7H2O 0.0008
CaCl2.2H2O 0.0013
Na2HPO4.2H2O 0.0003
KH2PO4 0.0004
C6H12O6H2O 0.0050
Red phenol 1% 0.0071
pH 6.8
–1.5 –0.5 0.5 1.5 2.5 3.5
1E-10 1E-9 1E-8 1E-7 1E-6 1E-5 1E-4
Current density (A.cm-2)
Potential (V (SCE))
Figure 1. Potentiodynamic polarisation curve for Ti-13Nb-13Zr alloy after 72 hours of immersion in Hanks’ naturally aerated solution at pH 6.8 and 37 °C.
–90 –80 –70 –60 –50 –40 –30 –20 –10 0 10
–2 –1 0 1 2 3 4 5
Log f (Hz)
(de
grees)
(a)
1E + 0 1E + 1 1E + 2 1E + 3 1E + 4 1E + 5 1E + 6 1E + 7
–2 –1 0 1 2 3 4 5
Log f (Hz)
|Z|
.cm
2
OCP 500 mV(SCE) 1300 mV(SCE)
(b)
Vol. 10, No. 3, 2007 The Effect of Polarisation on the Electrochemical Behavior of Ti-13Nb-13Zr Alloy 295
in the phase angles at low frequencies but they increase at medium frequencies. The results at low frequencies suggest the deterioration of the protective properties of the passive film whereas that at high frequencies might indicate the oxide film thickening. The EIS data obtained for the specimens polarised at 1300 mV (SCE) show a relatively large peak at frequencies in the range 100 Hz – 10 Hz that could indicate the complete deterioration of the protective properties of the oxide film. The large peak might include the contributions of both time constants, which related to charge transfer and the remain-ing oxide film on the alloy surface.
The EIS results indicate that the oxide layer is increasingly dis-turbed with the increase in the electric field applied (overpotential) leading to an increasingly less protective oxide layer on the Ti alloy than that formed at OCP.
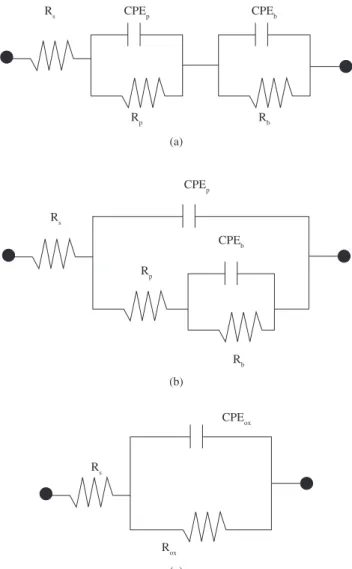
The EIS plots were interpreted using the Zview plot and the equiva-lent electrical circuits shown in Figure 3. Three different equivaequiva-lent electric circuits were chosen to represent the electrochemical behavior of the Ti alloy under the various polarisation conditions used. EIS data obtained at OCP were fitted to the equivalent electric circuit shown in Figure 3a, whereas the diagrams corresponding to the specimens polarised at 500 mV(SCE) and 1300 mV(SCE), the equivalent circuits shown in Figures 3b and 3c were used.
Figure 3. Equivalent electrical circuit used for fitting experimental data obtained at a) OCP; b) 500 mV(SCE); and c) 1300 mV(SCE), which are shown in Figure 2.
CPEb
CPEp
Rs
Rb
Rp
(a)
CPEb
CPEp
Rb
Rp
Rs
(b)
CPEox
Rox
Rs
(c)
The equivalent electrical circuit shown in Figure 3a was used by Kolman and Scully4,5 and Yu et al.9 to study oxide films on titanium
and titanium alloys in aqueous environments, while that shown in Figure 3b was applied by Pan et al.10 to investigate the electrochemical
behavior of titanium in phosphate buffer solution (PBS). These two circuits are based on the model of a duplex structure oxide composed of an inner barrier layer and an outer porous layer. This latter layer contains microscopic pores, whereas the barrier layer is compact and related to a very large resistance. The two circuits proposed contain resistance and constant phase elements. The components Rs, Rp and Rb are related to solution, porous layer and barrier layer resistance, respectively. The constant phase elements, CPEb e CPEp are associated to the capacitive behavior showed by the barrier and porous layer, respectively. Incorporation of species from the electrolyte occurs through the microscopic pores of the porous layer. This might result in a slight increase in resistance with time. According to literature11,12
this layer is associated to the biocompatibility presented by titanium alloys. The time constant at high frequency is related to this layer. The Rp component is related to the pores resistance to current transfer.
The parallel components Rb and CPEb represent the processes occurring at the barrier layer and this layer has been associated to the high corrosion resistance of the titanium alloys10. The CPE
b
component corresponds to the capacitance of the barrier layer that is accountable for the high phase angles at low frequencies. On the other hand, Rb is related to the barrier layer resistance to species transport and current transfer.
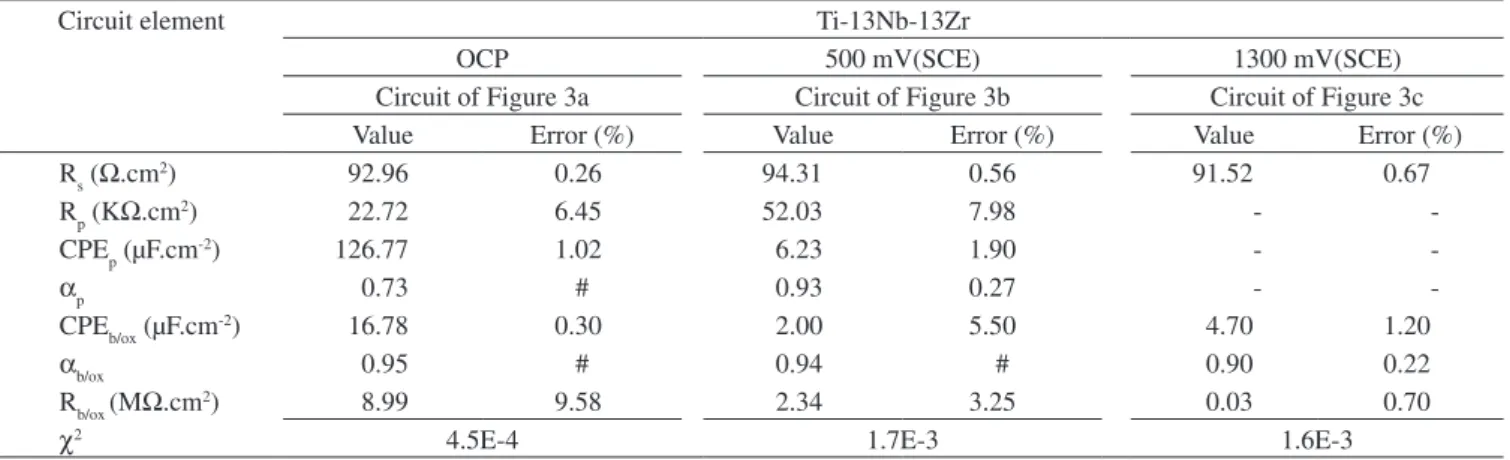
The values of the equivalent circuit components obtained from fitting to the various equivalent circuits proposed are shown in Ta-ble 3. The errors associated to each fitted component were provided by the program.
For specimens polarised at 500 mV(SCE), the EIS diagrams in-dicated partial deterioration of the passive film and, consequently, the first model proposed was not proper and the one suggested is shown in Figure 3b. The values of Rp and CPEp obtained with this model suggest the thickening of the porous layer, indicated by the increase in resistance and decrease of the layer capacitance. The higher phase angles in the high frequency range obtained at 500 mV(SCE) com-paratively to OCP supports this hypothesis. On the other hand, the barrier layer also seems to have been affected by polarisation, as it presents lower resistance values in the polarised condition.
Although both circuits 3a and 3b are based on similar oxide film model, the first model is seemingly more appropriate to simulate highly protective oxide films whereas the second type has been usu-ally associated to defective coatings or films.
The equivalent circuit shown in Figure 3c, with only one time constant, was used to fit the results obtained at 1300 mV(SCE). The sample shows a resistive behavior, as indicated in the Bode plots This response point to the deterioration of both barrier and porous layers as the polarisation increased, with the superposition of the two time constants, as indicated by the relatively broad phase angle peak. However dissolution of the oxide layer at the more positive potential cannot be overruled, as the capacity value increases. According to literature13, the change of the phase angle peak at medium frequencies
to higher frequencies and the decrease in its capacitive behavior are related to the deterioration of the oxide film properties.
296 Assis & Costa Materials Research
(resistance) at OCP. This indicates that as the polarisation increases the layer becomes highly defective, exposing the metallic substrate at the pores base.
4. Conclusions
The results of this study indicated that polarisation resulted in decreased protective properties of the oxide film on titanium alloys. For large overpotentials (1300 mV(SCE)) the barrier layer becomes highly defective, exposing the metallic substrate at the pore bases, causing the decrease in its resistance. Based on the EIS results we suggest that barrier layer deterioration must be the reason for the increase in current always found at potentials around 1300 mV(SCE) in the polarisation curves of Ti and its alloys.
References
1. Birch JR, Burleigh TD. Oxides formed on titanium by polishing, etching, anodizing, or thermal oxidizing. Corrosion. 2000; 56(12):1233-1241.
2. Cai Z, Nakajima H, Woldu M, Berglund A, Bergman M, Okabe T. In vitro corrosion resistance of titanium made using different fabrication methods. Biomaterials. 1999; 20(2):183-190.
3. Cai Z, Shafer T, Watanabe I, Nunn ME, Okabe T. Electrochemical char-acterization of cast titanium alloys. Biomaterials. 2003; 24(2):213-218.
4. Kolman DG, Scully JR. Electrochemistry and passivity of Ti-15V-3Cr-3Al-3Sn β-titanium alloy in ambient temperature aqueous chloride solutions.
Journal of the Electrochemical Society. 1994; 141(10):2633-2641.
5. Kolman DG, Scully JR. Electrochemistry and passivity of a Ti-15Mo-3Nb-3Al beta-titanium alloy in ambient temperature aqueous
Table 3. Values of electrical components obtained from fitting the circuits shown in Figure 3 to the experimental results from electrochemical impedance tests for 72 hours immersion in Hanks’ solution at 37 ºC of Ti-13Nb-13Zr alloy at three potentials.
Circuit element Ti-13Nb-13Zr
OCP 500 mV(SCE) 1300 mV(SCE)
Circuit of Figure 3a Circuit of Figure 3b Circuit of Figure 3c
Value Error (%) Value Error (%) Value Error (%)
Rs (Ω.cm2) 92.96 0.26 94.31 0.56 91.52 0.67
Rp (KΩ.cm2) 22.72 6.45 52.03 7.98 -
-CPEp (µF.cm-2) 126.77 1.02 6.23 1.90 -
-αp 0.73 # 0.93 0.27 -
-CPEb/ox (µF.cm-2) 16.78 0.30 2.00 5.50 4.70 1.20
αb/ox 0.95 # 0.94 # 0.90 0.22
Rb/ox (MΩ.cm2) 8.99 9.58 2.34 3.25 0.03 0.70
χ2 4.5E-4 1.7E-3 1.6E-3
# - Value was fixed.
chloride solutions. Journal of the Electrochemical Society. 1993; 140(10):2771-2779.
6. Choubey A, Balasubramaniam R, Basau B. Effect of replacement of V by Nb and Fe on the electrochemical and corrosion behavior of Ti-6Al-4V in simulated physiological environment. Journal of Alloys and Compounds. 2004; 381(1/2):288-294.
7. Assis SL. Investigation on the corrosion resistance of Ti-13Nb-13Zr
al-loy by electrochemical techniques and surface analysis. [Ph.D Thesis].
University of São Paulo, IPEN; Brazil, 2006.
8. Schneider SG. Processing and characterization of Ti-13Nb-13Zr alloy for
Biomedical Application. [Ph.D thesis]. University of São Paulo, IPEN;
Brazil, 2001.
9. Yu SY, Brodrick CW, Ryan MP, Scully JR. Effects of Nb and Zr alloying additions on the activation behavior of Ti in hydrochloric acid. Journal
of the Electrochemical Society. 1999; 146(12):4429-4438.
10. Pan J, Thierry D, Leygraf C. Electrochemical impedance spectroscopy study of the passive oxide film on titanium for implant application.
Electrochimica Acta. 1996; 41(7/8):1143-1153.
11. Pan J, Thierry D, Leygraf C. Hydrogen peroxide toward enhanced oxide growth on titanium in PBS solution: Blue coloration and clinical relevance.
Journal of Biomedical Materials Research. 1996; 30(3):393-402.
12. Pan J, Liao H, Leygraf C, Thierry D, Li J. Variation of oxide films on titanium induced by osteoblast-like cell culture and the influence of an H2O2 pretreatment. Journal of Biomedical Materials Research. 1998; 40(2):244-256.
13. Palomino LEM. Microstructural characterization and electrochemical impedance spectroscopy study of the corrosion resistance of 2024-T3 alloy, used in the aeronautical industry, coated with an environmental
friendly conversion coating. [M.Sc. Dissertation]. University of São Paulo: