Introduction
Human gait can be deined as the process where the moving body is sustained by one leg, followed by the other, in successive unbalances (Inman et al., 1981). Historically, qualitative evaluation of gait has been dificult, usually being based on the subjective point of view of the physician or physiotherapist, using methods whose effectiveness could not be properly measured. Such limitations have led physicians, engineers, and other movement scientists to develop gait recording and analysis methods and equipment.
In medical and physiotherapy research, the most commonly used method in the study of gait phases is
kinematic analysis (Kerrigan, 1998; Perry, 2004). In the past few decades, technological advancements have facilitated gait studies through the use of advanced 3D motion capture systems. However, due to their high cost, 3D motion capture systems are still restricted to research environments. A simpler and more accessible solution for clinical practice is the use of 2D systems, with a single camera that records gait movement in the sagittal plane. In this method, movement from the video captured by the camera is studied by a data collection system, which provides the position of a series of markers placed at the extremities of the lower limb members. With this information, it is possible to deine vectors that represent the member’s segments, and from these vectors, several variables can be deined that can be used for analysis. The following variables are most commonly used:
• Speed: distance traveled by the body per time unit;
• Cadence: number of steps per time unit; • Gait cycle: interval between successive heel
strikes of the same foot;
• Stride length: distance between two successive heel strikes of the same foot;
• Step length: distance between the feet, when both are touching the ground;
Reconstruction of gait biomechanical parameters using cyclograms
and artiicial neural networks
Thiago Bruno Caparelli
1*, Eduardo Lázaro Martins Naves
11Biomedical Engineering Lab, Electric Engineering Faculty, Federal University of Uberlândia, Uberlândia, MG, Brazil.
Abstract Introduction: Historically, assessing the quality of human gait has been a dificult process. Advanced studies can be conducted using modern 3D systems. However, due to their high cost, usage of these 3D systems is still restricted to research environments. 2D systems offer simpler and more affordable solutions. Methods: In this study, the gait of 40 volunteers walking on a treadmill was recorded in the sagittal plane, using a 2D motion capture system. The extracted joint angles data were used to create cyclograms. Sections of the cyclograms were used as inputs to artiicial neural networks (ANNs), since they can represent the kinematic behavior of the lower body. This allowed for prediction of future states of the moving body. Results: The results indicate that ANNs can predict the future states of the gait with high accuracy. Both single point and section predictions were successfully performed. Pearson’s correlation coeficient and matched-pairs t-test ensured that the results were statistically signiicant. Conclusion: The combined use of ANNs and simple, accessible hardware is of great value in clinical practice. The use of cyclograms facilitates the analysis, as several gait characteristics can be easily recognized by their geometric shape. The predictive model presented in this paper facilitates generation of data that can be used in robotic locomotion therapy as a control signal or feedback element, aiding in the rehabilitation process of patients with motor dysfunction. The system proposes an interesting tool that can be explored to increase rehabilitation possibilities, providing better quality of life to patients.
Keywords Gait, Cyclogram, Artiicial Neural Network.
This is an Open Access article distributed under the terms of the Creative Commons Attribution License, which permits unrestricted use, distribution, and reproduction in any medium, provided the original work is properly cited.
How to cite this article: Caparelli TB, Naves ELM. Reconstruction of gait biomechanical parameters using cyclograms and artificial neural networks. Res Biomed Eng. 2017; 33(3):229-236. DOI: 10.1590/2446-4740.01017
*Corresponding author: Biomedical Engineering Lab, Electric Engineering Faculty, Federal University of Uberlândia, Av. João Naves de Ávila, 2121, Santa Mônica, CEP 38408-100, Uberlândia, MG, Brazil. Email: [email protected]
• Joint angles: angles formed between the body’s moving segments.
However, it can be argued that cyclic processes, such as gait, can be better represented by cyclic diagrams (Grieve, 1968). In this speciic case, angle-angle diagrams known as cyclograms are used. These graphs are objective, reliable, and appropriate for statistical studies (Goswami, 2003). As this technique is based on geometrical igures, its values can easily be recognized. Hip-knee cyclograms represent most of the movement of the body (torso, hip, and legs), and therefore can provide useful parameters to differentiate several kinds of gait (Barton and Lees, 1997). Such parameters can be used in different ways for rehabilitation therapies, including those that make use of artiicial intelligence.
The use of artiicial intelligence for biomechanical variable prediction has been widely studied in the past few years. Semwal et al. developed a biometric gait identiication system based on multi-layer perceptrons (MLPs), capable of accurately identifying several types of indoor and outdoor activities (Semwal et al., 2015). Sharma et al. achieved the same results using genetic programming with multiple classiiers (Sharma et al., 2016). Kutilek et al. developed a system based on artiicial neural networks (ANNs), capable of predicting gait from a cyclogram (Kutilek and Farkasova, 2011; Kutilek and Viteckova, 2012), using information such as actual joint angles, angular acceleration, weight, and age of the individual, in addition to elements based on linear regression and principal component analysis (PCA).
Considering how versatile cyclic diagrams are, the hypothesis of this study is that the cyclogram track (that represents the kinematic behavior of the body during gait) can be predicted by an intelligent system. This track can then be used as input or comparison parameter in robotic locomotion therapies, allowing individualized treatment, using the pattern itself as feedback.
Methods
Data collection for this study was carried out at the biomechanics laboratory of the Physical Education Faculty at the Federal University of Uberlandia. The study was submitted and approved by the university’s ethics committee (CEP/UFU 414/10).
The sample for this study comprised forty healthy volunteers (20 female and 20 male, aged 18–30 or greater than 60), who consented to participate in this study. Eligibility criteria for participation were as follows:
• Healthy individuals, meaning they could maintain independence, self-determination and autonomy, without any limitations in daily life activities; • Regularly undertake physical exercise;
• Absence of any injury, trauma, fractures, or surgery of the lower limbs, which may alter gait; • Body mass index (BMI) < 30 kg/m2;
• No postural hypotension, alterations in the vestibular system at the time of testing, and a muscular strength score greater than three for the muscles examined in this study;
• A Berg equilibrium scale (BES) score of greater than or equal to 41;
• No vascular disorders, or rheumatological or neurological diseases with motor sequelae. Volunteers were divided in four groups, each with 10 individuals, namely, a young male group (YM), young female group (YF), elderly male group (EM), and elderly female group (EF). The young groups comprised volunteers with the following characteristics:
• Age: 18 to 30 years, with a mean of 21.7 years, Standard deviation (SD) 3.06 years;
• Body mass: mean 65.09 kg, SD 11.97 kg; • Height: mean 1.70 m, SD 0.10 m; • BMI: mean 22.52 kg/m2, SD 2.67 kg/m2; Elderly groups comprised volunteers that participated in the Physical and Recreative Activities for Elderly – Active Life Project (AFRID), conducted by the Physical Education Faculty, with the following characteristics:
• Age: 60 years or greater, with a mean of 68.95 years, SD 6.72 years;
• Body mass: mean 67.17 kg, SD 10.66 kg; • Height: mean 1.63 m, SD 0.84 m; • BMI: mean 25.17 kg/m2, SD 2.96 kg/m2. Volunteers initially submitted their anamnesis for physical evaluation, followed by a BES application to determine the risk factors associated with the loss of independence and falls in the elderly participants. Following this, hip muscle force (lexors, extensors and rotators) was investigated using Oxford’s scale manual strength test, with scores ranging from 0 to 5 (Kendall et al., 2007).
In the next step, each volunteer walked freely on the treadmill for an adjustment period, without a pre-determined time. Their comfort speed was then determined. For the experiments, a REEBOK, TR3 Premier Run Treadmill
was used, with a 3 hp motor, maximum speed of 16 km/h, incline ranging from 0 to 15°, and a canvas scroll 50 cm wide and 152 cm long.
Orange markers of 1 cm diameter were ixed with adhesive tape at the right hemisphere (Figure 1) of the following anatomic prominences: the greater femoral trocanter, lateral femoral epicondyle, and lateral tibial malleolus. For the hip and knee joints, member symmetry was assumed (Forczek and Staszkiewicz, 2012).
was repeated without any inclination. These inclinations were selected to represent gait in lat terrain, as well as possible inclinations found during daily activities, in accordance with NBR 9050/2004 from the Brazilian Association of Technical Standards (Associação…, 2004).
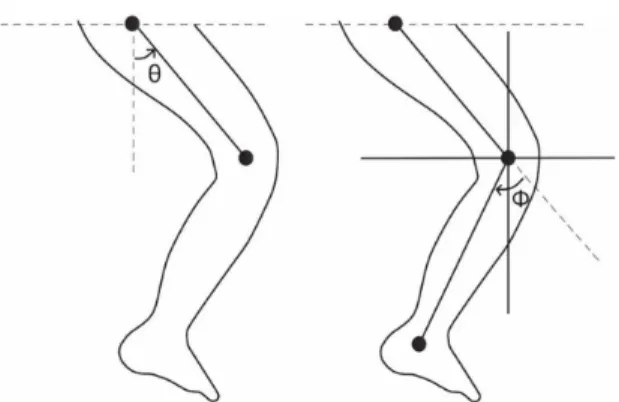
Movement was recorded in the sagittal plane, using a Microsoft Studio HD camera, at a resolution of 1280×720 pixels and frame rate of 30 frames/s. It was decided that only one camera would be used because the motor task under study is gait, the analysis using cyclograms are planar, and predominantly in the sagittal plane. This experimental setup is suficient to meet the study requirements, even after the limitations of the equipment used are considered. Camera calibration was done using a 19 cm marker positioned at the measurement plane, and automatically recognized as the reference by the capture program. With this setup, the resolution obtained was 0.5°. Joint angle measurements were obtained using the Coach6 software (CMA Science, Amsterdam, Netherlands), using a coordinate system with the origin at the knee joint, as shown in Figure 2.
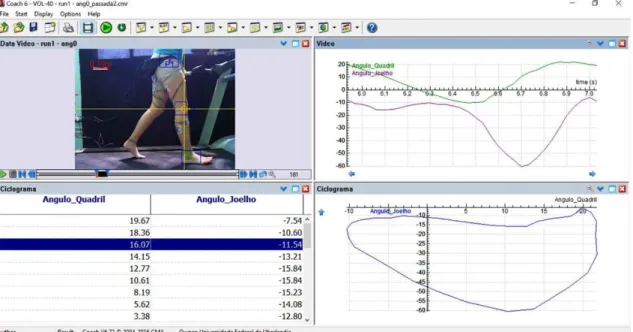
For each volunteer, eight strides with inclination and eight strides without inclination were selected for analysis. From the marker position information, the joint angles were determined during movement. Cyclograms were then obtained by plotting the angles of one joint in relation to the other, as seen in Figure 3.
The upper left corner of Figure 3 shows a video frame of the markers being tracked by the software (note the origin of the coordination system is at the knee joint,
as previously deined). The upper right corner shows a graph of the hip and knee angles plotted against time, for the given stride period. In the lower left corner, the hip and knee data are combined to create a cyclogram, which is graphically shown at the lower right corner.
These cyclograms were then used as learning patterns for ANNs, whose task was to predict the position of the lower limbs in the future.
The prediction system used in this method comprises a feed-forward neural network using Levenberg-Marquardt backpropagation training (Yu and Wilamowski, 2011). The initial weights were randomly deined, and the mean squared error (MSE) function was used as a performance evaluator to stop the network training.
Since a robotic rehabilitation process is progressive, it is expected that the patient starts with passive training (no control during the whole gait cycle), and as his condition improves, machine support will gradually be removed. This will stimulate the patient to produce maximum voluntary effort. The prediction system is expected to follow the same procedure; it would start by giving the patient very little control, increasing their control as the patient’s gait improves. The last stage would be when the machine support is minimal, after which the patient can walk unassisted. Several experiments were carried out to evaluate the ANN’s performance at each stage of the process, starting by predicting a small section of the cyclogram, and progressively increasing the size of the predicted track. As the results for the experiments were consistent, only the extreme conditions (very little control, and little machine support) will be detailed.
In the irst experiment (called experiment “A”), the neural network was fed with small cyclogram segments (4 samples) along with the height, weight and age of the volunteer, and the expected output was the future state of the joint angles (1 sample). The ANN coniguration was, therefore, 11 inputs and 2 outputs (Table 1).
This coniguration can be considered equivalent to a control therapy where the patient has little control of
Figure 1. Marker placing.
the gait (20% of the gait cycle), distributed throughout the whole cycle in small amounts.
In a later experiment (called experiment “B”), the ANN was fed with a segment corresponding to 25% of the cyclogram, along with the height, weight and age of the volunteer, so the remaining 75% of the cyclogram could be predicted. The ANN coniguration was 33 inputs and 90 outputs. (Table 2).
This coniguration can be considered equivalent to an advanced stage in the gait therapy, where the patient has great control over the cycle (75%), with little machine support.
In every experiment, 60% of the data set was used in ANN training, 20% for validation and 20% for performance tests. Afterwards, Pearson’s correlation coeficient (Hauke and Kossowski, 2011) and a matched-pairs t-test were used for validation of the predicted data.
Figure 3. Cyclogram determination using the Coach6 software.
Table 1. Artiicial Neural Network structure used in experiment “A”.
Input data Output data (angle)
Hip angle Knee angle Height Weight Age Hip Knee
X1 X2 X3 X4 Y1 Y2 Y3 Y4 H W A X5 Y5 X1 X2 X3 X4 Y1 Y2 Y3 Y4 H W A X5 Y5 X1 X2 X3 X4 Y1 Y2 Y3 Y4 H W A X5 Y5
… … … …
X1-n X2-n X3-n X4-n Y1-n Y2-n Y3-n Y4-n H W A X5-n Y5-n
Table 2. Artiicial Neural Network structure used in experiment “B”.
Input data Output data (angle)
Hip angle Knee angle Height Weight Age Hip Knee
X1 … X15 Y1 … Y15 H W A X16 … X60 Y16 … Y60 X1 … X15 Y1 … Y15 H W A X16 … X60 Y16 … Y60 X1 … X15 Y1 … Y15 H W A X16 … X60 Y16 … Y60
… … … …
Results
The measured data shows that the knee angle usually ranges from 4° (extended leg) to 67° (lexed leg) for the young group, and from 2° to 46° for the elderly group, while hip angles range from -8° to 26° for the young group and -18° to 20° for the elderly group. As each volunteer walked at his own comfort speed, gait cycles varied from 1.04 s to 1.58 s (faster for young groups). Since the camera was set to 30 frames/s, the number of data points of the recorded cyclograms varied from 31 to 47. To allow processing by the neural network, each cyclogram was resampled to 60 data points using fast Fourier transform (FFT) interpolation. For every row of data, the FFT was deined, and then 60 equally spaced points were determined from the function.
The ANN’s training times were lengthy, taking more than 20 hours on a computer with a Core I5 processor and 4 GB of RAM. However, it should be noted that the network’s training time has no relation to its prediction time, which only needs time for a single execution, ranging around a few microseconds.
After training, cyclogram segment data was used to predict the future state of the hip and knee angles. Results are presented as predicted joint angles (experiment “A”) and the predicted cyclogram (experiment “B”).
The ANN prediction for experiment “A” (one point predicted from 4 samples) was very accurate, with an average correlation coeficient ρ = 0.973. Figure 4
shows the predictive ability of this method for a random individual from each group.
For the experiment “B” (segments with 25% of the diagram) cyclogram prediction was very satisfactory, with an average ρ = 0.952. Figure 5 shows the predictive ability for this method for a random individual of each group.
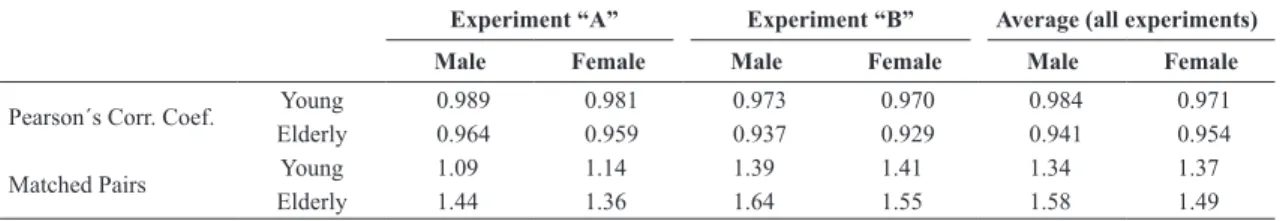
The normality of the variation between the predicted and expected results for the cyclogram was veriied using the Shapiro-Wilk test, with a signiicance level of 5%. Following this, Pearson’s correlation coeficient (PCC) and the matched-pairs t-test were used to check if the results had statistical signiicance. The PCC is deined as the normalized form of the covariance of the results (Wang, 2013). The matched-pairs t-test is determined by calculating the Euclidean distance between the real and the predicted points, and then applying the t-test; for this experiment, the null hypothesis considered was that the average distance between the points was greater than 2,121 (which corresponds to an angular error greater than 1.5°). Average values for the obtained results are shown in Table 3.
The PCC results indicate that the predicted data has a very strong correlation with the actual data. The matched-pairs t-test conirms the same result, showing that the difference between the datasets is not statistically signiicant (DF = 59, t(DF) = 2.00).
Figure 4. Hip-Knee cyclogram: “x” marks known values, “o” marks predicted values. Line shows actual recorded data. YM – Young male group;
Discussion
The purpose of this study was to assess the ability of an ANN to predict the angular position of the lower limbs during gait. It was also important for this study to ensure that the method was convenient and feasible. Therefore, a simple and accessible experimental setup was used. The results were considered satisfactory, as the predicted data showed a strong correlation with the expected data.
Considering the limitations of the hardware used in this study, the tracking performance was comparable to commercial 3D capture systems. The camera resolution, which is a key element for tracking precision, is similar to that of several 3D cameras. General commercial cameras have sensors ranging from 0.3 Megapixels (MP) to 1.3 MP (Advanced…, 2017; BTS…, 2017; Optitrack, 2017), while the camera used in this experiment has 0.9 MP. The main disadvantages of the one-camera setup in use are:
Table 3. Statistical analysis results.
Experiment “A” Experiment “B” Average (all experiments)
Male Female Male Female Male Female
Pearson´s Corr. Coef. ElderlyYoung 0.9890.964 0.9810.959 0.9730.937 0.9700.929 0.9840.941 0.9710.954
Matched Pairs ElderlyYoung 1.091.44 1.141.36 1.391.64 1.411.55 1.341.58 1.371.49
• Lower framerate (30fps vs 120+ fps from 3D cameras);
• Tracking is done in the visible light spectrum, meaning that the lighting conditions can affect the tracking performance.
A similar study was conducted by Kutilek et al. (Kutilek and Farkasova, 2011; Kutilek and Viteckova, 2012). This study, however, has several advantages: the data acquisition system is much simpler and more accessible than the one used by the above-mentioned authors (single consumer-grade camera and 2D acquisition system with simple calibration, vs multi infrared-cameras with 3D acquisition); the predictive system is simpler and needs less information to perform the prediction, which reduces the neural network complexity and computing time, both desirable aspects for this kind of application. The prediction strategy is in accordance with the studies mentioned above, and although there are similarities between them, result comparison was
Figure 5. Hip-Knee cyclogram: “x” marks known values, “o” marks predicted values Line shows actual recorded data. YM – Young male group;
not possible, since the cited authors did not present any metrics for their results.
Vries et al. used neural networks (Vries et al., 2016) to predict reaction forces in the glenohumeral joint. An important characteristic identiied by the author is that, for the analyzed variables, the ANN’s predictive power using a simple setup was similar to its predictive power using more complex setups. When comparing this study with Kutilek’s (Kutilek and Farkasova, 2011; Kutilek and Viteckova, 2012), these characteristics can also be identiied for the analyzed data.
In this study, a predictive method for lower limb movement was described, based on cyclic diagrams. This method could obtain the expected future conditions of the gait from previous information on the state of the lower limbs, with an average correlation index greater than 0.98. Although further studies are needed, several differences in methodology are believed to have helped achieving the presented accuracy, being the main ones:
• Self-selected speed: walking at his own pace, the volunteer´s cognitive load is reduced, making the gait on the treadmill more natural, and helping acquire more homogeneous data;
• Framerate: Since the camera has a lower framerate, cyclograms are built at a lower resolution, decreasing the complexity of the data that the ANN must learn.
The presented predictive model, which uses a simple experimental paradigm, generates data that can be used in robotic locomotion therapies, both as control signals and feedback elements, aiding in the rehabilitation process of patients with motor dysfunctions.
In this kind of therapy, healthy lower limb movement is supported by robotic devices, improving the rehabilitation process of patients with partial loss of walking ability (Fisher et al., 2011; Jezernik et al., 2003; Rudt et al., 2016; Saggini et al., 2016). Data can be used as expected values in a “patient-in-control” therapy, and as control elements for “personalized” gait therapy, since the data can relect the characteristic patterns of the gait according to the age and weight of the individual. The predicted states can also be compared to the actual position of the lower limbs, providing information to generate a score for the biofeedback system. The proposed method can also be modiied for use in different areas of artiicial intelligence, such as reinforced learning (Sutton and Barto, 1998).
The combined use of ANNs and simple and accessible hardware is of great value in clinical practice. The use of cyclograms facilitates gait analysis, since several gait characteristics are easily recognizable by geometric shape. The proposed predictive system, along with other locomotion therapies, constitute an interesting tool that
can be explored to increase rehabilitation possibilities, providing better quality of life to patients.
References
Advanced Realtime Tracking. Arttrack system [software]. Weilheim: ART; 2017. [cited 2017 May 5]. Available from: http://www.ar-tracking.com/products/tracking-systems/ arttrack-system/.
Associação Brasileira de Normas Técnicas. NBR 9050: acessibilidade a edificações, mobiliário, espaços e equipamentos urbanos. Rio de Janeiro: ABNT; 2004.
Barton J, Lees A. An application of neural networks for distinguishing gait patterns on the basis of hip-knee joint angle diagrams. Gait & Posture. 1997; 5(1):28-33. http://dx.doi. org/10.1016/S0966-6362(96)01070-3.
BTS Bioengineering. Smart-dx [internet]. Brooklyn: BTS; 2017. [cited 2017 May 5]. Available from: http://www. btsbioengineering.com/products/smart-dx/
Ellermeijer AL, Heck AJP. Walk like a physicist: an example of authentic education. In: Proceedings of the GIREP 2002 Conference [internet]; 2002 Aug 05-09; Lund, Sweden. Italy: GIREP; 2003 [cited 2017 May 5]. p. 1-13. Available from: https://www.researchgate.net/publication/228692663_Walk_ like_a_Physicist_An_Example_of_Authentic_Education Fisher S, Lucas L, Thrasher TA. Robot-assisted gait training for patients with hemiparesis due to stroke. Topics in Stroke Rehabilitation. 2011; 18(3):269-76. PMid:21642064.http:// dx.doi.org/10.1310/tsr1803-269.
Forczek W, Staszkiewicz R. An evaluation of symmetry in the lower limb joints during the able-bodied gait of women and men. Journal of Human Kinetics. 2012; 35(1):47-57. PMid:23486255.http://dx.doi.org/10.2478/v10078-012-0078-5. Goswami A. Kinematic quantification of gait symmetry based on bilateral cyclograms. In: Proceedings of the XIX Congress of the International Society of Biomechanics; 2003 July 6-11; Dunedin, New Zealand. Otago: University of Otago; 2003. p. 1-6. Grieve DW. Gait patterns and the speed of walking. Bio-Medical Engineering. 1968; 3(3):119-22.
Hauke J, Kossowski T. Comparison of values of Pearson’s and Spearman’s correlation coefficients on the same sets of data. Quaestiones Geographicae. 2011; 30(2):87-93.
Inman VT, Ralston HJ, Todd F. Human walking. Filadélfia: Williams & Wilkins; 1981.
Jezernik S, Colombo G, Keller T, Frueh H, Morari M. Robotic orthosis lokomat: a rehabilitation and research tool. Neuromodulation. 2003; 6(2):108-15. PMid:22150969.http:// dx.doi.org/10.1046/j.1525-1403.2003.03017.x.
Kendall FP, McCreary EK, Provance PG, Rodgers MM, Romani WA. Músculos: provas e funções com postura e dor. Barueri: Manole; 2007.
Kutilek P, Farkasova B. Prediction of lower extremities’ movement by angle-angle diagrams and neural networks. Acta of Bioengineering and Biomechanics. 2011; 13(2):57-65. PMid:22097908.
Kutilek P, Viteckova S. Prediction of lower extremity movement by cyclograms. Acta Polytechnica. 2012; 52(1):51-60. Optitrack. Natural point optitrack hardware [internet]. Corvallis. 2017. [cited 2017 May 5]. Available from http://optitrack. com/hardware
Perry J. Análise de marcha: marcha normal. São Paulo: Manole; 2004.
Rudt S, Moos M, Seppey S, Riener R, Marchal-Crespo L. Towards more efficient robotic gait training: a novel controller to modulate movement errors. In: Proceedings of the 6th IEEE International Conference on Biomedical Robotics and Biomechatronics (BioRob); 2016 June 26-29; Singapure. Singapure: IEEE; 2016.
Saggini R, Barassi G, Ancona E, Carmignano SM, Sablone A, Bellomo RG. Effect of robotic gait training versus sensory-motor systems in rehabilitation of gait and balance impairment and
fatigue in multiple sclerosis. Biophilia. 2016; 2(2):26. http:// dx.doi.org/10.14813/ibra.2016.26.
Semwal VB, Raj M, Nandi GC. Biometric gait identification based on a multilayer perceptron. Robotics and Autonomous Systems. 2015; 65:65-75. http://dx.doi.org/10.1016/j. robot.2014.11.010.
Sharma DG, Yusuf R, Tanev I, Shimohara K. Human gait analysis based on biological evolutionary computing. Artificial Life and Robotics. 2016; 21(2):188-94. http://dx.doi.org/10.1007/ s10015-016-0267-8.
Sutton RS, Barto G. Reinforcement learning: an Introduction. Cambridge: MIT Press; 1998.
Vries WHK, Veeger HEJ, Baten CTM, Helm FCT. Can shoulder joint reaction forces be estimated by neural networks? Journal of Biomechanics. 2016; 49(1):73-9. PMid:26654109.http:// dx.doi.org/10.1016/j.jbiomech.2015.11.019.
Wang J. Pearson correlation coefficient: encyclopedia of systems biology. New York: Springer; 2013.