DOI: http://dx.doi.org/10.1590/2446-4740.01617 Volume 33, Number 3, p. 218-228, 2017
Introduction
Elastographic methods based on shear wave propagation and described in details by Dewall (2013) and Urban et al. (2012) have been applied, in the last two decades, to investigate the mechanical properties of biological tissues, such as liver (Chen et al., 2013; Zhang et al., 2008a; Zhu et al., 2014), whole blood and/or blood clot (Gennisson et al., 2006; Huang et al., 2013), breast (Garra et al., 1997; Meng et al., 2011) and prostate (Sumura et al., 2007; Zhang et al., 2008b). Some of these investigations were designed to determine the
correspondence between the mechanical properties of normal and diseased organs and consequently to establish elastographic methods as a potential diagnostic tool.
The propagation of the shear wave produces microvibrations in the medium and the vibration waveform can be determined employing a probing ultrasonic pulse-echo system and processing a sequence of radiofrequency (RF) echo signals (Catheline et al., 2003; Chen et al., 2013; Mitri et al., 2011; Urban et al., 2009; Zheng et al., 2007). In this context, the processing techniques commonly used with the sequence of RF echo signals are: cross-spectral analysis (Hasegawa and Kanai, 2006), cross-correlation (Céspedes et al., 1995; Ophir et al., 1991) and quadrature demodulation (Zheng and Greenleaf, 1999). Once the vibration waveform is detected, then the shear wave properties such as phase velocity and attenuation coeficient can be measured and used in calculating the medium viscoelastic parameters such as shear modulus and viscosity.
A previous study by Costa-Júnior and Machado (2011) presented the development of an ultrasonic method, named UDmV, to detect microvibrations of a medium and the current investigation applies the UDmV method in determining the vibrations caused by a shear wave
Ultrasonic method of microvibration detection: part II - additional
processing method and applications
José Francisco Silva Costa Júnior
1*, João Carlos Machado
11 Biomedical Engineering Program, Instituto Alberto Luiz Coimbra de Pós-Graduação e Pesquisa de Engenharia, Federal
University of Rio de Janeiro, Rio de Janeiro, RJ, Brazil.
Abstract Introduction: In the last 28 years, the scientiic community has been using elastography to evaluate the mechanical
properties of biological tissue. The aim of this work was the optimization of the UDmV method, presented in Part I of the series, by means of modifying the technique employed to generate the reference sine and cosine functions, used for phase-quadrature demodulation, and determining how this modiication improved the performance of the method. Additionally, the UDmV was employed to characterize the acoustic and mechanical properties of a 7% gelatin phantom. Methods: A focused transducer, TF, with a nominal frequency of 2.25 MHz, was used to induce
the shear waves, with frequency of 97.644 Hz. Then, the modiied UDmV method was used to extract the phase and quadrature components from ultrasonic RF echo-signals collected from four positions along the propagation path of the shear wave, which allowed the investigation of the medium vibration caused by wave propagation. The phase velocity, cs, and attenuation, as, of the phantom were measured and employed in the calculation of shear modulus,
μ, and viscosity, η. Results: The computational simulation demonstrated that the modiication in UDmV method
resulted in more accurate and precise estimates of the initial phases of the reference sinusoidal functions used for phase-quadrature demodulation. The values for cs and μ of 1.31 ± 0.01 m·s-1 and 1.66 ± 0.01 kPa, respectively, are
very close to the values found in the literature (1.32 m·s-1 and 1.61 kPa) for the same material. Conclusion: The UDmV method allowed estimating of the acoustic and viscoelastic parameters of phantom.
Keywords Ultrasound, Shear wave, Shear modulus, Viscosity, UDmV, Kalman Filter.
This is an Open Access article distributed under the terms of the Creative Commons Attribution License, which permits unrestricted use, distribution, and reproduction in any medium, provided the original work is properly cited.
How to cite this article: Costa-Júnior JFS, Machado JC. Ultrasonic method of microvibration detection: part II - additional processing method and applications. Res Biomed Eng. 2017; 33(3):218-228. DOI: 10.1590/2446-4740.01617.
*Corresponding author: Biomedical Engineering Program – PEB, Instituto Alberto Luiz Coimbra de Pós-Graduação e Pesquisa de Engenharia – COPPE, Federal University of Rio de Janeiro – UFRJ, Av. Horácio Macedo, 2030, Centro de Tecnologia, Bloco H, CEP 21941-914, Rio de Janeiro, RJ, Brazil. E-mail: [email protected]
propagating in a 7% gelatin tissue mimicking phantom. A method proposed by Zheng and Greenleaf (1999) was used to process the in-phase and quadrature components of a sequence of RF echo signals from the phantom and to yield the vibration waveform due to the propagation of a shear wave induced in the phantom. The values for the shear phase velocity and attenuation coeficient, obtained from the detected vibration waveform, were used following a procedure similar to the transient elastography (TE) technique (Catheline et al., 2004), in order to estimate the phantom shear modulus and viscosity, at 24.4 ± 0.2 °C and considering the propagation of shear waves with different amplitudes. Furthermore, the current work added another two processing techniques to determine the initial phase of the reference sine and cosine signals used for phase-quadrature demodulation and compared their results with those obtained by the previous technique described previously in Costa-Júnior and Machado (2011).
Theoretical foundations
Considering a continuous shear wave propagating in a homogeneous, isotropic and viscoelastic medium represented by the Voigt model, then the shear wave phase velocity, cs, and the attenuation coeficient, as,
are given by (Yamakoshi et al., 1990):
2 2 2
2 2 2
2( )
( )
m + ω h =
ρ m + m + ω h
S s
S
c (1)
2 2 2 2
2 2 2
( )
2( )
ρω m + ω h − m a =
m + ω h
S S
s
S
, (2)
where m, h and ρ correspond to the medium shear modulus, shear viscosity and density, respectively, and ωS represents the shear wave angular frequency, with
2
ω = πS fS for fS as the shear wave frequency.
Solving (1) and (2) for m and h comes:
(
)
2 2 2 2 2
2
2 2 2
( )
ω ρ ω − a m =
ω + a
S S S S S S S S
c c
c (3)
(
)
2 3
2
2 2 2
2ω ρ a h =
ω + a
S S S S S S
c
c (4)
Therefore, according to (3) and (4) then the medium viscoelastic parameters m and h can be determined once the shear wave velocity and attenuation coeficient are measured. One way to measure cs and as consists in
monitoring the changes in phase and amplitude of the shear wave, along the propagation path, by means of an ultrasonic probing system operating in pulse-echo mode
(Chen et al., 2004). In the method proposed by Chen et al. (2004), the shear wave is induced by the action of an acoustic radiation force generated at the focal point of transducer TF and the wave phases (ϕr0 and ϕr0+∆r) and
amplitudes (
0
r
D and
0+∆
r r
D ) corresponding to locations r0 and r0+ ∆r, respectively, along the propagating medium are determined after processing a sequence of RF echo signals returning from locations in the medium traversed by the shear wave and collected by the transducer TP of
an ultrasonic probing pulse-echo system.
According to Chen et al. (2004), the shear wave generated as described above has a cylindrical wave front and at large distances (over one-tenth of the shear wavelength) from the focus of TF the phase delay
of cylindrical shear wave changes linearly with the propagated distance. Under such circumstances, the shear wave phase velocity, at a given angular frequency ωS, can be estimated by;
1 −
ω ∆ ϕ
= = ω
∆ϕ
S S S S S r d c dr , (5)
where ∆r and ∆ϕS represent the distance and shear
wave phase increment between two locations along the propagation path of the shear wave, respectively.
Additionally, the attenuation coeficient of a cylindrical wave, as, is estimated according to:
0
0
0
0
1
ln + ∆ +∆ a = − ⋅
∆ r r s r D r r
r r D
, (6)
where r0 is a position along the propagation path of the shear wave,
0
r
D and
0+∆
r r
D are the shear wave amplitudes at locations r0 and r0+ ∆r, respectively.
The estimation of cs and as based on the method
proposed by Chen et al. (2004) requires determining the medium vibration waveform related to different locations along the propagation path of the shear wave. In this sense, then according to Zheng and Greenleaf (1999), the medium vibration velocity waveform, v, obtained at discrete times mT separated by the pulse repetition period, T, of the ultrasonic pulse-echo probing system is calculated as follows:
( ) ( ) 1 11 1{{ }}
1 1 1
( 1, ) ( , ) ( , ) ( 1, ) tan
4 ( , ) ( 1, ) ( , ) ( 1, )
+ − = + = − + − = + = + − + ∑ ∑ =
π ∑ ∑ + + +
m K N
k m n
m K N
k m n
i
I k n Q k n I k n Q k n c
v m
Tf m I k n I k n Q k n Q k n , (7)
where c is the acoustic wave velocity of the longitudinal wave emitted by the transducer TP, f0 is the center frequency of the pulse emitted by TP, I k n( , ) and Q k n( , ) are in phase
and quadrature components of the complex envelope of RF echoes signals collected by TP. The sub-indexes
1, 2, ..., =
echo signal and the nth sample of one received echo
signal, respectively.
Additionally, f mi( ) is the mean instantaneous
frequency, which is determined by
( ) 1 1 11{{ }}
0 1
1 1
( , 1) ( , ) ( , ) ( , 1) 1
tan
2 ( , ) ( , 1) ( , ) ( , 1)
+ −
= + =
−
+ −
= + =
+ − +
∑ ∑
= +
π ∑ ∑ + + +
m K N
k m n
i m K N
k m n
I k n Q k n I k n Q k n f m f
T I k n I k n Q k n Q k n , (8)
Equations 7 and 8 are valid for m=0, 1,...,M−K, with
M representing the total amount of received echoes. As demonstrated by Costa-Júnior and Machado (2011), the UDmV method allows determining the in phase and quadrature components of the complex envelopes of RF echo signals. Furthermore, applying the Kalman ilter to the velocity vibration waveform given in (7) enables to estimate the vibration phases,
0
ϕr and ϕr0+∆r, and amplitudes, Dr0 and Dr0+∆r.
Methods
Modiication in UDmV method
Costa-Júnior and Machado (2011) estimated the frequency of a sinusoidal signal employing the Kalman ilter repeatedly over the signal with the input frequency value of the ilter spanning over a frequency bandwidth containing the frequency of the signal. In this case, for each input frequency value, the amplitude of the signal estimated by Kalman ilter was stored and the frequency corresponding to the highest amplitude value of the estimated signal was considered to be the
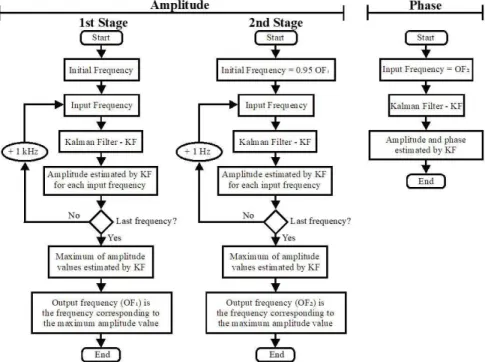
signal frequency. This approach was employed in the current study to estimate the frequency of the signal that excited the transducer, so two frequency spannings were implemented, the irst over a bandwidth corresponding to ± 10% of the nominal frequency, with steps of 1 kHz, and the second over a bandwidth of ± 5% of the frequency estimated in the previous stage, but in steps of 1 Hz. Knowing the frequency of the signal used to excite the transducer, then its initial phase can become estimated using the Kalman ilter again (Zheng et al., 2007). A low chart, in Figure 1, summarizes the process, named here KFAP, used to estimate the frequency and the initial phase of the transducer excitation signal based on the Kalman iltering.
Another technique proposed in this current investigation to estimate the frequency of the transducer excitation signal, and named KFMS, was also implemented. It consists in performing the two spannings in frequency, as done with the KFAP technique. However, the estimated frequency is the one that resulted in the minimum mean square error between the input signal and the sinusoidal signal estimated by the Kalman ilter. Once that frequency of the excitation signal was determined, then the signal initial phase was estimated employing the Kalman ilter again, as done for the KFAP technique.
The approaches KFAP and KFMS implemented in current work and incorporated into the UDmV method, presented by Costa-Júnior and Machado (2011), provided the modiied versions of the UDmV method,
named UDmVAP and UDmVMS, respectively. In order to determine the performances of KFAP, KFMS and the previous approach used UDmV in estimating the initial phase of the transducer excitation signal, two metrics commonly employed in the literature, namely the bias and the jitter (Urban et al., 2008; Urban and Greenleaf, 2008) were considered. The bias, ϕB, is the estimated
phase average error and the jitter, ϕJ, is the standard
deviation of the error for the estimated phase. These parameters are calculated as follows:
1
1
, = ϕ = N∑epϕl
B error l ep
N (9)
2 1
1
( ) ,
=
ϕ = N∑ep ϕl − ϕ
J error B l
ep
N (10)
where Nep represents the number of estimated phases and
ϕl = ϕ − ϕ
error l nom, with ϕnom a nominal phase and ϕl one of
the Nep estimated phases. The smaller ϕB and ϕJ are, the
more accurate and precise will be the value determined for the initial phase.
Computational simulations were accomplished using the software Matlab (R2011a; Mathworks, Natick, MA) to compare the performances of the three approaches based on the estimated phase bias and jitter. Then, 200 sinusoidal signals were computer simulated with center frequency of 5 MHz, sampling frequency of 50 MHz and 1 µs duration, for different signal-to-noise ratio (SNR), keeping the initial phase of 120°, and for different initial phases (keeping an SNR
of 30 dB). The initial phase for each coniguration of the simulated signals was determined based on KFAP, KFMS and the previous approach used UDmV and then ϕB and ϕJ were determined.
Experimental procedure
The experimental setup illustrated in Figure 2 was used to generate a shear wave in the phantom and also to detect the micro-vibrations caused in the phantom due to the propagation of the shear wave.
The longitudinal wave emitted by TF (NDT-V395;
Olympus Scientiic Solutions Americas Inc., Waltham, MA) produced an acoustic radiation force at the transducer focal point, which induced a vibration of the plastic sphere, and, consequently, it generated the propagation of shear wave. The spherical focused transducer TF has
38 mm in diameter, focal distance of 6.71 cm and a center frequency of 2.104 MHz. The excitation signal of TF was
generated by the AFG 3251 function generator (Tektronix, Beaverton, OR), which was, initially, conigured to output a burst signal with central frequency of 2.104 MHz, pulse repetition frequency (PRF) of 97.644 Hz, amplitude of 920 mVPP (peak-to-peak) and 10,000 cycles. This burst signal fed the power ampliier (325LA; E & I, Rochester, NY), with a gain of 50 dB, which output signal, with an amplitude of 170 Vpp (peak-to-peak), was used to excite
TF. The ultrasonic detection system (UDS), described in Costa-Júnior et al. (2017) was set to excite the transducer
TP (NDT-V326; Olympus Scientiic Solutions Americas
Inc., Waltham, MA) with a burst signal having the frequency of 4.89 MHz, 5 cycles and PRF of 4.8807 kHz.
Figure 2. Experimental setup used to generate and detect shear wave propagation in 7% gelatin phantom, using an ultrasonic pulse-echo system operating at 4.89 MHz. The excitation signals of TF and TP are synchronized. The echo-signals from the particles, collected by TP from four regions,
The RF echo signals received by TP were displayed and collected by a digital oscilloscope (DPO3032; Tektronix, Beaverton, OR) operating with a sampling rate of 50 MHz and 5 Mbytes of memory. Data stored in oscilloscope memory were transferred via USB interface to a netbook (Intel AtomTM, CPU N270, 1,60 GHz, 1 GB de RAM,
Microsoft Windows XP Home Edition), where they were stored, using a communications program developed in LabVIEW (Versão 7.1; National Instruments, Austin,
Texas). The temperature of the phantom was kept at 24.4 ± 0.2 °C using an ultra-thermostatic bath (524-2D; Nova Ética, São Paulo, SP). The sensor junction of a K-type thermocouple, connected to a digital thermometer (MTH-1362; Minipa, São Paulo, SP), was imbedded in the phantom for monitoring the temperature.
The phantom used in the experiment was made with pork skin gelatin (300 Sigma Bloom; Sigma-Aldrich, St. Louis, MO), in a concentration of 7% of the volume of deionized water, and plastic particles, to act as scatterers, with 1.2 mm in diameter and with a concentration of 5% of the volume. Additionally, another plastic sphere, with a diameter of 3.92 ± 0.07 mm and density of 2575.93 ± 32.23 kg·m-3, was embedded in the central
region of the phantom, at a region free of particles (volumetric central portion of the phantom without the plastic particles with the diameter of 1.2 mm), to enable the focal alignment of TF and TP. A cylindrical container, with 12.82 cm in diameter and 4 cm high, was used to hold the phantom. The density value for 7% gelatin phantom was considered to be 1000 kg·m-3,
in accordance to the typical density value for gelatin phantoms used in previous works (Catheline et al., 2003; Costa-Júnior et al. (2017); Zhu et al., 2015).
After collecting the RF ultrasonic echo-signal with
TP in r0 = 14.5 mm from the focal point of TF then the transducer moved to ri= + ∆ = + ⋅ −r0 r r0 4 (i 1) mm, and a new RF ultrasonic echo-signal was acquired with TP
in ri, where i = 2, 3 and 4. Synchronization between the excitation signals of TP and TF was performed by the programmable frequency divider circuit (PFDC), and to this end, a synchronism signal coming from the command circuit of UDS system was used. In addition, the output signal of PFDC was also used to synchronize the acquisition in oscilloscope and to generate the excitation signal of TF. The PFDC is formed by two ICs CD4017BE (counter/decoder Johnson) and three CIs 74LS151 (3-bit multiplexer). The multiplexers can be set through electromechanical switches that connect the IC input to +5V or GND, resulting in divisions of the input signal by 4, 5, 10 and paired combinations of these values, i.e., by the product of two of the three mentioned values. This circuit input is fed with the
synchronization signal of 4.8807 kHz generated by the command circuit.
Two positioning systems, each one consisting of three manual linear stages (M-443, Newport Corporation, Irvine, Ca) and an angle bracket (360-90, Newport Corporation, Irvine, Ca), were used to adjust the position of the transducers. TF was focused on the plastic sphere (3.92 mm diameter) and TP was initially focused on the particles (1.2 mm diameter) and 8.5 mm from the TF
focus. In the irst stage, with the system responsible for producing acoustic radiation force (called here ARFS) disabled, the irst acquisition of RF ultrasonic signal was performed. Then phase-quadrature demodulation was applied and the detected in phase and quadrature components used in (7) to yield the system noise term, whose variance was used in the Kalman ilter. In the next stage, the ARFS was enabled and seven acquisitions of a sequence of RF ultrasonic signals took effect for each one of the four positions of TP separated by 4 mm. Once completed the acquisitions corresponding to all four positions, the amplitude of the signal exciting TF
was lowered to 140 Vpp and a new data collection was carried on. This process repeated once again for and excitation signal amplitude of 110 Vpp.
After acquiring all the RF echo-signals with a sampling frequency of 50 MHz, these signals were resampled at 500 MHz employing the ‘resample.m’ function of Matlab. Additionally, the RF ultrasonic signals were time-gated with a Hanning window having a full width half maximum duration of approximately 1 μs, which corresponds to a range gate of 0.75 mm. The low-pass filter cutoff frequency used in phase-quadrature demodulation was 1 MHz.
The acquired RF echo-signals were phase-quadrature demodulated, based on the the UDmV method as presented by Costa-Júnior and Machado (2011) or modiied versions UDmVAP and UDmVMS, and corresponding in phase and quadrature components applied in (7) to extract the motion waveform. Thereafter the Kalman ilter was employed to calculate the phase and amplitude of all motion waveforms, which were used in (5) and (6) to estimate the shear wave phase velocity and the attenuation coeficient, respectively.
Measurements of phase and amplitude of the vibration waveform at the four positions along the propagation path of the shear wave were repeated seven times. For each experimental run, then a linear it to the phase values as a function of distance was implemented and the angular coeficient of the straight line was used to calculate the phase velocity in accordance to Equation 5. Similarly, a linear it to g( )∆ = −r ln
{
(r0+ ∆r) r0⋅(
Dr0+∆r Dr0)
}
asStatistical analysis
The statistical analyses were performed with SPSS software (version 20.0; SPSS Inc., Chicago, USA). The results for all statistical tests were considered signiicant for p-value <0.05. The purpose of the statistical study was to detect signiicant difference between the phase velocity attenuation, shear modulus or shear viscosity values obtained using UDmVAP, UDmVMS and UDmV techniques, for each EA of TF. In addition, the statistical analysis was performed in order to investigate the inluence of the amplitude of the excitation signal of TF, which is related to the magnitude of acoustic radiation force, on the estimates of shear modulus and viscosity, for UDmVMS method.
Shapiro-Wilk test was used to verify the normality of the distribution and the Levene’s test was applied to assess the equality of variances for cs values obtained with the phases estimated by UDmVAP, UDmVMS and UDmV techniques in all excitation conditions.
When the distributions were normal and the groups presented equality of variances, one-way analysis of variance (ANOVA) was employed. Multiple comparisons (post hoc) tests were performed applying Tukey test when the ANOVA results were statistically signiicant. On the other hand, when one of these condition has been not satisied, the nonparametric Kruskal-Wallis test followed by Dunn’s multiple comparison test were utilized to determine which measurements are statistically different.
In addition, these statistical tests were also employed to assess the measured values of μ and η of the gelatin phantom, obtained based on the waveform vibration extracted applying the modiied UDmV method to the
RF ultrasonic echo-signals acquired under three different excitation conditions of the transducer TF.
Results
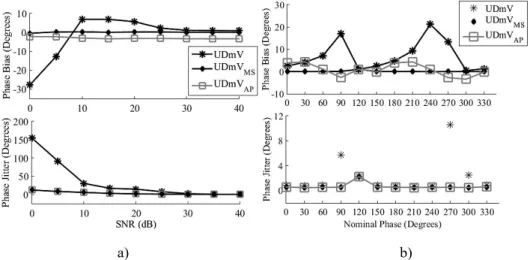
The phase bias and jitter obtained from the phase values estimated with UDmV (Costa and Machado, 2011), UDmVAP and UDmVMS approaches, as a function of SNR and the initial phase, are depicted in Figure 3a and 3b, respectively.
Figure 4 presents the vibration velocity waveform signals of the medium and obtained based on the UDmVMS method applied to the RF signals collected at four positions equally spaced, considering an amplitude of 170 Vpp (peak-to-peak) for the excitation of TF.
Figure 5a illustrates the mean and standard deviation of the shear wave phase increment obtained at four positions along the shear wave propagation path and 5b the function g r( )i = −ln
{
(r ri 0)⋅(
Dri Dr0)
}
, with( )
0 4 1
= + ⋅ −
i
r r i mm and i = 0, 1, 2 and 3. Transducer TF
was excited by a signal with the frequency of 97.644 Hz and amplitudes of 170, 140 and 110 VPP.
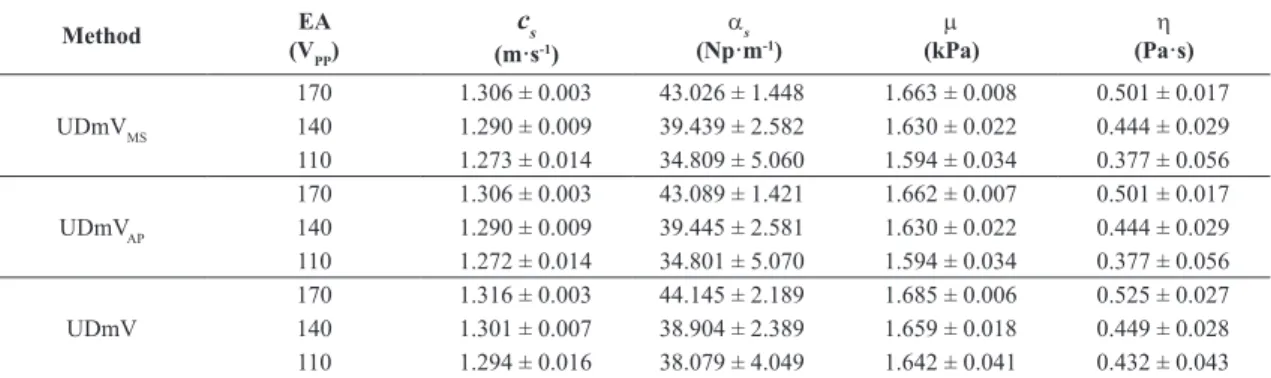
The shear wave phase velocity and attenuation coeficient values were obtained and substituted in (3) and (4) to estimate the gelatin phantom shear modulus and viscosity. Table 1 contains the average (std) values of the phase velocity, attenuation coeficient, shear modulus and viscosity obtained based on the propagation of the 97.644 Hz cylindrical shear wave on the phantom with transducer TF excited by a signal with amplitudes of 170, 140 and 110 VPP.
The Shapiro-Wilk test indicated that phase velocity, attenuation, shear modulus and viscosity values presented normal distribution, regardless the excitation conditions of transducer TF. Except for the u1 values
obtained with the DmUV technique as a function of EA1. Additionally, Levene’s test showed that the variances of cs, a and h groups were not signiicantly different. The m groups obtained in function of EA2
and EA3 also did not present signiicant difference. So, ANOVA was used and it indicated that cs and m (EA2 and EA3) values obtained from phase estimates based on UDmVAP, UDmVMS and UDmV approaches presented signiicant difference. Therefore the multiple comparisons between means of cs or m were performed, applying Tukey’s HSD (honest signiicant difference)
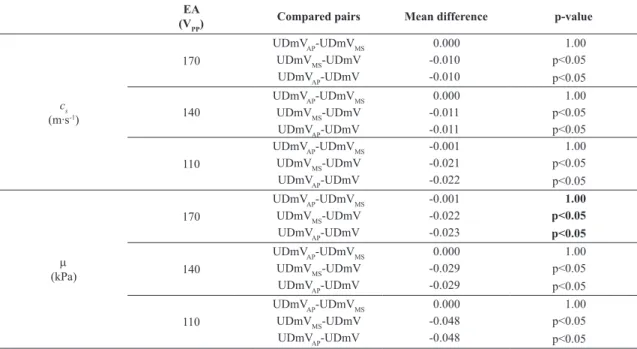
post hoc test. The ANOVA showed that a and h values were not signiicantly different, regardless of EA employed. On the other hand, Kruskal-Wallis test was used to compare the shear modulus values estimated in function of EA1 for TF, and indicated that there were signiicant differences between m values. Thus, the Dunn post hoc test was used to determine which pairwise measurements were statistically different. Table 2 presents the difference between the mean values of cs (m·s-1) or m (kPa) for pair-combinations
of the approaches used to estimate the phase of the shear wave and the p-value obtained with Tukey or Dunn (bold) multiple comparison test.
Table 3 presents the difference between the average
μ or h values of the pair-combinations of EA for
UDmVMS method and the result of the post hoc multiple comparisons test, which is represented by the statistical test and p-value.
Figure 4. Signals representing the velocity vibration waveform of the medium due to the propagation of shear waves with a frequency of 97.644 Hz, considering the RF echo-signals collected by TP at four different positions (14.5, 18.5, 22.5 and 26.5 mm) and amplitude of 170 VPP for the excitation of TF.
Figure 5. Mean and standard deviation: a) shear wave phase increment and b) ( )
{
( )(
)
}
00
ln
= − ⋅ i
i i r r
g r r r D D , for r0=14.5 mm,
( )
4 1
= ⋅ −
i
r i mm, with i = 0, 1, 2 and 3, and
i
r
D corresponding to shear wave amplitude at the i-th position along the shear wave propagation path inside the gelatin phantom. The data correspond to the TF excited by a signal with the frequency of 97.644 Hz.
Table 1. Estimated phase velocity, attenuation coeficient, shear modulus and viscosity (mean ± 1 std) for the 7% gelatin phantom, with the TF
excited by a signal at a frequency of 97.644 Hz and with excitation conditions (EA) of 170, 140 and 110 VPP.
Method EA
(VPP)
cs
(m·s-1)
as (Np·m-1)
m (kPa)
h (Pa·s)
UDmVMS
170 1.306 ± 0.003 43.026 ± 1.448 1.663 ± 0.008 0.501 ± 0.017 140 1.290 ± 0.009 39.439 ± 2.582 1.630 ± 0.022 0.444 ± 0.029 110 1.273 ± 0.014 34.809 ± 5.060 1.594 ± 0.034 0.377 ± 0.056
UDmVAP
170 1.306 ± 0.003 43.089 ± 1.421 1.662 ± 0.007 0.501 ± 0.017 140 1.290 ± 0.009 39.445 ± 2.581 1.630 ± 0.022 0.444 ± 0.029 110 1.272 ± 0.014 34.801 ± 5.070 1.594 ± 0.034 0.377 ± 0.056
UDmV
Discussion
The methods UDmVAP, UDmVMS and UDmV used to estimate the shear wave phase presented good accuracy (values below 1.03°) and precision (values below 2.23°) with SNR values above 30 dB. However, the method implemented in this investigation (UDmVMS) to estimate the phase presented the lowest values of phase bias and jitter, regardless the SNR. In addition, the highest values of phase bias magnitude and jitter were 0.53 and 12.14°, respectively, with a SNR of 0 dB. On the other hand, the UDmVAP and UDmVMS techniques yielded similar precision when the SNR is above 10 dB, even though UDmVAP technique presented a phase bias of approximately -2°, independent of SNR.
When the computational simulation was employed to evaluate the accuracy and precision of methods used to estimate the phase, corresponding to the nominal initial phase of the simulated signal, the UDmVAP and UDmVMS techniques presented phase jitter values
less than 2.23°, with the largest value obtained for a nominal phase of 120°. However, disregarding this values then the phase jitter becomes lower than 0.6° for both techniques. The overall phase bias of UDmVAP and UDmVMS methods is less than 4.5°. Nevertheless, the highest value of phase bias estimated with UDmVMS was 1.03°. Thus, the modiication made to the UDmV method allowed the estimation of the initial phase of TP
excitation signal with improved accuracy and precision. As in the previous study by Costa-Júnior and Machado (2011), the UDmV method was employed to detect microvibrations, but this time the microvibrations corresponded to the propagation of the shear wave in a gelatin phantom. In the worst case, when the amplitude of the excitation signal of transducer TF was 170 VPP the amplitude vibration (see Figure 4) was on the same order of magnitude of the values (< 10 µm) for the shear wave propagating in biological tissue and reported in literature (Amador et al., 2013; Bercoff et al., 2004; Huang et al., 2013). The amplitude of the vibration waveform at
Table 2. Difference between the mean values of cs (m·s-1) or m (kPa) for pairs of compared techniques used to estimate the initial phase, of reference
sinusoidal signals used for phase-quadrature demodulation, and the p-value of the multiple comparison test of Tukey and Dunn (bold).
EA (VPP)
Compared pairs Mean difference p-value
cs
(m·s-1)
170
UDmVAP-UDmVMS 0.000 1.00
UDmVMS-UDmV -0.010 p<0.05
UDmVAP-UDmV -0.010 p<0.05
140
UDmVAP-UDmVMS 0.000 1.00
UDmVMS-UDmV -0.011 p<0.05
UDmVAP-UDmV -0.011 p<0.05
110
UDmVAP-UDmVMS -0.001 1.00
UDmVMS-UDmV -0.021 p<0.05
UDmVAP-UDmV -0.022 p<0.05
m
(kPa)
170
UDmVAP-UDmVMS -0.001 1.00
UDmVMS-UDmV -0.022 p<0.05
UDmVAP-UDmV -0.023 p<0.05
140
UDmVAP-UDmVMS 0.000 1.00
UDmVMS-UDmV -0.029 p<0.05
UDmVAP-UDmV -0.029 p<0.05
110
UDmVAP-UDmVMS 0.000 1.00
UDmVMS-UDmV -0.048 p<0.05
UDmVAP-UDmV -0.048 p<0.05
Table 3. Difference between the mean values of m or h for compared-pairs of the excitation amplitude of TF for UDmVMS method and the results of the multiple comparison test (p-value).
Compared pairs [EA (VPP)] Mean difference p-value
m
(Pa)
170-140 32.71 0.06
170-110 68.80 p<0.05
140-110 36.09 0.47
h
(Pa·s)
170-140 0.06 0.06
170-110 0.12 p<0.05
position 14.5 mm (r0), with an EA of 170 VPP for TF, was 6.99 ± 0.11 µm, obtained by D=velocity amplitude /ωS.
Furthermore, it is possible to observe in Figure 4 a reduction in the amplitude of the vibration velocity, resulting in a decreased in signal to noise ratio, and changing of the initial phase of vibration as a function of the increasing distances between TF and TP.
Shear wave phase velocity, shear modulus and viscosity of pig skin gelatin phantom, at a concentration of 7%, measured based on shear wave propagation are 1.32 m·s-1, 1.61 kPa and 0.85 Pa·s (Amador et al., 2011),
respectively, at a temperature undisclosed by the authors. Additionally, the viscoelasticity of the same material, at a temperature between 24.5 and 25.5 °C, estimated by Huang et al. (2013) comprehends shear modulus values of 1.59 ± 0.03 and 1.63 ± 0.07 kPa, and viscosity values of 0.86 ± 0.05 and 0.32 ± 0.02 Pa·s, determined by means of shear-wave dispersion ultrasound vibrometry (SDUV) and embedded-sphere method (ESM), respectively. Furthermore, the shear wave velocity was about 1.29 m·s-1
for shear wave frequency of 100 Hz. The results obtained in the present research approach for phase velocity and shear modulus of a 7% gelatin phantom at 24.4 ± 0.2 °C, using the EA of 170 VPP for TF, UDmVMS method and 97.644 Hz shear wave frequency are approximately 1.31 ± 0.00 m·s-1 and 1.66 ± 0.01 kPa, which are very
close to the values found in literature (the difference between the µ value obtained in the present work and the one reported by Huang et al. (2013), using either SDUV or ESM methods, is less than 100 Pa). On the other hand, the viscosity estimated as 0.50 ± 0.02 Pa·s differs in 41.86 and 56.25% from the values obtained by Huang et al. (2013) based on SDUV and ESM methods, respectively. Another interesting fact is that the viscosity of a 12% gelatin phantom was estimated
as 0.32 Pa·s by Chen et al. (2004), using the SDUV
method, which is lower than the viscosity value obtained with this present study. Despite of this, the report of Chen et al. (2004) did not mention the temperature of the phantom. Furthermore, in the study performed by Zhu et al., (2015), the viscosity value (4.90 ± 0.20 Pa·s) obtained using dynamic mechanical analysis (DMA) method was 58.98% greater than that obtained by SDUV (2.89 ± 0.14 Pa·s) and these researchers mentioned that this difference may be due to the frequency used in the DMA method. Our present investigation used shear wave at the frequency of 97.644 Hz and therefore, this may be the reason for the difference in viscosity value obtained in the present work when compared with the values published in the literature. Henceforth, further studies should investigate the shear viscosity measurements in ultrasound elastography.
The gelatin phantom employed in the present work was prepared with ultrasound scatterers having a diameter
(1.2 mm) larger than those (approximately 50 μm) of the particles generally used for ultrasound tissue-mimicking phantoms. Consequently, the larger scatterers resulted in RF-echo signals with amplitudes larger than those that would exist if smaller scatterers were considered in the phantom preparation and this effect improved the SNR of the UDS echo signal. Although using larger scatterers could present a limitation to the experimental results of the present work, the results for the shear modulus and viscosity of the gelatin phantom are closely related to the results reported in the literature.
The theoretical foundations presented in this paper are based on the propagation of shear wave in an ininite medium, which would eliminate the existence of standing waves. On the other hand, the propagation medium (phantom) used is inite (diameter = 12.82 cm and height = 4 cm), with the plastic sphere positioned in the central region of the phantom. Considering the location distant r0+12mm from the phantom center, where the vibration is detected with the lowest amplitude, than the round-trip distance between this location and the phantom wall is 7.52 cm. Therefore, in order to have the effects of standing wave at this location, the wave passing and propagating towards the phantom wall would have to interact with the wave relected from the phantom wall, which will be approximately attenuated by 28 dB. If location r0 is considered, then the wave relected from
the phantom wall will be approximately attenuated by 37 dB. With these attenuations, the interaction between the waves travelling in opposite directions would be minimum and therefore the assumption of standing waves can be neglected.
The results from the computational simulation indicated that the UDmV technique should present the worst results in estimating the shear wave velocity, when compared to UDmVAP and UDmVMS methods, once the UDmV technique had the larger values for phase bias and jitter. This fact was conirmed with multiple comparison of the Tukey test applied to the phase velocity values determined using the phase values estimated with the UDmV method for all EA conditions of transducer TF.
According to the data presented in Table 2 and considering the three techniques to estimate the initial phase of the reference sinusoidal signals used for phase-quadrature demodulation, there is a statistical difference between the means of cs and m obtained with two techniques implemented in the present work and with the technique previously employed. These results may be explained based on the plots in Figure 3, where the UDmVMS and UDmVAP methods estimate, more precisely, the initial phase of reference sinusoidal signals used for phase-quadrature demodulation. In addition, the results in Table 3 indicate a statistical difference between the means of m for compared-pairs (170-110V) of the excitation amplitude of TF for UDmVMS method. For a robust experimental method, the results for m should be the same independently of the excitation amplitude of
TF. However, as emphasized in the previous paragraph and from the plots in Figure 3, the measurements of
m are more susceptible to errors as the SNR of the RF-echo signal decreases. Although statistical differences between the means of cs and m exist depending on the method employed to determine the initial phase of the reference sinusoidal signals used for phase-quadrature demodulation and also for different excitation signal amplitudes of transducer TF, it must be pointed out that statistical tests may indicate differences between the means of two populations although in practice those differences are irrelevant. This will occur whenever the standard deviations are very small and in fact, when the standard deviations tend to zero, then the statistical tests will point to different means, no matter what this difference is.
In view of the results obtained so far, there is a great motivation to carry out a new experiment, which could be performed to characterize the rheology of biological tissue in vitro. For this purpose, the experimental setup would be modiied in order to generate the harmonic shear waves and viscoelastic coeficients would be assessed only through the dispersion of phase velocity as a function of the frequency of the shear wave.
The computational simulation demonstrated that the modiication in UmVD method resulted in more accurate and precise estimates of the phase of the sinusoidal signal, which is used to generate the sine and cosine necessary to calculate the in phase and quadrature components of the RF echo-signals. The experimental results revealed that when the push and probing systems are synchronized, the UDmV method is able to estimate the in phase and quadrature components, which were employed to form the signal that represents the vibration waveform of the medium, due to the propagation of the shear wave. In addition, it was possible to use the method to estimate the phase velocity, the attenuation coeficient, shear modulus and viscosity of the 7% gelatin phantom, based on the propagation of shear waves in the phantom.
Acknowledgements
The authors are thankful to CAPES, CNPq and FAPERJ for the inancial support.
References
Amador C, Urban M, Kinnick R, Chen S, Greenleaf JF. In vivo swine kidney viscoelasticity during acute gradual decrease in renal blood flow: pilot study. Revista de Ingenieria Biomedica. 2013; 7(13):68-78. PMid:24533039.
Amador C, Urban MW, Chen S, Chen Q, An KN, Greenleaf JF. Shear elastic modulus estimation from indentation and SDUV on gelatin phantoms. IEEE Transactions on Biomedical Engineering. 2011; 58(6):1706-14. PMid:21317078. http:// dx.doi.org/10.1109/TBME.2011.2111419.
Bercoff J, Tanter M, Fink M. Supersonic shear imaging: a new technique for soft tissue elasticity mapping. IEEE Transactions on Ultrasonics, Ferroelectrics, and Frequency Control. 2004; 51(4):396-409. PMid:15139541. http://dx.doi.org/10.1109/ TUFFC.2004.1295425.
Catheline S, Gennisson JL, Delon G, Fink M, Sinkus R, Abouelkaram S, Culioli J. Measuring of viscoelastic properties of homogeneous soft solid using transient elastography: an inverse problem approach. The Journal of the Acoustical Society of America. 2004; 116(6):3734-41. PMid:15658723. http://dx.doi.org/10.1121/1.1815075.
Catheline S, Gennisson JL, Fink M. Measurement of elastic nonlinearity of soft solid with transient elastography. The Journal of the Acoustical Society of America. 2003; 114(6 Pt1):3087-91. PMid:14714790. http://dx.doi.org/10.1121/1.1610457.
Céspedes I, Huang Y, Ophir J, Spratt S. Methods for estimation of subsample time delays of digitized echo signals. Ultrasonic Imaging. 1995; 17(2):142-71. PMid:7571208. http://dx.doi.or g/10.1177/016173469501700204.
Chen S, Fatemi M, Greenleaf JF. Quantifying elasticity and viscosity from measurement of shear wave speed dispersion. The Journal of the Acoustical Society of America. 2004; 115(6):2781-5. PMid:15237800. http://dx.doi.org/10.1121/1.1739480. Chen X, Shen YY, Zheng Y, Lin HM, Guo YR, Zhu Y, Zhang X, Wang T, Chen S. Quantification of liver viscoelasticity with acoustic radiation force: A study of hepatic fibrosis in a rat model. Ultrasound in Medicine & Biology. 2013; 39(11):2091-102. PMid:23993170. http://dx.doi.org/10.1016/j. ultrasmedbio.2013.05.020.
Costa-Júnior JFS, Elsztain MAD, Sá AMFLM, Machado JC. Characterization of viscoelasticity due to shear wave propagation: A comparison of existing methods based on computational simulation and experimental data. Experimental Mechanics. 2017; 57(4):615-35. http://dx.doi.org/10.1007/ s11340-017-0254-6.
Costa-Júnior JFS, Machado JC. Ultrasonic method of microvibration detection: development of the method. Revista Brasileira de Engenharia Biomédica. 2011; 27(1):46-56. http:// dx.doi.org/10.4322/rbeb.2011.005.
Engineering. 2013; 41(1):1-19. PMid:23510006. http://dx.doi. org/10.1615/CritRevBiomedEng.2013006991.
Garra BS, Cespedes EI, Ophir J, Spratt SR, Zuurbier RA, Magnant CM, Pennanen MF. Elastography of breast lesions: initial clinical results. Radiology. 1997; 202(1):79-86. PMid:8988195. http:// dx.doi.org/10.1148/radiology.202.1.8988195.
Gennisson JL, Lerouge S, Cloutier G. Assessment by transient elastography of the viscoelastic properties of blood during clotting. Ultrasound in Medicine & Biology. 2006; 32(10):1529-37. PMid:17045874. http://dx.doi.org/10.1016/j. ultrasmedbio.2006.06.008.
Hasegawa H, Kanai H. Improving accuracy in estimation of artery-wall displacement by referring to center frequency of RF echo. IEEE Transactions on Ultrasonics, Ferroelectrics, and Frequency Control. 2006; 53(1):52-63. PMid:16471432. http://dx.doi.org/10.1109/TUFFC.2006.1588391.
Huang CC, Chen PY, Shih CC. Estimating the viscoelastic modulus of a thrombus using an ultrasonic shear-wave approach. Medical Physics. 2013; 40(4):042901-7. PMid:23556923. http://dx.doi.org/10.1118/1.4794493.
Meng W, Zhang G, Wu C, Wu G, Song Y, Lu Z. Preliminary results of acoustic radiation force impulse (ARFI) ultrasound imaging of breast lesions. Ultrasound in Medicine & Biology. 2011; 37(9):1436-43. PMid:21767903. http://dx.doi.org/10.1016/j. ultrasmedbio.2011.05.022.
Mitri FG, Urban MW, Fatemi M, Greenleaf JF. Shear wave dispersion ultrasonic vibrometry for measuring prostate shear stiffness and viscosity: an in vitro pilot study. IEEE Transactions on Biomedical Engineering. 2011; 58(2):235-42. PMid:20595086. http://dx.doi.org/10.1109/TBME.2010.2053928.
Ophir J, Cespedes I, Ponnekanti H, Yazdi Y, Li X. Elastography: a quantitative method for imaging the elasticity of biological tissues. Ultrasonic Imaging. 1991; 13(2):111-34. PMid:1858217. http://dx.doi.org/10.1177/016173469101300201.
Sumura M, Shigeno K, Hyuga T, Yoneda T, Shiina H, Igawa M. Initial evaluation of prostate cancer with real-time elastography based on step-section pathologic analysis after radical prostatectomy: a preliminary study. International Journal of Urology. 2007; 14(9):811-6. PMid:17760747. http://dx.doi. org/10.1111/j.1442-2042.2007.01829.x.
Urban MW, Chen S, Fatemi M. A review of Shearwave Dispersion Ultrasound Vibrometry (SDUV) and its applications. Current Medical Imaging Reviews. 2012; 8(1):27-36. PMid:22866026. http://dx.doi.org/10.2174/157340512799220625.
Urban MW, Chen S, Greenleaf JF. Error in estimates of tissue material properties from shear wave dispersion ultrasound vibrometry. IEEE Transactions on Ultrasonics, Ferroelectrics,
and Frequency Control. 2009; 56(4):748-58. PMid:19406703. http://dx.doi.org/10.1109/TUFFC.2009.1097.
Urban MW, Chen SG, Greenleaf JF. Harmonic motion detection in a vibrating scattering medium. IEEE Transactions on Ultrasonics, Ferroelectrics, and Frequency Control. 2008; 55(9):1956-74. PMid:18986892. http://dx.doi.org/10.1109/ TUFFC.887.
Urban MW, Greenleaf JF. Harmonic pulsed excitation and motion detection of a vibrating reflective target. The Journal of the Acoustical Society of America. 2008; 123(1):519-33. PMid:18177179. http://dx.doi.org/10.1121/1.2805666.
Yamakoshi Y, Sato J, Sato T. Ultrasonic imaging of internal vibration of soft tissue under forced vibration. IEEE Transactions on Ultrasonics, Ferroelectrics, and Frequency Control. 1990; 37(2):45-53. PMid:18285015. http://dx.doi.org/10.1109/58.46969. Zhang M, Castaneda B, Christensen J, Saad WE, Bylund K, Hoyt K, Strang JG, Rubens DJ, Parker KJ. Real-time sonoelastography of hepatic thermal lesions in a swine model. Medical Physics. 2008a; 35(9):4132-41. http://dx.doi.org/10.1118/1.2968939.
Zhang M, Nigwekar P, Castaneda B, Hoyt K, Joseph JV, Sant’Agnese A, Messing EM, Strang JG, Rubens DJ, Parker KJ. Quantitative characterization of viscoelastic properties of human prostate correlated with histology. Ultrasound in Medicine & Biology. 2008b; 34(7):1033-42. PMid:18258350. http://dx.doi.org/10.1016/j.ultrasmedbio.2007.11.024. Zheng Y, Chen S, Tan W, Kinnick R, Greenleaf JF. Detection of tissue harmonic motion induced by ultrasonic radiation force using pulse-echo ultrasound and Kalman filter. IEEE Transactions on Ultrasonics, Ferroelectrics, and Frequency Control. 2007; 54(2):290-300. PMid:17328326. http://dx.doi. org/10.1109/TUFFC.2007.243.
Zheng Y, Greenleaf JF. Stable and unbiased flow turbulence estimation from pulse echo ultrasound. IEEE Transactions on Ultrasonics, Ferroelectrics, and Frequency Control. 1999; 46(5):1074-87. PMid:18244301. http://dx.doi. org/10.1109/58.796113.
Zhu Y, Dong C, Yin Y, Chen X, Guo Y, Zheng Y, Shen Y, Wang T, Zhang X, Chen S. The role of viscosity estimation for oil-in-gelatin phantom in shear wave based ultrasound elastography. Ultrasound in Medicine & Biology. 2015; 41(2):601-9. PMid:25542484. http://dx.doi.org/10.1016/j. ultrasmedbio.2014.09.028.