O
R
I
G
I
N
A
L
A
R
T
I
C
L
E
Extraction and properties of starches from the
non-traditional vegetables Yam and Taro
Luan Alberto Andrade
1*, Natália Alves Barbosa
1and Joelma Pereira
11
Department of Food Science, Universidade Federal de Lavras – UFLA, Lavras, MG, Brazil
*luandrade87@yahoo.com.br
Abstract
The objective of this study was to assess the chemical, physical, morphological, crystalline and thermal properties of starch from two non-traditional vegetables, yam and taro. The analyses included proximate composition percent, amylose and mineral content, water absorption capacity, absolute density, morphological properties, X-ray diffractometry, thermal properties, pasting properties and infrared spectrum. The extracted starch exhibited a high purity level with low lipid, iber and ash contents. The electron micrographs suggested that the taro starch granules were smaller than the yam starch granules. The results for the experimental conditions used in this study indicated that the studied starches differed, especially the amylose content, granule size and crystallinity degree and the pattern of the starches. Due to the high amylose content of yam starch, this type of starch can be used for ilm preparation, whereas the taro starch can be used as a fat substitute due to its small granule size.
Keywords: amylose, colocasia esculenta, dioscorea sp., FTIR, gelatinization.
1. Introduction
Starch is an amylaceous product that is extracted from the edible parts of plants, especially cereals, tubercles, roots and rhizomes. In the food industry, this carbohydrate can be used to improve texture and as a thickener, colloidal stabilizer, gelling agent or volume and water retention agent[1].
The main sources of commercial starch worldwide are corn, potatoes and manioc. The composition and structure of starch granules vary considerably according to the botanical source, which affects its properties and functions[2]. Thus, there is a need for extensive research, especially on alternative starch sources, to assess the biochemical, functional, physical and chemical characteristics of the starches so that possible applications may be developed using substitutes for traditional starch sources and chemically modified starches.
Tropical countries, such as Brazil, have a great variety of endemic roots and tubercles, such as yam (Dioscorea sp.) and taro (Colocasia esculenta). These plants contain an average of 70% to 80% water, 16% to 24% starch and less than 4% lipids and proteins[3]. Because of the high starch content of yam and taro tubercles, which can reach 80% or more of the dry mass[4,5], these vegetables could represent alternative sources of starch.
The yam starches have an average granule size of 25 μm, with a type-C crystalline pattern and a relative crystallinity estimated at 34%[6,7]. Due to their high amylose content, yam starches can be used for film preparation[8]. In turn, according to Almeida et al.[9], native taro starch exhibits highly agglomerated round- and polyhedral-shaped granules. This type of starch can be used as a fat substitute because of its small granule size, and it also has potential application in baby food formulation[8].
The purpose of this study was to assess the chemical, physical, morphological, crystalline and thermal properties of alternative starches extracted from two non-traditional
vegetables, yam and taro, that were cultivated in Brazil to determine their capacity for use as an alternative to traditional starches.
2. Materials and Methods
2.1 Starch extraction
Approximately 4.07 g of anhydrous sodium metabisulfite was dissolved in 2.5 L of distilled water to preserve the material. One kilogram of previously chopped yam and taro was added to this solution in separate containers. The mixture was maintained under conditions of light and continuous agitation for subsequent grinding of the sample in 3 L of distilled water, using an industrial blender.
After grinding, the fluid paste was sieved using an 80-mesh sieve. The residue volume was measured, twice the amount of water was added, grinding was performed again, and the material was sieved.
The resulting liquid was filtered using a 200-mesh sieve and then allowed to rest for 24 hr for decantation before the supernatant was removed. Water was added to the starch layer, and then the mixture was centrifuged at 3,000 rpm. After centrifugation, the supernatant was separated from the precipitate (starch), which was dried in a forced-air dryer at 40 °C.
2.2 Chemical and physical analysis
2.2.1 Determination of the composition percentage and amylose and mineral content of the yam (YS) and taro (TS) starches
The ether extract, crude protein, ash and carbohydrate fraction contents, which were low, were determined according to the Association of Analytical Communities[10].
The crude fiber content was determined using the method of Van de Kamer and Van Ginkel[11].
The amylose content was determined using a colorimetric method with iodine as described by McGrance et al.[12].
The mineral levels were determined according to the techniques described by Malavolta et al.[13].
2.2.2 Water absorption capacity (WAC)
Beuchat’s[14] method was used to determine the water absorption capacity of the extracted starches.
2.2.3 Absolute density
The absolute density of the YS and TS was determined by xylene displacement according to the methodology recommended by Schoch and Leach[15].
2.3 Morphological properties
After drying and grinding, the powder samples of YS and TS were deposited on double-sided carbon tape, placed on racks covered with aluminum foil and sputter-coated with gold (Balzers Sputter Coater SCD 050). At the end of this procedure, the samples were examined under a scanning electron microscope. The generated images were scanned at varying magnifications at 20.00 kV and work distance between 8.0 and 9.0 mm.
2.4 X-Ray diffraction (XRD)
The starches were characterized using the XRD powder method with PANalytical equipment, model X’Pert Pro, a 2θ angular variation of 4° to 70°, CoKα radiation and a scanning rate of 5° min-1. The spacing d was calculated using the Bragg equations (nλ = 2dsinθ, where d is the spacing, n = 1, and λ = 1.7889 Å). From the recorded diffractogram, the crystallinity index was calculated.
2.5 Thermal properties
The thermal characteristics of the isolated starches were studied using a differential scanning calorimeter (DSC - Auto Differential Scanning Calorimeter DSC-60A, Shimadzu) equipped with a thermal analysis station. Initially, a starch suspension was prepared with 70% distilled water and 30% of each studied starch. The samples were hermetically sealed in pots and allowed to rest for 1 h at room temperature before the samples were heated in the DSC. The temperature of the DSC analyzer was calibrated using tin and indium standards, and an empty aluminum pot was used as a reference. The samples were heated at a rate of 10 °C min-1 from 25 °C to 120 °C. The onset temperature (To), peak temperature (Tp), conclusion temperature (Tc) and enthalpy of gelatinization (ΔHgel) were automatically calculated. The gelatinization temperature range (R) was calculated as (Tc - To). The peak height index (PHI) was calculated using the ratio ΔH (Tp - To)
-1, as described by Krueger et al.[16].
Thermogravimetric analysis (TGA) and differential thermal analysis (DTA) were performed in a DTG-60H
thermogravimetric analyzer (Shimadzu) at temperatures ranging from 30 °C to 600 °C and scanning rates of 10 °C min-1; the analyses were also run under N
2 atmosphere with a flow rate of 50 mL min-1.
2.6 Pasting properties
To determine the apparent paste viscosity, a Rapid Visco Analyzer (RVA - Newport Scientific, Sydney, Warriewood, Australia) was used according to the International Association for Cereal Science and Technology (ICC) standard method no. 162[17].
2.7 Infrared spectrum
After the samples were dried in a forced-air oven, the YS and TS were analyzed by Fourier transform infrared spectroscopy (FTIR) in a Digilab Excalibur FTS 3000 spectrometer (USA) with a deuterated triglycine sulfate (DTGS) detector using a spectral range between 4000 cm-1 and 400 cm-1 and a resolution of 4 cm-1. The samples were analyzed using the transmission in potassium bromide (KBr) pellets that were 7 mm in diameter.
2.8 Statistical analysis
A descriptive statistical analysis was performed to obtain the mean and standard deviation of the three previously analyzed replicates.
3. Results and Discussion
3.1 Chemical composition
Table 1 presents the chemical composition of the isolated yam (YS) and taro (TS) starches.
According to Peroni et al.[2], the purity of a starch is related to its chemical composition, and pure starches generally have low levels of ash, protein and lipids. Therefore, the ether extract, ash and crude fiber contents should have been lower than 1.00 g 100 g-1 according to the literature[2,18-21]. The crude protein content was higher than the values in some studies[2,20,21], although the differences were not significant. The high protein content may be due to the strong bond of the starch with the mucilage present in this vegetable[8]. Because of the low observed levels, especially for the ether extract, ash and crude fiber contents, and the moderate levels observed for protein, the extracted starch was determined to have a high purity of more than 96 g 100 g-1.
The moisture contents were lower than 14 g 100 g-1, which is generally acceptable for dry products and a desirable shelf life.
The amylose content in starch has an important effect on its functional properties. According to Zuluaga et al.[6], the high amylose content in yam starch (28.8 g 100 g-1) was one of the factors associated with the high level of retrograded starch.
lower than those found in the present study. The composition of TS is also similar to the composition reported in most studies of Colocasia esculenta starch, with amylose values of 18.4 g 100 g-1[22] or from 13.5 to 27.66 g 100 g-1[23]. The differences found for YS may result from the different methods used for amylose extraction and measurement.
The contents of the main minerals present in YS and TS are listed in Table 1, which shows the absence of K, Mg, Mn and S for both starches and Ca for YS. According to Tester et al.[24], starches contain small amounts of minerals such as Ca, Mg, P, K and Na; however, only P is functionally significant. The P from the starch of tubercles, such as potatoes, usually occurs in the form of the negatively charged phosphomonoester. The ionic repulsion generated by these groups weakens the intermolecular association forces, thus increasing its water-binding capacity, swelling power and paste clarity. This factor can also result in higher starch viscosity, thus leading to greater gel strength[25]. The P contents reported in the literature for yam and taro starches are approximately 0.022 g 100 g-1 and 0.01 g 100 g-1, respectively[2,20], which are lower than the values found in this study.
Because of the different isolation methods used to determine the starch content, the chemical and mineral composition depends on the botanical source and types of fertilization as well as on the extraction method[20].
3.2 Physical properties
3.2.1 Water absorption capacity (WAC) and absolute density
The WAC values found for YS and TS (323.18 ± 0.99% and 333.28 ± 1.10%, respectively) are consistent with the values reported in the literature[17,23]. According to Hoover and Sosulski, 1986 (cited by Shujun et al.[26]), the lower water absorption capacity of yam starch, compared with taro starch, shows that there is a higher proportion of hydroxyl groups in the formation of hydrogen and covalent bonds between the starch chains than with water.
Starch density is fundamentally important for technological purposes. This parameter represents the content of material per unit of real volume occupied by the material[15]. The density of YS (1.46 ± 0.02 g cm-3) was higher than the TS density (1.31 ± 0.03 g cm-3), and these density values are similar to the values reported in the study by Deepika et al.[18] as well as in the study by Deepika et al.[23] The whole granule content of YS is most likely higher than that of TS, as indicated by its higher absolute density.
3.3 Morphological properties
Figure 1 displays the scanning electron micrographs of the starches extracted from yam and taro.
The YS granules are significantly larger than the TS granules, with the YS granules varying between 15.51 and 30.47 µm and the TS granules varying between 2.273 and 3.986 µm. Such differences between the starch granules are responsible for their different properties.
Electron micrographs B and D confirm the main elliptical shape of the YS granules. Dioscorea starch, which was studied by Deepika et al.[18], contained oval- and ellipsoidal-shaped granules with diameters between 5 and 10 μm; these values are lower than the diameters found in the present study. The morphology and size of the starch granules depend on the starch biosynthesis and on the plant physiology, which affects the light transmittance, amylose content, water absorption capacity and swelling power[27].
The TS granules are widely agglomerated, and the main shape is polyhedral with both circular and irregular shapes (as shown in Figures 1A and 1C). In a study on Mexican taro[28], the starch granules clearly exhibited a mixture of shapes, such as oval, spherical polygonal and irregular shapes, with granule sizes between 1 mm and 5 mm, which is consistent with the present study.
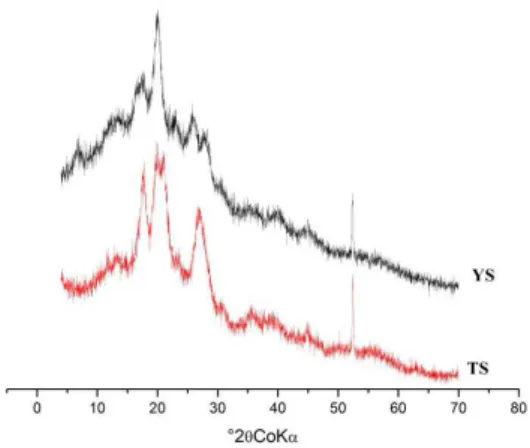
3.4 X-Ray diffraction
The XRD patterns of YS and TS are presented in Figure 2. The corresponding calculated crystallinity levels were 32.88% and 44.66% for YS and TS, respectively. The crystallinity degree of the starch is close to that found in certain studies[19,22]. In accordance with the literature, the TS had a lower amylose percentage (19.37 g 100 g-1) and a higher amylopectin content and crystallinity index[19]; this finding indicates that the crystallinity is primarily responsible for the amylopectin content.
The TS exhibited a type-A crystallinity pattern (Zobel 1988) that is similar to that of the starches studied by Sit et al.[22], Zeng et al.[21], Sukhija et al.[8] and Agama-Acevedo et al.[28] In the type-A pattern, double helices are packed in a monoclinic unit cell and form a densely packed structure with only four water molecules per cell[29].
Unlike TS, YS exhibited a type-C crystallinity pattern, which Gernat et al.[30] reported to be a mixture of patterns A and B; thus, the crystalline regions of this starch contain a fraction of each pattern. According to Jiang et al.[19], out of the five
Table 1. Moisture, ether extract, crude protein, ash, crude fiber, amylose, macro-and micro-mineral content and carbohydrate fraction
of yam (YS) and taro (TS) starches.
Starch M EE
a CPa Aa CFa CFra Amylosea
g 100 g-1
YS 10.9 ± 0.10 0.44 ± 0.08 2.44 ± 0.31 0.26 ± 0.00 0.65 ± 0.16 96.22 ± 0.29 37.46 ± 0.48 TS 10.5 ± 0.20 0.43 ± 0.09 1.46 ± 0.10 0.98 ± 0.05 0.39 ± 0.01 96.75 ± 0.09 19.37 ± 0.93
Starch P K Ca Mg S Cu Mn Zn Fe
g 100 g-1 mg kg-1
YS 0.04 0.00 0.00 0.00 0.00 14.6 0.00 0.02 67.00
TS 0.05 0.00 0.09 0.00 0.00 9.5 0.00 10.4 70.80
M: moisture; EE: ether extract; CP: crude protein; A: ash; CF: crude fiber; CFr: carbohydrate fraction; YS: yam starch; TS: taro starch; adry basis.
studied Dioscorea varieties, four corresponded to type C, and only one corresponded to type A. Lan et al.[7] also showed a type C crystallinity pattern for Chinese yam.
3.5 Thermal properties
The thermal properties of YS and TS are displayed in Table 2. The To, Tp and Tc of the studied starches were very different, with TS gelatinization starting at a temperature that was 12.7 °C lower than the temperature observed for YS. Therefore, when gelatinization must be started and completed at lower temperatures, the use of TS is recommended over YS.
Compared with the values found in the literature, the To, Tp and Tc temperatures for TS and YS were lower, and the enthalpy was much higher[19,28].
Zuluaga et al.[6] studied yam starch (potato and corn starch were the standards) and observed that the gelatinization enthalpy increased with a decrease in crystallinity degree, which corroborated the findings of the present study, in which
32.88% crystallinity was found for YS, 44.66% crystallinity was found for TS, and higher enthalpy was found for YS compared to TS (68.28 J g-1 versus 25.21 J g-1).
The differences in the gelatinization temperature may be associated with differences in the amylose content, shape, distribution and water-binding capacity of the starch granules. When a majority of the hydroxyl groups within a granule are involved in the formation of hydrogen and covalent bonds between starch chains instead of with water molecules, a decrease in the WAC can occur, which was observed. Furthermore, an increase in gelatinization enthalpy may also occur[31], which would explain the high value for the gelatinization enthalpy.
PHI measures the uniformity of gelatinization, which was much higher for YS and indicated differences in the internal organization of the two starch granules. The R values (gelatinization range) were similar and high for both starches but lower than the value reported for the D. opposita Thunb. YS in the study by Deepika et al.[18].
Figure 3 shows the TGA and DTA curves. For both starches, until temperatures close to 100 °C were reached, only 11.10% and 8.01% water was lost, respectively, which was indicated by the endothermic peak (descending). Until approximately 250 °C, the starch did not depolymerize with increasing temperature; therefore, the starch was stable and did not exhibit alterations in its structure and properties. At the second temperature drop, the entire process became endothermic according to the DTA curve. The final masses at 600 °C were 14.29 g 100 g-1 and 14.40 g 100 g-1 for YS and TS, respectively.
3.6 Pasting properties
When a starch suspension is heated at a constant speed, the viscosity gradually increases until a maximum value is reached[28]. The pasting properties of the starches are summarized in Table 2.
Figure 1. Scanning electron micrographs of native taro and yam starches. (A) and (C) taro starch granules at lower and higher magnifications,
respectively; (B) and (D) yam starch granules at lower and higher magnifications, respectively.
The starch viscosity increased when the temperature reached approximately 73 °C and 77 °C for YS and TS, respectively; this temperature is known as the initial pasting temperature. The observed values were lower than those observed in the study of Mexican taro[28] and the study of four out of the five different Dioscorea L. species by Jiang et al.[19] Starch granules that have low amylose content can swell at a higher temperature[32]. However, because the amylose contents in the present study were relatively high, especially for YS, the suspension temperature required for granule swelling was lower.
For both starches, the peak viscosity was high (3242.5 cP and 4042.0 cP) and occurred before the constant temperature of 95 °C was reached. This peak reflects the maximum capacity of the starch to swell freely before physical collapse.
The pasting properties, such as the setback and breakdown, can be influenced by the amylose and lipid contents, and the high amylose content of YS and TS resulted in high values of these two properties[19,33]. Such values demonstrate the high retrogradation tendency in these starches, especially in TS.
3.7 Infrared spectrum (FTIR)
The isolated starches were assessed using FTIR to identify functional groups in the starches, with the goal of determining the starch structure (Figure 4). The wide band at 3,380 cm-1 for YS and TS can be attributed to the OH
bond, and its width is related to the formation of inter- and intramolecular hydrogen bonds[34]. Bands at 2,931 cm-1 can be attributed to the axial deformation of the C-H bond, which is found in the region between 3,000 and 2,800 cm-1. Changes in the intensity of the band at 2,931 cm-1 can be caused by variations in the amylose and amylopectin contents of the starches[35]. In the present study, the intensity was higher for TS, which contains less amylose and has a higher crystallinity degree.
Table 2. Thermal and pasting properties of the starch extracted from yam (YS) and taro (TS).
Starch To (°C) Tp (°C) Tc (°C) R PHI ΔHgel (J g-1)
YS 62.54 71.63 78.36 15.82 7.51 68.28
TS 49.84 56.42 66.64 16.80 3.83 25.21
Starch A Tip (°C) B C Breakdown Setback FVa
TS 157.5 77 4042.0 2651.0 1391.0 1248.0 3899
YS 165.0 73 3242.5 1723.5 1519.0 741.5 2465
To: onset temperature; Tp, peak temperature; Tc: conclusion temperature; R: gelatinization range, (Tc–To); PHI: peak height index, ΔHgel (Tp–To)-1;
ΔHgel: enthalpy of gelatinization; YS: yam starch; TS: taro starch.
aValues in cP; T
ip: initial paste temperature. Breakdown = viscosity peak - B;
Setback = final viscosity - B. A: maximum viscosity at 25 °C; B: maximum viscosity at 95 °C; C: minimum viscosity at cooling. FV: Final viscosity. The results reported are the means of duplicate samples.
Figure 4. Infrared spectra (FTIR) of yam (YS) and taro (TS)
starches.
The band at 1,163 cm-1 corresponds to the coupling of the C-O and C-C stretching mode, and the band at 1,094 cm-1 can be attributed to C-O-H bending.
The vibrational bands (bending and deformation) related to C and H atoms can be observed in the region from 1,500 cm-1 to 1,300 cm-1.
According to Zeng et al.[21], who studied taro starch cultivated in China, the bands at 1,081 cm-1 and 1,019 cm-1 are characteristic of the O-C stretching associated with anhydrous glucose, which can be observed at 1,090 cm-1 and 994 cm-1 for YS and at 1,083 cm-1 and 1,021 cm-1 for TS.
According to Kizil et al.[35], the band observed at 1,642 cm-1 can be associated with the water adsorbed in the amorphous region of the starch granules. Because this band is related to the starch crystallinity, the variations in the crystallinity of different starches can affect this band. In the present study, the bands at 1,641 cm-1 and 1,651 cm-1 have different intensities and displacements, which can indicate the difference in the crystallinity patterns of the yam and taro starches, as shown by the XRD.
The prominent band at 931 cm-1 corresponds to the water sensitivity and indicates the presence of this molecule in the starch structure[18].
3.8 Suggestions for application of YS and TS
Due to the small starch granule size observed for taro (2.273 and 3.986 µm), this type of starch can be used in products that require smaller particle sizes, including as a fat substitute or as flavor or substance carriers[36].
According to Liporacci et al.[37], yam starch is a promising polymer for film preparation due to its high content of amylose (30%), which is a polymer responsible for the film-forming property of starch. In the present study, the amylose content was even higher (37.46 ± 0.48 g 100 g-1), indicating that this yam starch has the potential to be used in the preparation of starch-based biofilms.
4. Conclusions
The studied starches were found to exhibit great differences, especially in their amylose content, granule size and crystallinity degree and pattern. TS exhibited a higher retrogradation tendency, whereas YS displayed a high enthalpy of gelatinization and exhibited a higher degree of interaction between its chains. Because of the differences in the measured properties of the studied starches, the two starches can have different applications in the field of food science and technology. YS can be used in film preparation, whereas TS can be used in products that require smaller particle sizes, for example, as a fat substitute.
5. Acknowledgements
The authors would like to thank the Brazilian Federal Agency for Support and Evaluation of Graduate Education (Coordenação de Aperfeiçoamento de Pessoal de Nível Superior – CAPES), the National Counsel of Technological and Scientific Development (Conselho Nacional de
Desenvolvimento Científico e Tecnológico – CNPq) and the Minas Gerais Research Foundation (Fundação de Amparo à Pesquisa do Estado de Minas Gerais - Fapemig) for financial support. We would also like to thank the Laboratory of Electronic Microscopy and Ultrastructural Analysis (Laboratório de Microscopia Eletrônica e Análise Ultraestrutural – LME) of the Federal University of Lavras (Universidade Federal de Lavras – UFLA).
6. References
1. Kaur, A., Singh, N., Ezekiel, R., & Guraya, H. S. (2007). Physicochemical, thermal and pasting properties of starches separated from different potato cultivars grown at different locations. Food Chemistry, 101(2), 643-651. http://dx.doi. org/10.1016/j.foodchem.2006.01.054.
2. Peroni, F. H. G., Rocha, T. S., & Franco, C. M. L. (2006). Some structural and physicochemical characteristics of tuber and root starches. Food Science & Technology International,
12(6), 505-513. http://dx.doi.org/10.1177/1082013206073045. 3. Hoover, R. (2001). Composition, molecular structure, and physicochemical properties of tuber and root starches: a review. Carbohydrate Polymers, 45(3), 253-267. http://dx.doi. org/10.1016/S0144-8617(00)00260-5.
4. Jane, J., Shen, J., Chen, J., Lim, S., Kasemsuwan, T., & Nip, W. (1992). Physical and chemical studies of Taro starches and flours. Cereal Chemistry, 69(5), 528-535. Retrieved in 04 April 2016, from http://www.aaccnet.org/publications/cc/ backissues/1992/Documents/CC1992a134.html
5. Leonel, M., & Cereda, M. (2002). Caracterização físico-química
de algumas tuberosas amiláceas.Ciência e Tecnologia de Alimentos, 22(1), 65-69. http://dx.doi.org/10.1590/S0101-20612002000100012.
6. Zuluaga, M.-F., Baena, Y., Mora, C.-E., & D’León, L.-F. P. (2007). Physicochemical characterization and application of yam (Dioscorea cayenensis-rotundata) starch as a pharmaceutical excipient. Stärke, 59(7), 307-317. http://dx.doi.org/10.1002/ star.200600516.
7. Lan, X., Li, Y., Xie, S., & Wang, Z. (2015). Ultrastructure of underutilized tuber starches and its relation to physicochemical properties. Food Chemistry, 188, 632-640. PMid:26041241. http://dx.doi.org/10.1016/j.foodchem.2015.05.025. 8. Sukhija, S., Singh, S., & Riar, C. S. (2016). Isolation of starches
from different tubers and study of their physicochemical, thermal, rheological and morphological characteristics. Stärke,
68(1-2), 160-168. http://dx.doi.org/10.1002/star.201500186. 9. Almeida, E., Bora, P., & Zaráte, N. (2013). Amido nativo e modificado de taro (Colocasia esculenta L Schott): caracterização química, morfológica e propriedades de pasta. Boletim do Centro de Pesquisa de Processamento de Alimentos, 31(1), 67-82. http://dx.doi.org/10.5380/cep.v31i1.32703. 10. Association of Analytical Communities – AOAC. (2012). Official
Methods of Analysis of AOAC International. Gaithersburg: AOAC International.
11. Van de Kamer, J., & Van Ginkel, L. (1952). Rapid determination of crude fiber in cereals. Cereal Chemistry, 29, 239-251. Retrieved in 04 April 2016, from http://www.cabdirect.org/
abstracts/19531400026.html;jsessionid=A4788EDF3D603D 51AA1A7575FDBC3DCA#
13. Malavolta, E., Vitti, G. C., & Oliveira, S. A. (1997). Avaliação do estado nutricional das plantas: principios e aplicações. Piracicaba: POTAFOS.
14. Beuchat, L. R. (1977). Functional and electrophoretic characteristics of succinylated peanut flour protein. Journal of Agricultural and Food Chemistry, 25(2), 258-261. http:// dx.doi.org/10.1021/jf60210a044.
15. Schoch, T., & Leach, W. (1964). Determination of absolute density; liquid displacement. In R. Whistler & M. Wolfrom
(Eds.), Methods in carbohydrates chemistry. Zürich: Academic Press. 101 p.
16. Krueger, B. R., Knutson, C. A., Inglett, G. E., & Walker, C. (1987). A differential scanning calorimetry study on the effect of annealing on gelatinization behavior of corn starch.
Journal of Food Science, 52(3), 715-718. http://dx.doi. org/10.1111/j.1365-2621.1987.tb06709.x.
17. International Association for Cereal Science and Technolog – ICC. (1995). Rapid pasting method using the Newport rapid Visco analyser (Standard Methods, no. 162, pp. 123-456). Vienna: ICC. Retrieved in 04 April 2016, from https://www. icc.or.at/standard_methods/162
18. Deepika, V., Jayaram Kumar, K., & Anima, P. (2013). Isolation and physicochemical characterization of sustained releasing starches from Dioscorea of Jharkhand. International Journal of Biological Macromolecules, 55, 193-200. PMid:23201777. http://dx.doi.org/10.1016/j.ijbiomac.2012.11.027.
19. Jiang, Q., Gao, W., Li, X., Xia, Y., Wang, H., Wu, S., Huang, L., Liu, C., & Xiao, P. (2012). Characterizations of starches isolated from five different Dioscorea L. Species. Food Hydrocolloids,
29(1), 35-41. http://dx.doi.org/10.1016/j.foodhyd.2012.01.011. 20. Pérez, E., Schultz, F. S., & de Delahaye, E. P. (2005). Characterization of some properties of starches isolated from
Xanthosoma sagittifolium (Tannia) and Colocassia esculenta
(Taro). Carbohydrate Polymers, 60(2), 139-145. http://dx.doi. org/10.1016/j.carbpol.2004.11.033.
21. Zeng, F.-K., Liu, H., & Liu, G. (2014). Physicochemical properties of starch extracted from Colocasia esculenta (L.) Schott (Bun-long taro) grown in Hunan, China. Stärke, 66 (1-2), 142-148. http://dx.doi.org/10.1002/star.201300039. 22. Sit, N., Misra, S., Baruah, D., Badwaik, L. S., & Deka, S.
(2014). Physicochemical properties of Taro and maize starch and their effect on texture, colour and sensory quality of tomato ketchup. Stärke, 66(3-4), 294-302. http://dx.doi.org/10.1002/ star.201300120.
23. Deepika, V., Jayaram Kumar, K., & Anima, P. (2013). Isolation and partial characterization of delayed releasing starches of Colocasia species from Jharkhand, India. Carbohydrate Polymers, 96(1), 253-258. PMid:23688478. http://dx.doi. org/10.1016/j.carbpol.2013.04.002.
24. Tester, R. F., Karkalas, J., & Qi, X. (2004). Starch: composition, fine structure and architecture. Journal of Cereal Science,
39(2), 151-165. http://dx.doi.org/10.1016/j.jcs.2003.12.001. 25. Ellis, R. P., Cochrane, M. P., Dale, M. F. B., Duffus, C. M., Lynn, A., Morrison, I. M., Prentice, R. D. M., Swanston, J. S., & Tiller, S. A. (1998). Starch production and industrial use. Journal of the Science of Food and Agriculture, 77(3), 289-311. http://
dx.doi.org/10.1002/(SICI)1097-0010(199807)77:3<289::AID-JSFA38>3.0.CO;2-D.
26. Shujun, W., Hongyan, L., Wenyuan, G., Haixia, C., Jiugao, Y., & Peigen, X. (2006). Characterization of new starches separated from different Chinese yam (Dioscorea opposita Thunb.) cultivars. Food Chemistry, 99(1), 30-37. http://dx.doi. org/10.1016/j.foodchem.2005.07.008.
27. Badenhuizen, N. P. (1969). The biogenesis of starch granules in higher plants. New York: Appleton-Century-Crofts. 28. Agama-Acevedo, E., Garcia-Suarez, F. J., Gutierrez-Meraz,
F., Sanchez-Rivera, M. M., San Martin, E., & Bello-Pérez, L. A. (2011). Isolation and partial characterization of Mexican Taro (Colocasia esculenta L.) starch. Stärke, 63(3), 139-146. http://dx.doi.org/10.1002/star.201000113.
29. Imberty, A., Buléon, A., Tran, V., & Péerez, S. (1991). Recent advances in knowledge of starch structure. Stärke, 43(10), 375-384. http://dx.doi.org/10.1002/star.19910431002. 30. Gernat, C., Radosta, S., Damaschun, G., & Schierbaum, F.
(1990). Supramolecular structure of legume starches revealed by X-ray scattering. Stärke, 42(5), 175-178. http://dx.doi. org/10.1002/star.19900420504.
31. Shujun, W., Wenyuan, G., Hongyan, L., Haixia, C., Jiugao, Y., & Peigen, X. (2006). Studies on the physicochemical, morphological, thermal and crystalline properties of starches separated from different Dioscorea opposita cultivars.
Food Chemistry, 99(1), 38-44. http://dx.doi.org/10.1016/j. foodchem.2005.07.007.
32. Singh, N., Singh, J., Kaur, L., Sodhi, N. S., & Gill, B. S. (2003). Morphological, thermal and rheological properties of starches from different botanical sources. Food Chemistry, 81(2), 219-231. http://dx.doi.org/10.1016/S0308-8146(02)00416-8. 33. Chung, H.-J., Liu, Q., Lee, L., & Wei, D. (2011). Relationship
between the structure, physicochemical properties and in vitro
digestibility of rice starches with different amylose contents.
Food Hydrocolloids, 25(5), 968-975. http://dx.doi.org/10.1016/j. foodhyd.2010.09.011.
34. Saikia, J. P., & Konwar, B. K. (2012). Physicochemical properties
of starch from aroids of North East India.International Journal of Food Properties, 15(6), 1247-1261. http://dx.doi.org/10.10 80/10942912.2010.491929.
35. Kizil, R., Irudayaraj, J., & Seetharaman, K. (2002).
Characterization of irradiated starches by using FT-Raman and FTIR spectroscopy.Journal of Agricultural and Food Chemistry, 50(14), 3912-3918. PMid:12083858. http://dx.doi. org/10.1021/jf011652p.
36. Zhao, J., & Whistler, R. L. (1994). Spherical aggregates of starch granules as flavor carriers. Food Technology, 48(7), 104-105. Retrieved in 04 April 2016, from http://agris.fao.
org/agris-search/search.do?recordID=US9501867
37. Liporacci, J. S. N., Mali, S., & Grossmann, M. (2005). Efeito do método de extração na composição química e nas propriedades
funcionais do amido de inhame (Dioscorea alata) [Effects of
extraction method on chemical composition and functional properties of yam starch (Dioscorea alata)]. Semina: Ciências Agrárias, 26(3), 345-352. Retrieved in 04 April 2016, from http://www.uel.br/revistas/uel/index.php/semagrarias/article/ view/2308