Carlos Augusto MonteiroI,II Erly Catarina MouraI,III Patrícia Constante JaimeI,II Rafael Moreira ClaroI,II
I Núcleo de Pesquisas Epidemiológicas em Nutrição e Saúde. Universidade de São Paulo. São Paulo, SP, Brasil
II Departamento de Nutrição. Faculdade de Saúde Pública. Universidade de São Paulo. São Paulo, SP, Brasil
III Universidade Federal do Pará. Belém, PA, Brasil
Correspondence: Carlos Augusto Monteiro Departamento de Nutrição Faculdade de Saúde Pública Universidade de São Paulo 01246-904 São Paulo, SP, Brasil E-mail: [email protected]
Received: 9/6/2007 Reviewed: 3/13/2008 Approved: 4/2/2008
Validity of food and beverage
intake data obtained by
telephone survey
ABSTRACT
OBJECTIVE: To evaluate the reproducibility and validity of data on food and beverage intake obtained by means of a telephone-based surveillance system.
METHODS: Reproducibility and validity analyses were carried out in two random subsamples (n=112 and n=119, respectively) of the total sample (N=2,024) of adults (≥18 years) studied by the system in 2005 in the municipality of São Paulo, Southeastern Brazil. Indicators evaluated included protective factors (daily or almost daily intake of fruit and vegetables) and risk factors (daily or almost daily intake of soft drinks, frequent intake of foods containing saturated animal fat, and abusive intake of alcoholic beverages) for the development of chronic diseases. Reproducibility was studied by comparing the results of the original telephonic interview with those of another interview carried out 7-15 days later. Validity was analyzed by comparing the results of the telephone interview with those of three 24-hour recalls (our gold-standard) carried out up to 5 days following the original interview.
RESULTS: The frequency of the studied indicators remained relatively constant between the fi rst and second telephone interviews, with kappa coeffi cients ranging from 0.57 to 0.80, indicating good reproducibility for all indicators. In relation to the gold standard, there was a trend towards overestimating the frequency of intake of protective foods, but of foods associated with increased risk of chronic diseases. Sensitivity and specifi city were high for indicators of consumption of risk-associated foods (close to 80%), and variable in the case of protective foods (42% to 80%).
CONCLUSIONS: The evaluation showed evidence of good reproducibility and adequate validity for most indicators employed in the system, which indicates that maintaining this system operational in coming years will provide a useful instrument for evaluating public policies for the promotion of a healthy diet and for control of non-communicable chronic diseases with a dietary component in Brazil.
DESCRIPTORS: Alcohol Drinking. Food Consumption. Validity of Tests. Nutrition Surveys. Nutritional Surveillance.
INTRODUCTION
Brazil, NTCDs account for 62.8% of all deaths for which the cause is known.a Time series of mortality
statistics available for Brazilian state capitals indicate that the proportion of NTCD deaths increased more than three-fold between the 1930’s and 1980’s.6 WHO
global estimates also indicate that a limited number of risk factors accounts for the great majority of NTCD deaths and for a substantial fraction of the disease burden related to such diseases. Noteworthy among these factors, in addition to smoking and obesity, are food and beverage intake characteristics and physical activity patterns.17
Since 2006, a surveillance system has been operational in Brazil that monitors the frequency and distribution of NTCD risk factors in the capitals of the 26 Brazilian states as well as in the Federal District. This system, which is called Vigilância de Fatores de Risco e Pro-teção para Doenças Crônicas não Transmissíveis por Inquérito Telefônico (VIGITEL – Risk Factor Surveil-lance for Non-Transmissible Chronic Diseases by Telephone Survey), is based on telephone interviews carried out continuously in probabilistic samples of the adult population with access to telephone in each of these cities. Estimates are adjusted for differences in the sociodemographic composition of these samples in relation to the composition of each city’s total adult population.b VIGITEL was tested successfully in São
Paulo in 20038 and retested in this same city and in
another four state capitals in 2005. In the second test carried out in the city of São Paulo, the evaluation of the system’s operation was coupled to a study of the re-producibility and validity of its indicators. The present article describes the results of this study with respect to food and beverage intake. Reproducibility and validity for indicators of physical activity and inactivity are described in Monteiro et al.9
METHODS
The study employed subsamples extracted from the entire sample (N=2.204) of subjects studied by the VIGITEL system in the city of São Paulo in 2005. Sampling procedures for this system, described in detail in a previous publication,8,b ensure that, in each city,
representative samples of the population of individu-als aged 18 years or older living in households with telephone are selected. Two systematic subsamples (n=115), with proportion of men and women similar to that of the whole sample, were randomly selected for participation in reproducibility and validity studies. Three subjects in the reproducibility subsample and six
a Ministério da Saúde. Secretaria de Vigilância em Saúde. Departamento de Análise de Situação em Saúde. Saúde Brasil 2006: uma análise da situação de saúde no Brasil. Brasília; 2006. (Série G Estatística informação em Saúde).
b Ministério da Saúde. VIGITEL Brasil 2006. Vigilância de fatores de risco e proteção para doenças crônicas por inquérito telefônico: estimativas sobre freqüência e distribuição sócio-demográfi ca de fatores de risco e proteção para doenças crônicas nas capitais dos 26 estados brasileiros e no Distrito Federal em 2006. Brasília; 2007 [cited 2008 May 4]. Available from: http://portal.saude.gov.br/portal/arquivos/ pdf/relatorio_vigitel_2006_marco_2007.pdf
in the validity subsample refused to participate in these studies or did not complete the required interviews. The fi nal study sample comprised 112 subjects (44 men and 68 women) for the reproducibility study and 109 subjects (47 men and 62 women) for the validity study. Distribution in terms of age and schooling among men and women included in the reproducibility and validity studies did not differ signifi cantly from the distributions seen in the entire sample of men and women surveyed by the VIGITEL system in the city of São Paulo in 2005 (chi-square test with 5% signifi cance level).
We evaluated indicators of food and beverage intake associated with protection or increased risk of NTCDs. Factors associated with protection were daily or almost daily (≥ 5 days per week) intake of fruit, vegetables (including greens and other vegetables but excluding tubers such as potato and manioc), as well as fruit and vegetables combined. Indicators associated with risk were frequent intake (thus referred by the subject) of foods rich in saturated fats (red meet with excess fat without removal of visible fat or poultry with skin, and whole milk), daily or almost daily intake of non-sugar-restricted soft drinks (at least one can in ≥ 5 days per week) and abusive intake of alcoholic beverages (ingestion of over four doses for women or over fi ve doses for men in a same day during the last 30 days, considering one dose of alcoholic beverage as equivalent to one beer, one glass of wine, or one dose of distilled spirits).
For the reproducibility study, subjects were contacted by phone seven to 15 days after having participated in the system’s original interview, when they were asked to respond once again to the block of questions on food and beverage intake. The second interviewer was always different from that which had conducted the fi rst interview. The results obtained in the two interviews were compared in terms of the proportion of subjects exposed and the agreement between the individual classifi cation of each subject with respect to exposure or not to the factor under study. In this latter case, the degree of agreement between the two interviews was evaluated using the kappa coeffi cient, classifi ed as fol-lows: above 0.80, almost perfect agreement; between 0.61 and 0.80, substantial agreement; between 0.41 and 0.60, moderate agreement; between 0.21 and 0.80, fair agreement; and below 0.21, slight agreement.5
referred to weekdays, and one to a Saturday, Sunday, or holiday. This 24-hour recall consisted in requesting that the subject inform the type and amount of food and drink consumed in the last 24 hours.1 If the spontaneous
report failed to contain mention of consumption of one or more of the items of interest (fruit, vegetables, red meat, poultry, milk, soft drinks, and alcoholic bever-ages), we asked the subject directly about the occasional consumption of the item or items not mentioned.
In the case of red meat, we asked subjects whether there was any visible fat in the portion served, and whether or not this fat was ingested. For poultry, we asked whether skin was present in the serving and whether or not it was ingested. For milk, we asked whether it was whole, reduced fat, or fat free. For soft drinks, we asked about the amount and type ingested (with or without sugar restriction), and for alcoholic beverage consumption, we asked about the amount of doses ingested.
The validity study consisted in comparing results ob-tained in the standard VIGITEL telephone interview with the three 24-hour recalls (gold-standard) in terms of the proportion of individuals exposed to the factor of interest and the accuracy of the telephone interview in classifying individuals based on their true exposure status as determined by the gold-standard. We consid-ered as truly exposed to daily or almost daily intake of fruit, vegetables, and soft drinks subjects with recorded consumption of these items in at least two out of three 24-hour recalls. In the case of frequent intake of red meat without removal of visible fat, poultry with skin, or whole milk, we considered as exposed subjects with recorded consumption of these items in at least one of three 24-hour recalls. We considered as exposed to abusive intake of alcoholic beverages subjects that reported daily consumption of more than four (women) or more than fi ve (men) doses in at least one of three 24-hour recalls.
To evaluate the ability of the telephone interview to correctly classify individuals truly exposed to the fac-tor according to the gold-standard, we calculated the proportion of these subjects diagnosed as exposed in the telephone interview (sensitivity of the telephone interview). To evaluate the telephone interview’s abil-ity to correctly classify subjects truly unexposed to the factor as established by the gold-standard, we calculated the proportion of these subjects that were not diagnosed as exposed in the telephone interview (specifi city of the telephone interview).
In addition, based on the three 24-hour recalls, we estimated the weekly frequency of intake (days per week) of each of the foods and drinks of interest for each subject. We thus multiplied by 2.5 the number of weekdays, and by 2.0 the number of Saturdays, Sundays, or holidays, with recorded consumption for each type of food and drink. We then calculated, by
interpolation, the median weekly frequency of intake of a given food or drink among subject classifi ed by the telephone interview as either exposed or unexposed to the critical frequency of intake defi ned for that indicator (≥5 days per week for fruit, vegetables, and soft drinks; ≥1 day in the preceding month for abusive intake of alcoholic beverages; and frequent intake for the remaining indicators). The statistical signifi cance of the difference between the two groups was evaluated using the test of difference in medians.7
The study was approved by the Research Ethics Com-mittee of the Faculdade de Saúde Pública da Univer-sidade de São Paulo.
RESULTS
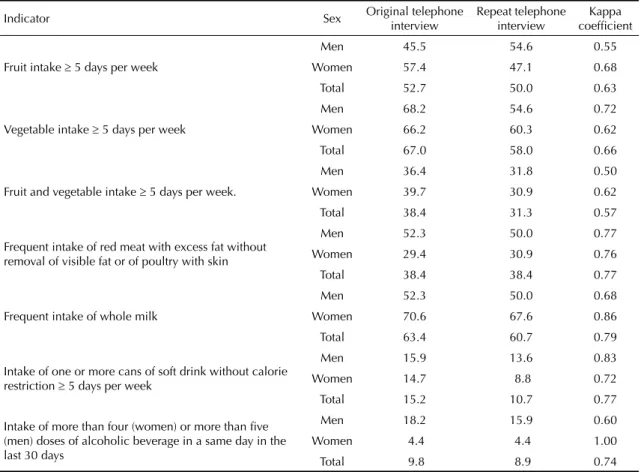
Table 1 compares the frequencies of indicators of food and beverage intake estimated based on the original VIGITEL interviews and on repeat interviews with the same subjects carried out by other interviewers seven to 15 days after the fi rst one. Differences were negligible with respect to intake of foods with high saturated fat content, soft drinks, and alcoholic beverages, and rela-tively minor with regard to fruit and vegetable intake. The kappa coeffi cient indicated “substantial” (0.61 to 0.80) agreement between interviews for all protective and risk factors, with the exception of simultaneous intake of fruit and vegetables, which showed “moder-ate” agreement (kappa = 0.57). There were variations between levels agreement for men and women, but these did not characterize systematic differences ac-cording to gender.
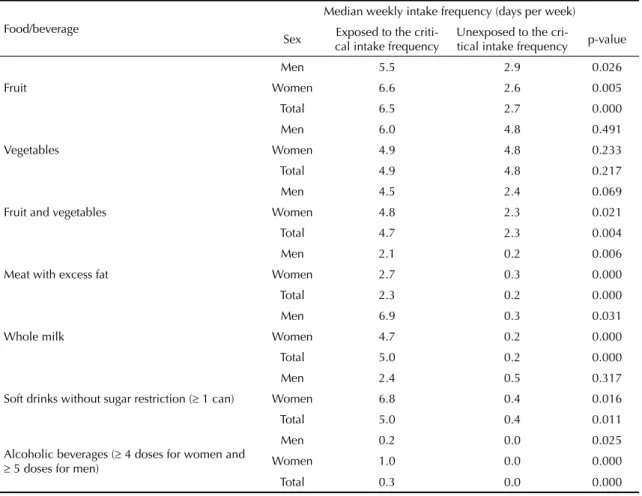
Table 3 presents estimates based on three 24-hour recalls for the median weekly frequency of intake of foods and beverages associated with protection or risk of NTCDs. In this Table, we compare the medians of individuals classifi ed by the telephone interview as exposed or non-exposed to the critical intake frequency defi ned for each of the indicators. We found that median weekly frequency of intake of all foods and beverages was higher in the group of subjects that declared intake higher than the critical frequency in the telephone in-terview. With the exception of vegetables, differences between these subjects and the remainder tended to be substantial and statistically signifi cant (p<0.05).
DISCUSSION
The present study shows that indicators of food and beverage intake obtained by means of telephone interviews through the VIGITEL system have good reproducibility, be it at the collective level (similar frequencies of risk factors in the population obtained through repeated interviews) or individual level (kappa coeffi cients compatible with substantial or moderate agreement in individual classifi cation of exposure to risk factors). The good reproducibility indicates that interviews are conducted in a standardized fashion.
This was expected, given the use of computer-assisted telephone interview system in which the interviewer is induced to read questions to the interviewee, thus avoiding interpretations or answer induction. It also indicates that interviewees understand the questions and have no diffi culty in answering them, providing answers that remain consistent with time. What is expected from a surveillance system such as VIGITEL is the provision of estimates that, in addition to being accurate, are also reproducible, ensuring that time-re-lated variations in indicators translate actual variation in the behavior of the population, rather than instability of the indicators.2,13
The indicators employed yielded results that were in general close to those obtained using a method of greater accuracy. The validity of the indicators was evaluated at both the collective and individual levels. Collectively speaking, there was evidence of a trend towards overestimating the frequency of indicators of intake of fruit and vegetables, which may indicate that subjects are aware of the positive effects of these items on health. However, similar bias was not detected for the intake of items associated with risk. At the indi-vidual level, we found high levels of sensitivity and specifi city for indicators of intake of risk-associated Table 1. Frequency (%) of indicators of food and beverage intake obtained in two successive telephone interviews administered to the same subjects. Municipality of São Paulo, Brazil, 2005.
Indicator Sex Original telephone interview
Repeat telephone interview
Kappa coeffi cient
Fruit intake ≥ 5 days per week
Men 45.5 54.6 0.55
Women 57.4 47.1 0.68
Total 52.7 50.0 0.63
Vegetable intake ≥ 5 days per week
Men 68.2 54.6 0.72
Women 66.2 60.3 0.62
Total 67.0 58.0 0.66
Fruit and vegetable intake ≥ 5 days per week.
Men 36.4 31.8 0.50
Women 39.7 30.9 0.62 Total 38.4 31.3 0.57
Frequent intake of red meat with excess fat without removal of visible fat or of poultry with skin
Men 52.3 50.0 0.77
Women 29.4 30.9 0.76 Total 38.4 38.4 0.77
Frequent intake of whole milk
Men 52.3 50.0 0.68
Women 70.6 67.6 0.86
Total 63.4 60.7 0.79
Intake of one or more cans of soft drink without calorie restriction ≥ 5 days per week
Men 15.9 13.6 0.83
Women 14.7 8.8 0.72
Total 15.2 10.7 0.77
Intake of more than four (women) or more than fi ve (men) doses of alcoholic beverage in a same day in the last 30 days
Men 18.2 15.9 0.60
Women 4.4 4.4 1.00
items (usually close to 80%) and unsteady levels for indicators of fruit and vegetable intake (ranging from 42% to 80%). On the other hand, with the exception of vegetables, the comparison of median weekly intake levels obtained using the three 24-hour recalls indicated expressive and statistically signifi cant differences in favor of subjects classifi ed by the VIGITEL system as exposed to the critical frequency of food or beverage intake. This indicates a good discrimination capacity for the simplifi ed questionnaire used during the telephone interview. Poorer performance in estimating vegetable intake may be due to greater diffi culty among subjects to recognize foods pertaining to this group. In the ver-sion of the questionnaire used by the system in 2007 we attempted to overcome this issue by providing greater detail in the questions on vegetable consumption.
The design employed for assessing reproducibility had no limitations, given that major sources of intra-subject and interviewer variation were accounted for by repeat-ing the same interview with a different interviewer. Moreover, the kappa coeffi cient, used to evaluate the reproducibility of the telephone interview, is the most recommended measure for evaluating reproducibility of instruments that classify individuals as exposed or unexposed to a given condition.14
Common limitations among validity studies involve the use of inadequate gold-standards as well as the use of samples that are not representative of the population to which the indicators will be applied.14 Regarding the
former, it would have been desirable for the present study to extend the gold-standard daily recall question-naires to an entire week, or even a longer period in the case of the indicator of alcohol abuse, which uses a reference period of 30 days. The use of only three daily recalls as a gold-standard may have underestimated the validity of frequency questionnaires employed in VIGI-TEL, given that the measures obtained in frequency questionnaires refer to the subjects’ usual diet whereas daily recalls only estimate the food intake in few and limited days.10 In any case, an increase in the reference
period of daily recalls would likely be unfeasible, and could in fact compromise the quality of individual re-sponses. Carrying out at least three 24 hour recalls in different days of the week is the procedure most widely used as a reference method for the validity evaluation of food frequency questionnaires.1,16
Regarding the representativeness of our sample, the probabilistic selection of studied individuals ensures that the results obtained are applicable to the perfor-mance of VIGITEL throughout the city of São Paulo, Table 2. Frequency (%) of indicators of food and beverage intake among adults estimated based on telephone interview and three 24-hour recalls. Municipality of São Paulo, Brazil, 2005.
Indicator Sex Telephone interview
24-hour recalls
Telephone inter-view sensitivity (%)
Telephone inter-view specifi city (%)
Fruit intake ≥ 5 days per week
Men 42.6 32.2 58.8 66.7
Women 50.0 40.3 80.0 70.3
Total 46.8 38.5 71.4 68.7
Vegetable intake ≥ 5 days per week
Men 55.3 51.1 58.3 47.8 Women 66.1 58.1 72.2 42.3
Total 61.5 55.1 66.7 44.9
Fruit and vegetable intake ≥ 5 days per week
Men 29.8 21.3 40.0 73.0
Women 35.5 29.0 50.0 70.5 Total 33.0 25.7 46.4 71.6
Frequent intake of red meat with excess fat without removal of visible fat or of poultry with skin
Men 46.8 42.6 70.0 70.4
Women 24.2 50.0 41.2 96.8 Total 33.9 46.8 54.9 84.5
Frequent intake of whole milk
Men 66.0 66.0 80.7 62.5
Women 51.6 62.9 79.5 95.7
Total 57.8 64.2 80.0 82.1
Intake of one or more cans of soft drink wi-thout calorie restriction ≥ 5 days per week
Men 8.5 4.3 50.0 93.3
Women 14.5 9.7 100.0 94.6
Total 11.9 7.3 87.5 94.1
Intake of more than four (women) or more than fi ve (men) doses of alcoholic beverage in a same day in the last 30 days
Men 21.3 10.6 60.0 83.3 Women 3.2 1.6 100.0 98.4
but not necessarily to other Brazilian cities where this system is being implemented. In this sense, it will be important to carry out similar studies in at least one state capital of each of the country’s fi ve Great Regions. Two important strengths of the validity assessment conducted by the present study are the provision of esti-mates for the specifi city and sensitivity of the indicators, a recommended procedure given the character of the evaluated indicators ,14 and the comparison of median
weekly intake of food or beverage items among subjects classifi ed as exposed or unexposed to the intake condi-tion defi ned by the indicator of risk or protection.
The majority of studies of reproducibility and validity in food intake surveys compare different data collection instruments and techniques in terms of the amount of
energy, nutrients, and food groups consumed, translated into continuous variables, by applying statistical tech-niques such as correlation tests and tests for differences in means.3,4,11,15 This limits the comparability of these
results to those of the present study. However, in the specifi c case of fruit and vegetable intake, our results on the reproducibility and validity of the VIGITEL indica-tors are similar to those obtained in the United States by another telephone-based surveillance system.10,12
In conclusion, the indicators of food and beverage in-take employed by the VIGITEL system seem reproduc-ible and accurate. Maintaining this system operational in years to come will supply the country with a useful instrument for evaluating public policies for promotion of a healthy diet and for control of diet-related non-transmissible chronic diseases.
Table 3. Weekly frequency of food and beverage intake estimated based on three 24-hour recalls among adults classifi ed by a telephone survey as exposed or unexposed to the critical intake frequency.* Municipality of São Paulo, Brazil, 2005.
Food/beverage
Median weekly intake frequency (days per week)
Sex Exposed to the criti-cal intake frequency
Unexposed to the
cri-tical intake frequency p-value
Fruit
Men 5.5 2.9 0.026
Women 6.6 2.6 0.005
Total 6.5 2.7 0.000
Vegetables
Men 6.0 4.8 0.491
Women 4.9 4.8 0.233
Total 4.9 4.8 0.217
Fruit and vegetables
Men 4.5 2.4 0.069
Women 4.8 2.3 0.021
Total 4.7 2.3 0.004
Meat with excess fat
Men 2.1 0.2 0.006
Women 2.7 0.3 0.000
Total 2.3 0.2 0.000
Whole milk
Men 6.9 0.3 0.031
Women 4.7 0.2 0.000
Total 5.0 0.2 0.000
Soft drinks without sugar restriction (≥ 1 can)
Men 2.4 0.5 0.317
Women 6.8 0.4 0.016
Total 5.0 0.4 0.011
Alcoholic beverages (≥ 4 doses for women and
≥ 5 doses for men)
Men 0.2 0.0 0.025
Women 1.0 0.0 0.000
Total 0.3 0.0 0.000
1. Buzzard M. 24-hour dietary recall and food-record methods. In: Willet W. Nutritional epidemiology. 2. ed. New York: Oxford University Press; 1998. p.50-73.
2. Byers T. Nutrition monitoring and surveillance. In: Willet W. Nutritional Epidemiology. 2. ed. New York: Oxford University Press; 1998. p.347-55.
3. Cardoso MA, Stocco PR. Desenvolvimento de um questionário quantitativo de freqüência alimentar em imigrantes japoneses e seus descendentes residentes em São Paulo, Brasil. Cad Saude Publica. 2000;16(1):107-14. doi:10.1590/S0102-311X2000000100011
4. Cullen KW, Himes JH, Baranowski T, Pettit J, Stevens M, Slawson DL et al. Validity and reliability of a behavior-based food coding system for measuring fruit, 100% fruit juice, vegetable, and sweetened beverage consumption: results from the Girls Health Enrichment Multisite Studies. Prev Med. 2004;38(suppl):S24-33. doi:10.1016/ j.ypmed.2003.05.001
5. Landis JR, Koch GG. The measurement of observer agreement for categorical data. Biometrics. 1977;33(1):159-74. doi:10.2307/2529310
6. Malta DC, Cezário AC, Moura L, Morais Neto OL, Silva Jr JB. Construção da vigilância e prevenção das doenças crônicas não trasmissíveis no contexto do sistema único de saúde. Epidemiol Serv Saude. 2006;15(3):47-64.
7. Menezes RX, Azevedo RS. Bioestatística não-paramétrica. In: Massad E, Menezes RX, Silveira PSP, Ortega NRS. Métodos quantitativos em medicina. São Paulo: Manole; 2004. p. inicial-fi nal.
8. Monteiro CA, Moura EC, Jaime PC, Lucca A, Florindo AA, Figueiredo ICR, et al. Monitoramento de fatores de risco para doenças crônicas não transmissíveis por meio de entrevistas telefônicas. Rev Saude Publica. 2005;39(1):47-57. doi:10.1590/S0034-89102005000100007
9. Monteiro CA, Florindo AA, Claro RF, Moura EC. Validade de indicadores de atividade física e sedentarismo obtidos por inquérito telefônico.Rev Saude Publica. 2008;42(4):575-81.
10. Serdula M, Coates R, Byers T, Mokdad A, Jewell S, Chávez N, et al. Evaluation of a brief telephone questionnaire to estimate fruit and vegetable consumption in diverse study populations. Epidemiology. 1993;4(5):455-63. doi:10.1097/00001648-199309000-00012
11. Slater B, Philippi ST, Fisberg RM, Latorre MR. Validation of a semi-quantitative adolescent food frequency questionnaire applied at a public school in Sao Paulo, Brazil. Eur J Clin Nutr. 2003;57(5):629-35. doi:10.1038/sj.ejcn.1601588
12. Smith-Warner SA, Elmer PJ, Fosdick L, Tharp TM, Randall B. Reliability and comparability of three dietary assessment methods for estimating fruit and vegetable intakes. Epidemiology. 1997;8(2):196-201. doi:10.1097/00001648-199703000-00013
13. Stein AD, Courval JM, Lederman RI, Shea S. Reproducibility of responses to telephone interviews: demographic predictors of discordance in risk factor status. Am J Epidemiol. 1995;141(11):1097-106.
14. Szklo M, Javier Nieto, F. Epidemiology: beyond the basics. Maryland: Aspen; 2004.
15. Thompson FE, Subar AF, Smith AF, Midthune D, Radimer KL, Kipnis V. Fruit and vegetable assessment: performance of 2 new short instruments and a food frequency questionnaire. J Am Diet Assoc. 2002;102(12):1764-72. doi:10.1016/S0002-8223(02)90379-2
16. Willett W, Lenart E. Reproducibility and validity of food-frequency questionnaires. In: Willet W. Nutritional epidemiology. 2. ed. New York: Oxford University Press; 1998. p.101-47.
17. World Health Organization.Reducing risks, promoting healthy life. Geneva; 2002.(The World Health Report, 2002)
REFERENCES