PROBABILISTIC TOOLS FOR ASSESSMENT OF PEST
RESISTANCE RISK ASSOCIATED TO INSECTICIDAL
TRANSGENIC CROPS
Aline de Holanda Nunes Maia1; Durval Dourado Neto2*
1
Embrapa Meio Ambiente, C.P. 69 - 13820-000 - Jaguariúna, SP - Brasil. 2
USP/ESALQ, Depto de Produção Vegetal, C.P. 9 - 13418-900 - Piracicaba, SP - Brasil. *Corresponding author <[email protected]>
ABSTRACT: One of the main risks associated to transgenic crops expressing Bacillus thuringiensis (Bt) toxins is the evolution of pest resistance. The adoption of Bt crops requires environmental risk assessment that includes resistance risk estimation, useful for definition of resistance management strategies aiming to delay resistance evolution. In this context, resistance risk is defined as the probability of the Bt toxin resistance allele frequency (RFreq) exceeding a critical value (CriticalFreq). Mathematical simulation models have been used to estimate (RFreq) over pest generations. In 1998, Caprio developed a deterministic simulation model with few parameters that can be used to obtain RFreq point estimates from point information about model parameters and decision variables involved in that process. In this work, the resistance risk was estimated using Caprio´s model, by incorporating uncertainty to the resistance allele initial frequency (InitialFreq). The main objective was to evaluate the influence of different probability distribution functions on the risk estimates. The simulation results showed that the influence of InitialFreq input distributions on the risk estimates changes along pest generations. The risk estimates considering input Normal distribution for InitialFreq are similar to those ones obtained considering Triangular distribution if their variances are equal. The use of Uniform distribution instead the Normal or Triangular due to the lack of information about InitialFreq leads to an overestimation of risk estimates for the initial generations and sub estimation for the generations after the one for which the critical frequency is achieved.
Key words: Bacillus thuringiensis, Bt crops, modeling, uncertainty analysis
MÉTODOS PROBABILÍSTICOS PARA QUANTIFICAÇÃO DE
RISCO DE RESISTÊNCIA DE PRAGAS A CULTURAS
TRANSGÊNICAS INSETICIDAS
RESUMO: Um dos principais riscos associados às culturas inseticidas que expressam toxinas da bactéria Bacillus thuringiensis (Bt) é a evolução de resistência em pragas alvo. A adoção das culturas Bt requer avaliações prévias de impacto ambiental que incluem quantificação desse risco, informação útil para definição de estratégias de manejo para retardar o processo de evolução da resistência. O risco de resistência é definido como a probabilidade de a freqüência do alelo de resistência à toxina Bt (RFreq) na população da praga alvo ser superior a um valor crítico (CriticalFreq). Modelos matemáticos de simulação têm sido utilizados para estimar RFreq ao longo das gerações da praga. Em 1998, Caprio desenvolveu um modelo determinístico, com poucos parâmetros, que produz estimativas pontuais de RFreq a partir de informações também pontuais sobre os parâmetros e variáveis de decisão envolvidos no processo. Neste trabalho, o risco de resistência foi estimado utilizando o modelo de Caprio, incorporando-se incerteza ao parâmetro freqüência inicial do alelo de resistência (InitialFreq). Avaliou-se o efeito de diferentes distribuições de InitialFreq sobre as estimativas de risco. Observou-se que essas estimativas são afetadas pela distribuição de InitialFreq de modo diferenciado ao longo das gerações. As estimativas obtidas considerando a distribuição Normal são similares àquelas considerando a distribuição Triangular quando as referidas distribuições têm a mesma variância. O uso da distribuição Uniforme, em vez da Normal ou Triangular, leva à superestimação das estimativas de risco de resistência nas gerações iniciais e subestimação nas gerações subseqüentes àquela em que a CriticalFreq é atingida.
Palavras-chave: Bacillus thuringiensis, culturas Bt, modelagem, análise de incertezas
INTRODUCTION
Over the last few decades, genes originating from the soil bacteria Bacillus thuringiensis (Bt), which
insecti-cidal transgenic plants (Andow & Hutchison, 1998). One of the main environmental risks associated with insecti-cidal transgenic crops is the evolution of resistance in tar-get pests. Pest resistance is defined as the evolved capac-ity of an organism to survive in response to selective pres-sure from expopres-sure to a pesticide (ILSI/HESI, 1998). Pest resistance evolution to Bt toxins expressed in transgenic plants is affected by many inter-related bioecological fac-tors (ILSI/HESI, 1998). Because of the complexity of this process, field experiments to investigate large-scale re-sistance are virtually impossible (Peck et al., 1999). Simu-lation models are one of the few sound scientific ap-proaches that allow the integration of bioecological knowledge available for assessing risk of resistance evo-lution.
Models that simulate pest resistance evolution to crops expressing Bt toxins are based on operational factors, target pest ecology and population genetics. Op-erational factors comprise traits of the Bt crop and crop management practices, including pest management op-tions.
Refuge strategy is the core management option proposed for delaying resistance evolution in Bt crops (Andow & Hutchison, 1998; ILSI/HESI, 1998). The ref-uges are constituted by non Bt host plants areas for habi-tation and immigration of susceptible target pests (Whalon & Norris, 1999). Such strategy may be an ef-fective way to reduce selection pressure on the pest popu-lation.
The deterministic Caprio´s model requires infor-mation on parameters such as initial frequency of resis-tance alleles (InitialFreq), gene expression and fitness of
the different pest genotypes. Since the information about those parameters has a high level of associated uncer-tainty, a realistic approach to that process requires tools that incorporate the stochastic character of such informa-tion.
Spatially explicit stochastic models have been developed to simulate the evolution of resistance (Caprio, 1998b; Peck et al., 1999). In these models, the simula-tion is carried out considering an area subdivided into patches. The events related to the target pest biology and ecology, such as oviposition and dispersal, are treated as stochastic events in each patch. If little information is available about the spatial processes involved, mainly those ones related to detailed spatial characterization of dispersal, the use of such models is not feasible. Even simple parsimonious deterministic models still require information about parameters that, depending on the stage of knowledge about the pest, can be extremely imprecise. The resistance allele initial frequency in the target pest population (InitialFreq) is one of the key parameters for
the models that simulate the evolution of resistance: the process will take place more rapidly when the InitialFreq
is high, although this relation is not linear. Recent
stud-ies suggest that, at least in some specstud-ies of Lepidoptera, the InitialFreq ranges from 10-4 to 10-3 (Gould et al., 1997;
Bourguet et al., 2003).
Probabilistic risk assessment requires tools that allow incorporation of parameters’ stochasticity into de-terministic models. Uncertainty analysis can be used to take into account such stochastic character (Abrahamsson, 2002). Briefly, uncertainty analysis comprises a set of sto-chastic input parameters characterized by input probabil-ity distributions, a model that integrates the information about the processes modeled and their interrelations. Probability distributions of output variables are produced through interactive methods (Iman & Conover, 1982), (Anderson & Hattis, 1999; Frey & Burmaster, 1999; Hoffman & Kaplan, 1999). The output distributions are used to describe the set of possible values for a particu-lar output variable (Y) and allow estimation of probabi-listic functions, such as Y distribution percentiles or prob-ability of Y exceed previously stated critical values.
The purposes of this study were: to demonstrate how uncertainty analysis can be used in the context of resistance risk assessment and, to investigate the influ-ence of different InitialFreq input probability distributions
on resistance risk estimates.
MATERIAL AND METHODS
Caprio’s deterministic model was chosen for un-certainty incorporation (Caprio, 1998a) and was devel-oped to simulate resistance evolution considering a sim-plified approach, with a small number of parameters when compared to the stochastic spatial model (Caprio, 1998b) approach. Caprio (2001) discuss the use of both stochas-tic and determinisstochas-tic Caprio´s models.
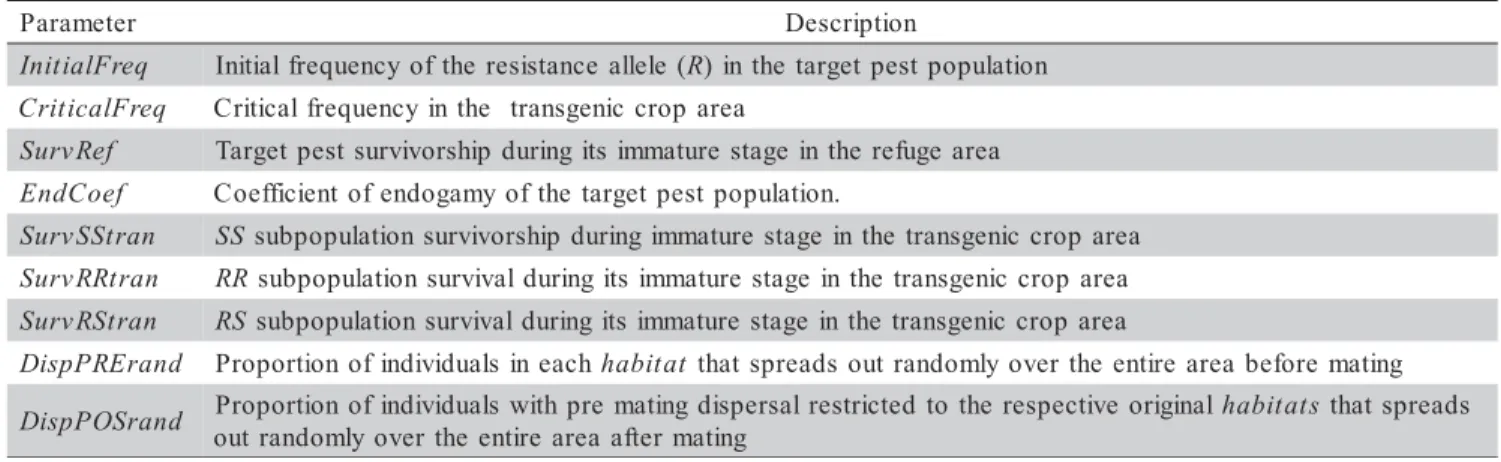
Due to its simplicity and parsimony, the determin-istic model allows rapid simulation of scenarios for a high number of combinations of parameter values. This model requires information related to the Bt toxin expression in the transgenic plant, the target pest bioecology and the pest management strategy to be adopted (Table 1). Dif-ferent scenarios can be constructed by varying parameter and/or decision variables values. Decision variables are related to operational factors influencing the evolution of resistance.
The main decision variable in this model is the proportion of the total crop area occupied used as refuge (RefugeArea). Other decision variables such as spraying
For all scenarios (Table 2), it was assumed that the spatial arrangement of the refuge is such that the dis-persal rate before and after mating are maximum (DispPRErand=1, DispPOSrand=1). The EndCoef value
was set to zero.
The number of generations up to the critical fre-quency is reached (Nger*) and the RFreq values for the
generation following the Nger* were estimated for
sce-narios I, II and II using a version of Caprio’s determinis-tic model implemented with the RRiskBt software,
devel-oped by the authors in the Visual Basic language. Sensitivity analysis of the RFreq estimates was
performed to indicate the main parameter to be treated as random variable in the uncertainty analysis. The re-sponse of RFreq estimates at the end of each generation
and and Nger* to variations in InitialFreq and functional
dominance of resistance (DFRes)values was quantified.
The parameters related to the survival of the tar-get pest depend on the DFRes that has already been taken
into account in the sensitivity analysis. The dispersal in-dexes (DispPRErand and DispPOSrand) are more related
to operational factors (size and arrangement of the ref-uge), and therefore they were not taken into account in this analysis.
The effect of the probability distribution used for characterizing the parameter uncertainty indicated by the sensitivity analysis on the resistance risk estimates were evaluated in situations where the transgenic crop ex-presses the Bt toxin at a high dose for the target pest un-der consiun-deration. The resistance risk in the target pest population was estimated for different scenarios by vary-ing the size of the refuge area.
The probability distributions used for the charac-terization of the uncertainty associated with InitialFreq
were Uniform, Symmetrical Triangular and Symmetrical Truncated Normal. Those distributions have been chosen for their ease of parameterization based on subjective in-formation.
Based on theoretical assumptions regarding the balance between mutation and selection, Bourguet et al. (2003) estimated the probability of InitialFreq to exceed
10-3 in a given population as ranging between 40 and 70%.
Considering that information, the range for InitialFreq
was set to (0.2 × 10⁻³), common to all distributions. As
all distributions considered were symmetrical, the mean (µ=1.0 × 10⁻³) is equal to the median, and therefore the
probability of InitialFreq being less than 10-3 is 50%,
what is consistent with the 40-70% interval.
For the Uniform and Triangular Symmetrical dis-tributions, the values of standard deviation (std) are
0.5773 × 10⁻³ and 0.4082 × 10⁻³, respectively. For both
dis-tributions the std is function of the previously chosen
dis-tribution domain bounds a and b. For the Truncated
Nor-mal distribution, the standard deviation was set to a value similar to that one used for Triangular distribution.
The following steps were followed to estimate resistance risk over generations in each scenario: (i) thou-sand values of InitialFreq were sampled from the
Uni-form distribution (a,b); (ii) for each value of InitialFreq
sampled, the RFreq at the end of each pest generation was
estimated using the deterministic model; considering the
r e t e m a r a
P Description
q e r F l a i t i n
I Initialfrequencyoftheresistanceallele (R)inthetargetpestpopulation
q e r F l a c i t i r
C Criticalfrequencyinthe transgeniccrop area
f e R v r u
S Targetpestsurvivorshipduringits immaturestage intherefugearea
f e o C d n
E Coefficientofendogamyofthetargetpestpopulation.
n a r t S S v r u
S SSsubpopulationsurvivorship duringimmaturestageinthetransgeniccroparea
n a r t R R v r u
S RRsubpopulationsurvivalduringitsimmaturestageinthe transgeniccroparea
n a r t S R v r u
S RSsubpopulationsurvivalduringits immaturestage inthetransgeniccroparea
d n a r E R P p s i
D Proportionofindividuals ineachhabitat thatspreadsoutrandomlyover the entirearea beforemating
d n a r S O P p s i
D Proportionofindividuals withprematingdispersalrestrictedto therespective originalhabitatsthatspreads g n i t a m r e t f a a e r a e r i t n e e h t r e v o y l m o d n a r t u o
Table 1 - Target pest bioecological parameters of Caprio’s deterministic model.
Table 2 - Scenarios used for resistance allele frequency (RFreq) empirical distributions generation
resulting from combinations of target pest survival index (SurvRef, %) during the immature stage in
the refuge area (RefugeArea, %).
o i r a n e c
S RefugeArea Distribution SurvRef
I
0 Uniform
-0 SymmetricTriangular
-0 SymmetricTruncatedNormal
-I I
5 Uniform 100
5 SymmetricTriangular 100
5 SymmetricTruncatedNormal 100
I I I
0
2 Uniform 201
0
2 SymmetricTriangular 20
0
input data presented in Table 2; and (iii) the probability of RFreq to exceed the critical frequency of 0.50 by the
end of each pest generation - a measure that quantifies the risk of resistance - was estimated using the respec-tive RFreq empirical probability distributions. The same
process was repeated for the Symmetrical Triangular and Symmetrical Truncated Normal distributions.
The sensitivity and uncertainty analysis were per-formed using specific algorithms implemented into the
RRiskBt software.
RESULTS AND DISCUSSION
Deterministic model
In the scenarios I (0% refuge), II (5% refuge) and III (20% refuge) and insecticide application (III), RFreq
exceeded the value 0.50 up to 4, 43 and 41 generations of the target pest (Nger*), respectively. The RFreq
esti-mates for these generations were 0.9759, 0.7477, and 0.6889. For generations immediately prior to Nger*, the
estimates were 0.1964, 0.3070, and 0.2644, respectively. The RFreq estimates corresponding to the Nger* obtained
by using the deterministic model are closely related to the empirical RFreq medians obtained with the probabilistic
model. All these predictions are valid for the specified set of parameters and decision variables used and depend on the adequacy of simulation model assumptions.
The sensitivity analysis of the Caprio’ s determin-istic model showed that the RFreq and NGer* predictions
are highly influenced by variations in InitialFreq and DFRres. Similar results were also reported by Ru et al.
(2002) and Storer et al. (2003). Comparisons among point predictions obtained from different models are possible only when similar scenarios are considered. Hence, to compare models performance, it would be necessary to develop comparative studies specifically planned for this purpose. Also, comparison among sensitivity of the pre-dictions coming from different models is often method-ologically not feasible due to the diversity of scenarios used. The sensitivity of model outputs to variations of a particular parameter is influenced by the fixed values set for the other parameters. Because of that, the use of mul-tiple sensitivity analysis (Abrahamssom, 2002) is recom-mended, because it allows taking interactions into account. Sensitivity analysis of Caprio’s deterministic model (1998a) pointed out that RFreq and NGer*
esti-mates are more sensitive to variations in InitialFreq than
the ones in DFres, considering the ranges established for
those parameters. Therefore, the incorporation of uncer-tainty into the model was performed treating the
InitialFreq parameter as a random variable.
Resistance risk estimates in different scenarios
The curves describing the target pest resistance risk over generations for the scenarios I, II and III,
con-sidering the Uniform (UN), Symmetrical Triangular (ST) and Symmetrical Truncated Normal (STN) distributions, are presented in Figure 1. The curves corresponding to Triangular Symmetric and Normal input distributions are quite similar. For Uniform distribution, the risk is over-estimated in relation to the other distributions up to the
NGer* generation. For the subsequent generations, the
relation is inversed.
For the UN distribution, the probability associ-ated with upper tail of the InitialFreq input distribution
is greater than the one for the STN or ST distributions. This leads to a high proportion of high InitialFreq values in the
sample taken from the input distribution considered for uncertainty analysis. Thus, in the model runs correspond-ing to those upper tail InitialFreq values, the CriticalFreq
is reached in few generations. This results in a high pro-portion of RFreq values greater than CriticalFreq and
con-sequently resistance risk estimates for the first generations when using UN distribution are higher than the ones for St or STN distributions. On the other hand, for generations subsequent to NGer*, the high probability associated to the InitialFreq distribution upper tail in the Uniform
distribu-tion results in risk estimates lower than those obtained when STN or ST distributions were used. After the gen-eration where RFreq estimate for UN distributionis
supe-rior to 0.99, all risk estimates become equal regardless the
InitialFreq input distribution.
The type of distribution used to characterize the uncertainty associated with model parameters is crucial in risk estimation, since the probabilities associated to dis-tribution tails strongly influence risk estimates. Param-eters characterized by distributions with similar measures of central tendency, but different shapes, may result in very unlike risk estimates.
A relevant characteristic of this approach is that the uncertainty associated with a given parameter can be based on expert opinion. Advances in knowledge about the model parameters can be incorporated into the analy-sis by changing the input probability distribution func-tions. This is particularly important for the risk resistance evolution to Bt toxins in situations where there are con-siderable knowledge gaps on model parameters for most of key target pests.
The approach we are proposing allows risk quan-tification differently from the one based on using deter-ministic models only. Such estimates are expressed as the probability of RFreq exceeding a critical frequency; by
using deterministic models, only point RFreq estimates
can be obtained. Using these tools, pest resistance
man-agement strategies can be established aiming to minimize the risk of resistance evolution.
CONCLUSIONS
The use of the Uniform distribution, instead of Normal or Triangular due to the lack of information on
InitialFreq, leads to the overestimation of resistance risk
estimates for the beginning generations and underestima-tion in generaunderestima-tions after the critical frequency is reached. The uncertainty analysis allows estimation of the pest generation for which the resistance risk is over 0.99, regardless the distribution used to characterize the uncer-tainty associated with InitialFreq.
REFERENCES
ABRAHAMSSOM, M. Uncertainty in quantitative risk analysis –
characterization and methods of treatment. Lund: Lund University, 2002. (Report, 1024).
ANDERSON, E.L.; HATTIS, D. Foundations: uncertainty and variability.
Risk Analysis, v.19, p.47-49, 1999.
ANDOW, D.A.; HUTCHISON, W.D. Bt-corn resistance management. In: MELLON, M;. RISSLER, J. (Ed.) Now or never: serious new plans to save a natural pest control. Cambridge: Union of Concerned Scientists, 1998. p.18-64.
BOURGUET, D.; CHAUFAUX, J.; SÉGUIN, M.; BUISSON, C.; HINTON, J.L.; STODOLA, T.J.; PORTER, P.; CRONHOLM, G.; BUSCHMAN, L.L.; ANDOW, D.A. Frequency of alleles conferring resistance to Bt maize in French and US corn belt populations of the European corn borer, Ostrinia nubilalis. Theoretical and Applied Genetics, v.106,
p.1225-1233, 2003.
CAPRIO, M.A. Non random mating model. 1998a www.msstate.edu/ Entomology/ PgJava/ ILSI model.html. (27 jul. 2003).
CAPRIO, M.A. Evaluating resistance management for multiple toxins in presence of external refuges. Journal of Economic Entomology, v.91, p.1021-1031, 1998b.
CAPRIO, M.A. Source-sink dynamics between transgenic and non-transgenic habitats and their role in the evolution of resistance. Journal of Economic Entomology, v.94, p.698-705, 2001.
FREY, H.C.; BURMASTER, D.E. Methods for characterizing variability and uncertainty: comparison of bootstrap simulation and likelihood based approaches. Risk Analysis, v.19, p.109-130, 1999.
GOULD, F.; ANDERSON, A.; JONES, A.; SUMMERFORD, D.; HECKEL, D.G.; LOPEZ, J.; MICINNSKI, S.; LEONARD, R.; LASTER, M. Initial frequency of alleles for resistance to Bacillus thuringiensis toxins in
field populations of Heliothis virescens. Proceedings of the National Academy of Sciences of the United States of America, v.94, p.3529-3523, 1997.
HOFFMAN, F.O.; KAPLAN, S. Beyond the domain of direct observation: how to specify a probability distribution that represents the ’state of knowledge’ about uncertainty inputs. Risk analysis, v.19, p.131-134, 1999.
IMAN, R.L.; CONOVER, W.J. A distribution free approach to inducing rank correlations among input variables. Communications in Statistics, v.B11, p.311-334, 1982.
INTERNATIONAL LIFE SCIENCE INSTITUTE – HEALTH AND ENVIRONMENTAL SCIENCE INSTITUTE. An evaluation of the insect resistance management in Bt field corn - a science based framework for risk assessment and risk management:report of an expert panel. Washington: ILSI Press, 1998. 78p.
PECK, S.L.; GOULD, F.; ELLNER, P.S. Spread of resistance in spatially extended regions of transgenic cotton: implications for management of
Heliothis virescens (Lepidoptera: Noctuidae). Journal of Economic Entomology, v.92, p.1-16, 1999.
RU, L.; ZHAO, J-Z.; RUI, C. A simulation model for adaptation of cotton bollworm to transgenic Bt cotton in North China. Acta Entomologia Sinica, v.45, p.153-159, 2002.
STORER, N.P.; PECK, S.L.; GOULD, F.; VAN DUYN, J.W.; KENNEDY, G.G. Sensitivity analysis of spatially-explicit stochastic simulation model of the evolution of resistance in Helicoverpazea (Lepidoptera:
Noctuidae) to Bt transgenic corn and cotton. Journal of Economic Entomology, v.96, p.173-187, 2003.
WHALON, M.E.; NORRIS, D.L. Managing target pest adaptation – the case of Bt transgenic plant deployment. In: COHEN, J.E. (Ed.) Managing agricultural biotechnology – assessing research program needs and policy implications. Wallingford: CAB Internacional, 1999. p.194-205.