Ar
ti
cl
e
0103 - 5053 $6.00+0.00
*e-mail: [email protected]
Development and Validation of a Method using SPE and LC-ESI-MS-MS for the
Determination of Multiple Classes of Pesticides and Metabolites in Water Samples
Adriana Demoliner, Sergiane S. Caldas, Fabiane P. Costa, Fábio F. Gonçalves, Rosilene M. Clementin, Márcio R. Milani and Ednei G. Primel*
Post-graduation Program in Technological and Environmental Chemistry, Escola de Química e Alimentos, Universidade Federal do Rio Grande - FURG, Av Itália, km 8 s/n,
96201-900 Rio Grande-RS, Brazil
Um método analítico baseado na extração em fase sólida e cromatograia líquida acoplada à espectrometria de massas tandem (LC-ESI-MS-MS) foi desenvolvido e validado para a determinação e conirmação de dezoito agrotóxicos (herbicidas, inseticidas e fungicidas) e dois metabólitos em amostras de água. Os limites de detecção variaram de 0,4 a 40,0 ng L-1 e os limites de quantiicação de 4,0 a 100,0 ng L-1. Foi obtida boa linearidade, com r2 > 0,99 para todos os compostos. As recuperações, para 95% dos compostos, variaram de 70 a 120%, com RSDs menores que 21% para todos. Através do monitoramento de reações múltiplas (MRM), foram selecionadas duas diferentes transições íon precursor-íon produto para cada agrotóxico. A metodologia proposta pode ser usada para a determinação de resíduos de agrotóxicos em águas de superfície e potável, em concordância com a Lei n° 518 do Ministério da Saúde, Brasil, e com os parâmetros da União Européia para água potável (Directive 98/83/EC).
An analytical method using solid-phase extraction and liquid chromatography coupled to electrospray ionization tandem mass spectrometry (LC-ESI-MS-MS) was developed and validated for the determination and conirmation of eighteen polar pesticides (herbicides, insecticides and fungicides) and two metabolites in water samples. The limits of detection varied between 0.4-40.0 ng L-1 and the limits of quantiication between 4.0-100.0 ng L-1. Good linearity with r2 > 0.99 for all compounds was obtained. The recovery for 91% of the accuracy experiments varied from 70 to 120%, with RSD below 21% for all. Through multiple reaction monitoring (MRM) two different precursor ion-product ion transitions were selected for each pesticide. The proposed methodology can be used for the convenient and effective determination of pesticide residues in surface and drinking waters in accordance with Law No. 518 ofthe Ministry of Health, Brazil, and the European Union Directive on drinking water quality (98/83/EC).
Keywords: validation, SPE, LC-ESI-MS-MS, pesticides, metabolites, water
Introduction
In the last decades, agriculture has been making a great effort to increase food production because of the population growth. Since the beginning of its development, agriculture has been directly related to pesticide application: it stands out as the main way to control pests, plagues and weeds which attack agricultural products, harming crops and reducing productivity.1,2 On one hand, pesticides play
an important role in protecting crops, but, on the other hand, its indiscriminate use continues to cause many serious problems for the environment and human health.3-5
Nowadays, pesticide monitoring in waters, both in natural ones and in the ones destined for public supply, is a major issue.
According to the literature, a pesticide is able to contaminate groundwater if its solubility in water is higher than 30 mg L-1, its K
OC(organic carbon partition
coeficient) is lower than 300 mL g-1, its K
d(distribution
adsorption constant) is lower than 5 mL g-1 and its soil
for individual pesticides and 0.5 µg L-1 for the sum of
all pesticides.6 In the case of surface waters that will be
destined for human consumption, the limits are 1.0 µg L-1
for individual pesticides and 5.0 µg L-1 for the total of
pesticides.7,8 In Brazil,the Ministry of Health has set
responsibilities regarding the control and monitoring of water quality and its potability for human consumption. Some of the pesticides selected for this study are regulated by the law which establishes that up to 300 µg L-1 are
accepted for some pesticides, such as the herbicide bentazone; 30 for 2,4-D; 20 for propanil and 2 µg L-1 for
simazine and atrazine.9
To assess the impact of pesticides on aquatic ecosystems, analytical methods are required for simultaneous determination of such compounds at trace concentrations in water samples.10 Those compounds are usually analyzed
by gas chromatography (GC) and by liquid chromatography (LC), depending on their polarity, volatility and thermal stability.11,12 In GC, different detection systems are used,
such as electron-capture detection (ECD),13
nitrogen-phosphorus detection (NPD),14,15 lame ionization detection
(FID),16 lame photometric detection (FPD),17 and mass
spectrometry (MS).18,19 As most modern pesticides and their
degradation products are polar, have low volatility, and/or are thermally labile compounds, the general use of liquid chromatography-based methods for pesticide determination has increased.20
In the LC pesticide analysis, luorescence and diode-array detections (DAD)21-25 have been used as detection
techniques. However, in the last decades, the use of detection systems, MS or tandem (MS-MS) has increased the sensitivity and speciicity of the methods, and for this reason, applications using LC-MS-MS became the most common tool to analyze and monitor contamination by pesticides.26-39
Nowadays, mass spectrometry is the best detection technique for chromatography because spectrometry is sensitive to a small amount of analyte. It supplies quantitative and qualitative information about the compounds that are eluted from the column, and it can distinguish different substances with the same retention time.2,40
Due to the low detection levels required by regulatory bodies and the complex nature of the matrices in which the target compounds are present, eficient sample preparation and trace-level detection and identiication are important aspects of analytical methods. Sample preparation, such as extraction, concentration and isolation of analytes, has great inluence on the reliability and the accuracy of the analysis. In recent years, many innovations in the analytical processes, which can be applied to prepare food and environmental samples for extraction and determination of
pesticide residues, have been developed.12 For this purpose,
solid-phase extraction (SPE) has been widely used for extraction of water samples prior to analysis. SPE reduces sample handling, labor, and solvent consumption.12,41
This study reports a simple, relatively fast, and eficient SPE and LC-ESI-MS-MS method which was developed to determine eighteen pesticides from different classes (herbicides, insecticides and fungicides) and two metabolites in water samples. The selection of the pesticides was based on their extensive use in rice plantations in Brazil and the risk of reaching water bodies, including drinking water resources. To obtain eficient pre-concentration with good precision and recovery, a C18 solid-phase extraction system was applied. The method was validated and the parameters involved in the validation were calibration, linearity and range, limit of detection (LOD) and quantiication (LOQ), precision (repeatability and intermediate precision), and accuracy (recovery).
Experimental
Reagents and chemicals
In this study, high purity standards of eighteen pesticides were selected: clomazone, tebuconazole, diuron, irgarol, atrazine, simazine, metsulfuron-methyl, quinclorac, 2,4-D, pyrazosulfuron-ethyl, bentazone, pronanil, carbofuran and the two metabolites: 3,4-DCA and carbofuran-3-hidroxy, which derive from propanil and carbofuran, respectively, were purchased at Sigma Aldrich (São Paulo, Brazil). Imazethapyr, imazapic, ipronil, bispyribac-sodium and penoxsulam were purchased at Dr. Ehrenstorfer GmbH (Augsburg, Germany). Methanol and acetonitrile of chromatographic grade were supplied by Mallinckrodt (Phillipsburg, NJ, USA). Phosphoric acid (85%) of analytical grade was purchased at Merck (Darmstadt, Germany). Ultra pure water was produced by a Direct-Q UV3® system (Millipore, Bedford, MA, USA). The SPE
extraction tubes were Chromabond C18ec, 500 mg per 3 mL (Macherey-Nagel, Düran, Germany).
Individual pesticide stock solutions containing 1000 mg L-1of the target compounds were prepared in
methanol and stored at −18 °C. Intermediate working standard mixtures in methanol, containing 100 mg L-1 for
each pesticide were prepared and they were employed to make the working standard solution containing 10 mg L-1;
Liquid chromatography separation
Analyses were performed on a Waters Alliance 2695 Separations Module HPLC, equipped with a quaternary pump, an automatic injector and a thermostatted column compartment (Waters, Milford, MA, USA). The chromatographic separation was performed with an XTerra® MS C18 (3.0 mm × 50 mm i.d., 3.5 µm
ilm thickness) column Waters (Milford, MA, Ireland). The mobile phase components are (A) ultra-pure water +0.01% formic acid, (B) acetonitrile +0.01% formic acid, and (C) pure methanol in the proportion 46:24:30 (v/v/v), respectively, with elution in isocratic mode at a low rate 0.5 mL min-1 resulting in a 10 min run
time. The temperature of the column compartment was set to 20 ºC. The injection volume was 20 µL for samples after the pre-concentration step by SPE.
Tandem mass spectrometry detection
A Quattro micro API (triple quadrupole) mass spectrometer, equipped with a Z-spray electrospray (ESI) ionization source, from Micromass (Waters, Milford, MA, USA) was used. Drying gas, as well as nebulizing gas, was nitrogen generated from pressurized air in a NG-7 nitrogen generator (Aquilo, Etten-Leur, NL). The nebuliser gas low was set to 50 L h-1 and the gas low desolvation,
to 350-550 L h-1.
For operation in the MS-MS mode, collision gas was Argon (White Martins, Rio Grande do Sul, Brazil) with a pressure of 3.5 × 10⁻³ mbar in the collision cell. The
optimized values were: capillary voltages, 4 kV; extractor voltage, 2 V; source temperature, 100 ºC; desolvation temperature, 350 ºC; multiplier, 600 V; and the scan range, 50-500 m/z.
Optimization of the MS-MS conditions, choice of the ionization mode, identification of the precursor/ parent and product ions, and selection of the cone and collision voltages, most favorable for the analysis of the target analytes, were performed with injection of their individual standard solutions by recording in both negative and positive modes of ionization, full scan and product ion mass spectra at different values of cone and collision energies, respectively. Direct infusion of every individual standard pesticide solutions in the concentration of 1 µg mL-1 in methanol was performed
at a low rate of 10 µL min-1 using a Model 11 single
syringe pump (Harvard Instruments, Holliston, MA, USA). Analytical instrument control, data acquisition and treatment were performed by software MassLynx, version 4.1 (Micromass, Manchester, UK).
After the optimization of the collision cell energy of the triple quadrupole, two different precursor ion-product ion transitions were selected for each pesticide, one for quantiication and one for qualiication, and these ions were monitored under time-scheduled multiple reaction monitoring (MRM) conditions.
Method validation
The analytical curves and the linearity of the detector response for the test compounds were evaluated by injecting in triplicate from six to nine concentration values (ranging from 1.0-500.0 µg L-1) of the standard solutions
prepared in methanol and analyzed by using a least-square regression. Satisfactory linearity was assumed when the determination coeficient (r2) was higher than 0.99 for
all compounds.
Accuracy (recovery) and precision (RSD, %) were evaluated by analyzing surface water samples spiked at six concentration levels (0.004, 0.02, 0.05, 0.1, 0.5 and 2.0 µg L-1), including the LOQ and the last point of the
analytical curve. All experiments were performed in triplicate (n = 9).
The LOD was deined as the lowest concentration that the analytical process could reliably differentiate for a signal-to-noise ratio value from 2.5 to 5.0.42 The LOQ
was established as the lowest concentration level that was fully validated (based on a solution which contains the mix of pesticide standards) and the lowest concentration in each compound was evaluated and could be detected with reliability.
Sample preparation
The samples were pre-concentrated and extracted by SPE tubes containing 500 mg of octadecylsilane (Chromabond C18ec) with an average particle size of 45 µm. A 250 mL volume of surface water samples was fortiied by adding an established volume of stock solution (1.0 mg L-1) of mixture of 18 pesticides and 2 metabolites,
resulting in six levels of fortiication, 0.004, 0.02, 0.05, 0.1, 0.5 and 2.0 µg L-1. Before sample application, the
SPE column was conditioned by passing consecutively 3 mL methanol, 3 mL puriied water, and 3 mL of puriied water acidiied (pH 3.0) with phosphoric acid 1:1 (v/v). After adjusting the pH to 3.0 by adding phosphoric acid, the samples were well mixed and passed through the SPE tubes at 10 mL min-1. After that, the tubes were eluted
Results and Discussion
MS-MS optimization parameters
Considering 20 compounds under study, thirteen showed preferential ionization in the positive mode [M+H]+,
namely, clomazone, diuron, propanil, 3,4-DCA, atrazine,
carbofuran, simazine, carbofuran-3-hidroxy, tebuconazole, imazapic, imazethapyr, irgarol and bispyribac-sodium, as shown in Table 1 whereas the remaining seven compounds showed more eficient ionization in the negative mode [M−H]–, namely, metsulfuron-methyl, quinclorac, ipronil,
penoxsulam, 2,4-D, pyrazosulfuron-ethyl and bentazone. Results are shown in Table 2.
Table 1. Results of the optimized parameters for the compounds analyzed by LC-ESI-MS-MS in the positive mode
Compounds Molar
mass
Transition (m/z) Precursor ion
→ Product ion
Collision energy (eV) Cone voltage (V) tR (min) Function time window (min)
Imazapic 275 276 → 231
276 → 185
20 30
40 40
0.80 1 0.5-7.0
Carbofuran-3-hidroxy 237 238 → 163 238 → 135
15 20
25 25
0.72 1
Irgarol 253 254 → 198
254 → 125
19 26
30 30
1.66 1
Bispyribac-sodium 452 453 → 297
453 → 275
25 22
35 35
3.20 1
Tebuconazole 308 308 → 70
308 → 88
20 50
40 33
5.96 1
Imazethapyr 289 290 → 230
290 → 177
20 20
40 40
0.92 1
Simazine 201 202 → 132
202 → 124
18 18
35 35
1.5 2 1.0 -3.0
Carbofuran 221 222 → 165
222 → 123
20 20
25 25
1.15 2
Atrazine 215 216 → 174
216 → 146
20 22
33 35
1.66 2
3,4-DCA 162 162 → 127
162 → 109
15 25
35 25
1.71 2
Propanil 218 218 → 127
218 → 162
28 14
25 30
2.61 2
Diuron 233 233 → 72
233 → 160
20 25
28 28
1.71 2
Clomazone 240 240 → 125
240 → 100
20 15
25 30
2.14 2
Dwell time: 0.05 s.
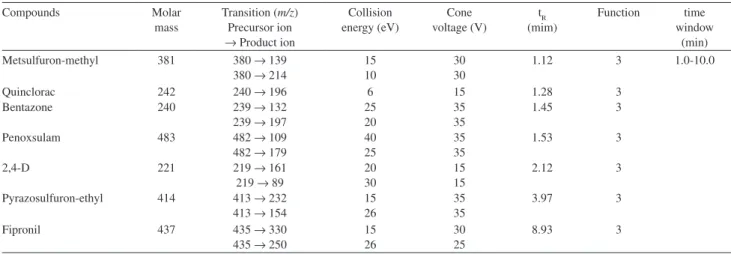
Table 2. Results of the optimized parameters for the compounds analyzed by LC-ESI-MS-MS in the negative mode
Compounds Molar
mass
Transition (m/z) Precursor ion
→ Product ion
Collision energy (eV) Cone voltage (V) tR (mim) Function time window (min)
Metsulfuron-methyl 381 380 → 139
380 → 214
15 10
30 30
1.12 3 1.0-10.0
Quinclorac 242 240 → 196 6 15 1.28 3
Bentazone 240 239 → 132
239 → 197
25 20
35 35
1.45 3
Penoxsulam 483 482 → 109
482 → 179
40 25
35 35
1.53 3
2,4-D 221 219 → 161
219 → 89
20 30
15 15
2.12 3
Pyrazosulfuron-ethyl 414 413 → 232
413 → 154
15 26
35 35
3.97 3
Fipronil 437 435 → 330
435 → 250
15 26
30 25
8.93 3
To carry out the analysis of all compounds in a single run, the electrospray interface was programmed to change the mode of operation, between [M−H]− and [M+H]+, along
the chromatographic analysis.
The development of confirmative method made necessary to acquire two speciic transitions for each compound, at least. The exception was quinclorac due to the dificulty the molecule has to fragment and generate stable ions. So, for quinclorac, only one fragment was found: 240.0 → 196.0 m/z in the negative mode.
An MRM chromatogram obtained from the analysis of a standard mixture of twenty compounds can be observed in Figure 1, which shows the transitions of the compounds used for quantiication. A similar chromatogram can be obtained for the transitions employed for conirmation.
The chromatogram shows that some analytes have the same retention time, such as the pairs carbofuran/ simazine and 3,4-DCA/diuron. However, the technique using LC-MS-MS can solve these problems regarding chromatographic resolution by using the higher selectivity of the mass spectrometer when operating in the MRM mode.
Analytical method validation
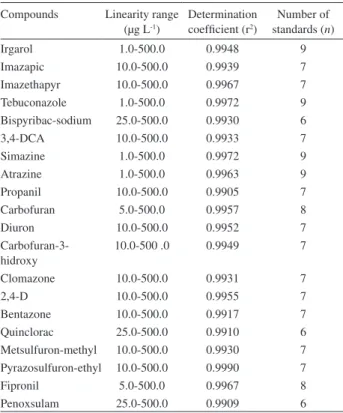
For the linear dynamic range, from six to nine point calibration curves were constructed using a least-square regression analysis in the range 1.0-500.0 µg L-1 for
irgarol, tebuconazole, ipronil, simazine and atrazine; 5.0-500.0 µg L-1 for carbofuran and clomazone;
10.0-500.0 µg L-1 for imazapic, imazethapyr, propanil,
diuron, 3,4-DCA, carbofuran-3-hidroxy, 2,4-D, bentazone, metsulfuron-methyl and pyrazosulfuron-ethyl and 25.0-500.0 µg L-1 for bispyribac-sodium, quinclorac and
penoxsulam. For all compounds determination coeficients were higher than 0.99, showing good results (Table 3).
Limits of detection (LOD) were calculated through the injection of 20 µL standard solutions with an analyte concentration that leads to a signal-to-noise ratio 2.5 to 5.0, following USEPA’s recommendation.46 Instrumental LOD
were determined in 20 compound mix and obtained a range from 0.1 to 10.0 µg L-1. Limits of instrument quantiication
(LOQ), varied from 1.0 to 25.0 µg L-1. By using SPE, the
method pre-concentration factor was 250 times, allowing the LODs and LOQs levels of the compounds investigated in water samples to reach ng L-1accuracy levels.
However, taking into consideration the pre-concentration factor, the LODs for the method varied from 0.4 to 40.0 ng L-1 whereas the intervals of the LOQs changed
from 4.0 to 100.0 ng L-1 (Table 4).
Recovery results
The recovery results obtained for six levels of pesticide concentration under study are shown in Table 5. Extractions in triplicate at each studied concentration level and injections in triplicate (n = 9) were made.
The results showed recovery percentages from 70 to 120% for 95% of the compounds in six fortiication levels. Only a few exceptions showed recoveries under 70%, such as the compounds 3,4-DCA with 65.3% at spike level 0.5 µg L-1; bentazone with 60.2% at spike level 0.1 µg L-1
and pyrazosulfuron-ethyl with 65% at spike level 2.0 µg L-1.
For recoveries higher than 120%, imazapic showed 136.4% at spike level 2.0 µg L-1, imazethapyr 136.3% and 123.1% at
spike levels 2.0 and 0.05 µg L-1,respectively. For
bispyribac-sodium, recoveries were 122.5 at spike levels 0.5 µg L-1,and
for simazine and penoxsulam, recoveries were 134.7 and 127.7% at spike levels 2.0 µg L-1, respectively.Accuracy
values were also satisfactory since RSD values were lower than 20% for all compounds.
Method applicability in real samples
Environmental sample analysis
After the optimization and validation, the method was applied to real samples, to evaluate its applicability. The
Table 3. Results for calibration curves
Compounds Linearity range (µg L-1)
Determination coeficient (r2)
Number of standards (n)
Irgarol 1.0-500.0 0.9948 9
Imazapic 10.0-500.0 0.9939 7
Imazethapyr 10.0-500.0 0.9967 7
Tebuconazole 1.0-500.0 0.9972 9
Bispyribac-sodium 25.0-500.0 0.9930 6
3,4-DCA 10.0-500.0 0.9933 7
Simazine 1.0-500.0 0.9972 9
Atrazine 1.0-500.0 0.9963 9
Propanil 10.0-500.0 0.9905 7
Carbofuran 5.0-500.0 0.9957 8
Diuron 10.0-500.0 0.9952 7
Carbofuran-3-hidroxy
10.0-500 .0 0.9949 7
Clomazone 10.0-500.0 0.9931 7
2,4-D 10.0-500.0 0.9955 7
Bentazone 10.0-500.0 0.9917 7
Quinclorac 25.0-500.0 0.9910 6
Metsulfuron-methyl 10.0-500.0 0.9930 7 Pyrazosulfuron-ethyl 10.0-500.0 0.9990 7
Fipronil 5.0-500.0 0.9967 8
sampling was carried out monthly at CORSAN, the water treatment station in Rio Grande, from January, 2008 to April, 2009. Two different samples were collected: a surface water sample, collected at the entrance of the water channel (São Gonçalo channel), and a drinking water sample, collected after the water treatment, in the output of the station.
In Figure 2, the sum of pesticide concentrations of the monthly results, from January, 2008 to April, 2009, of monitoring analysis of the surface water from the São Gonçalo channel and of the drinking water in Rio Grande are presented. Taking into account the 18 pesticides and 2 metabolites under analysis, it was detectable contamination of diuron, irgarol, imazethapyr, imazapic, fipronil, clomazone, tebuconazole, atrazine, pyrazosulfuron-ethyl, simazine, carbofuran-3-hydroxi and 3,4-DCA. It is noticed that, except to in February, 2009, in drinking water the sum of concentrations of pesticides was always lower than 0.5 µg L-1, the value established by European legislation.6
The presence of diuron and irgarol during all the monitoring period indicates that the region of São Gonçalo channel, concerning the contamination by pesticides, is inluenced not only by the agricultural process but also by other sources. The occurrence of
Table 4. Study of LOD and LOQ values obtained by LC-ESI-MS-MS
Compounds LODa
(µg L-1)
LOQa (µg L-1)
LODb (ng L-1)
LOQb (ng L-1)
Irgarol 0.1 1.0 0.4 4.0
Imazapic 0.1 10.0 0.4 40.0
Imazethapyr 1.0 10.0 4.0 40.0
Tebuconazole 0.5 1.0 2.0 4.0
Bispyribac-sodium 5.0 25.0 20.0 100.0
3,4-DCA 0.5 10.0 2.0 40.0
Simazine 0.1 1.0 0.4 4.0
Atrazine 0.5 5.0 2.0 20.0
Propanil 0.5 10.0 2.0 40.0
Carbofuran 0.5 5.0 2.0 20.0
Diuron 5.0 10.0 20.0 40.0
Carbofuran-3-hidroxy 5.0 10.0 20.0 40.0
Clomazone 0.5 5.0 2.0 20.0
2,4-D 5.0 10.0 20.0 40.0
Bentazone 0.1 10.0 0.4 40.0
Quinchlorac 10.0 25.0 40.0 100.0
Metsulfuron-methyl 5.0 10.0 20.0 40.0
Pyrazosulfuron-ethyl 5.0 10.0 20.0 40.0
Fipronil 0.5 1.0 10.0 4.0
Penoxsulam 10.0 25.0 40.0 100.0
aLimits of detection/quantiication of the instruments for the standard solution mix of pesticides. bLimits of detection/quantiication of the method for the standard solution mix of pesticides.
Table 5. Average recovery (%), n = 9 and RSD (%)
Pesticide
Spike level 2.0 µg L-1
Spike level 0.5 µg L-1
Spike level 0.1 µg L-1
Spike level 0.05 µg L-1
Spike level 0.02 µg L-1
Spike level 0.004 µg L-1 Recovery
(%)
RSD (% )
Recovery (%)
RSD (%)
Recovery (%)
RSD (%)
Recovery (%)
RSD (%)
Recovery (%)
RSD (%)
Recovery (%)
RSD (%)
Irgarol 110.4 4.9 107.8 8.7 101.9 9.3 105.4 5.1 111.9 11.4 121.3 4.9
Imazapic 136.4 1.9 111.9 15.4 92.3 9.7 96.8 9.7 n.d. n.d. n.d. n.d.
Imazethapyr 136.3 7.4 109.2 0.7 117.8 9.3 123.1 3.0 n.d. n.d. n.d. n.d.
Tebuconazole 96.5 2.6 102.5 9.9 92.2 6.9 91.2 5.5 109.2 11.9 95.3 12.5
Bispyribac-sodium 98.5 8.1 122.5 7.2 89.5 5.1 93.3 4.2 n.d. n.d. n.d. n.d.
3,4-DCA 103.1 3.2 65.3 8.2 104.2 7.0 93.2 5.6 n.d. n.d. n.d. n.d.
Simazine 134.7 16.2 95.1 10.2 89.6 11.1 93.2 3.2 97.4 14.1 101.8 17.7
Atrazine 82.3 9.8 119.1 14.9 75.7 6.3 115.9 15.4 96.1 7.8 n.d. n.d.
Propanil 86.3 7.2 92.8 5.5 101.2 4.0 108.4 4.9 n.d. n.d. n.d. n.d.
Carbofuran 95.2 6.3 111.9 9.9 84.5 4.2 76.7 4.8 95.7 11.9 n.d. n.d.
Diuron 100.4 7.1 109.5 1.7 75.3 15.1 92.7 6.2 n.d. n.d. n.d. n.d.
Carbofuran-3-hidroxy 100.1 15.3 94.8 7.5 93.3 15.7 103.6 10.1 n.d. n.d. n.d. n.d.
Clomazone 110.5 5.2 91.6 7.7 82.7 7.8 74.5 2.1 n.d. n.d. n.d. n.d.
2,4-D 110.3 7.8 128.4 20.3 108.0 3.4 100.1 11.6 n.d. n.d. n.d. n.d.
Bentazone 75.6 2.7 81.6 8.5 60.2 7.8 72.5 2.9 n.d. n.d. n.d. n.d.
Quinclorac 84.1 12.7 87.4 11.5 94.2 3.8 98.1 3.1 n.d. n.d. n.d. n.d.
Metsulfuron-methyl 71.9 2.8 80.7 10.2 118.6 5.7 96.3 13.6 n.d. n.d. n.d. n.d.
Pyrazosulfuron-ethyl 64.9 7.8 70.0 4.1 91.3 1.9 82.3 10.2 n.d. n.d. n.d. n.d.
Fipronil 103.1 4.5 99.8 5.7 84.0 4.7 103.1 11.2 93.0 14.0 102.2 10.2
diuron can be due to the fact that this herbicide is largely used in other kinds of cultures such as lettuce, citrus fruits, and onion.43 Besides, diuron and irgarol are used
as antifouling in paints for vessels.44,45 The association
of these uses increase the contamination by diuron in waters, specially in portuary regions such as Rio Grande where there is intensive navigation. The presence of 3,4-DCA, the main metabolite of diuron and of propanil conirm the use of these compounds. Whereas diuron is used in the culture of rice, the irgarol herbicide is not, but both are used as antifouling,46 indicating that the
contamination by these compounds has the same source, the vessels.
The other compounds were probably found in the samples are probably due to irrigated rice farming, because all compounds are recommended for this culture and this is the agricultural practice that dominates the southern region in RS state, besides the plantation of onion and tomato.43
The herbicides imidazolinones analysed in this study, imazethapyr and imazapic, were detected during all the sampling period, both in the surface water and in potable water. The fact that they are frequently detected in the samples can be explained, for example, by the system of rice cultivation, which works with a variety of rice that is very resistant to the pesticides of the imidazolinones class; they are effective against red rice, the main pest in the irrigated rice plantation.45
The fungicide tebuconazole and the herbicides atrazine and simazine were detected in the sampling since May, and the tebuconazole kept being detected in all samples. Triazines are used in the world as pre and post-emerging selective herbicides to control weeds in many cultures, such as corn, wheat, sugar cane and barley.
The insecticide ipronil was detected in all samples, since it is recommended for several cultures (agriculture and silviculture). The herbicide pyrazosulfuron-ethyl
was detected in some samples too, this compound is recommended for rice cultivation.
The detection of the metabolite carbofuran-3-hydroxi from carbosulfan and carbofuran, indicates that one of these compounds had been used on farms near the São Gonçalo channel.
The herbicide clomazone was detected in concentrations lower than the LOQ in all samples, except in July, when it was detected in surface and potable waters.
The method was shown to be sensitive enough to detect these pesticides, even at this sub-µg L-1 level.
Conclusions
An analytical methodology for multiclasses, using SPE and LC-ESI-MS-MS, was developed to analyze 18 selected pesticides and 2 metabolites fast and simultaneously in surface and drinking water samples. The main advantage of the method was the use of MS-MS because it provides a high level of certainty to identify the target compounds. The mode MRM in MS-MS enables us to select speciic fragments of each compound, with the optimization of cone voltage and collision energy, thus allowing a high level of selectivity in this technique, even if the work is done with a large number of compounds per analysis. In this research, another great advantage of the analytical technique is that LC-ESI-MS-MS showed high sensitivity with detection limits below 40.0 ng L-1 for all compounds allowing the
determination of pesticide residues in surface and drinking waters in accordance with Law no 518 of the Ministry
of Health, Brazil, and the European Union Directive on drinking water quality (98/83/EC).
Good linearity of the calibration curves was obtained over the range from the LOQ of each compound to 500.0 µg L-1, with r2 > 0.99. Instrument LOD values
generally varied from 0.1 to 10.0 µg L-1, however, the
pre-concentration factor LOD was from 0.4 to 40.0 ng L-1.
For 91% of the accuracy experiments, recoveries were in the range 70-120% as well as good reproducibility with relative standard deviations below 20%. The method was fast (10 min for analysis), thus reducing the solvent consumption. Another important factor determined by the method was the detection and quantiication limit that were below the maximum permissible concentration of 0.1 µg L-1
established in the EU regulation (Directive 98/83/EC) for drinking water,8 showing that SPE and LC-ESI-MS-MS is
a useful methodology for the analysis of pesticides. The application of the method in real samples showed excellent performance. The results proved that the method is adequate for the utilization in routine analysis for drinking and surface water.
Acknowledgments
The authors acknowledge the inancial support and fellowships from the Brazilian agencies FINEP, FAPERGS, CNPq, CORSAN and FURG.
References
1. Primel, E. G.; Zanella, R.; Kurz, M. H. S.; Gonçalves, F. F.; Machado, S. O.; Marchezan, E.; Quim. Nova 2005, 28, 605.
2. Picó, Y.; Blasco, C.; Font, G.; Mass Spectrom. Rev.2004, 23, 45.
3. Ballesteros, E.; Parrado, M. J.; J. Chromatogr., A 2004, 1029, 267.
4. Coutinho, C. F. B.; Tanimoto, S. T.; Galli, A.; Garbellini, G. S.; Takayama, M.; Amaral, R. B.; Mazo, L. M.; Avaca, L. A.; Machado, S. A. S.; Pesticidas: R. Ecotoxicol. Meio Ambiente 2005, 15, 65.
5. Spadotto, C. A.; Gomes, M. A. F.; Luchini, L. C.; Andréa, M. M.; Monitoramento do Risco Ambiental de Agrotóxicos: Príncipios
e Recomendações, Embrapa Meio Ambiente: Jaguariúna, São Paulo, Brasil, 2004, p. 29.
6. Council Directives 98/83/EC Off. J. Eur. Com. L 330: 32-54, European Union, 1998.
7. Council Directives 76/464/EC Off. J. Eur. Com. L 129: 23-29, European Union, 1976.
8. Council Directives 80/778/EC Off. J. Eur. Com. L 229: 11-29, European Union, 1980.
9. Ministério da Saúde, Portaria No. 518, 25 de março de 2004. Diário Oicial da União, Brasília, 2004. http://portal.saude. gov.br/portal/arquivos/pdf/portaria_518_2004.pdf, accessed in October 2008.
10. Curini, R.; Gentili, A.; Marchese, S.; Perrer, D.; Arone, L.; Monteleone, A.; Chromatographia2001,53, 244.
11. Carabias-Martínez, R.; Rodríguez-Gonzalo, E.; Herrero-Hernández, E.; Hernández-Méndez, J.; Anal. Chim. Acta2004, 517, 71.
12. Picó, Y.; Fernández, M.; Ruiz, M. J.; Font, G.; J. Biochem. Biophys. Methods2007,70, 117.
13. Bortoluzzi, E. C.; Rheinheimer, D. S.; Gonçalves, C. S.; Pellegrini, J. B. R.; Maroneze, A. M.; Kurz, M. H. S.; Bacar, N. M.; Zanella, R.; Quim. Nova 2007, 30, 1872.
14. Schellin, M.; Hauser, B.; Popp, P.; J. Chromatogr., A 2007, 1152, 175.
15. Gonçalves, C.; Alpendura, M. F.; J. Chromatogr., A2004, 1026, 239.
16. Bavcon, M.; Trebse, P.; Zupancic-Kralj, L.; Chemosphere2003, 50, 595.
17. Xiong, J.; Hu, B.; J. Chromatogr., A 2008, 1193, 7. 18. Djozan, D.; Ebrahimi, B.; Anal. Chim. Acta 2008, 616, 152.
19. Zanella, R.; Primel, E. G.; Gonçalves, F. F.; Martins, M. L.; Adaime, M. B.; Marchesan, E.; Machado, S. L. O.; J. Braz. Chem. Soc. 2008, 19, 987.
20. Kampioti, A. A.; Cunha, A. C. B.; Alda, M. L.; Barceló, D.; Anal. Bioanal. Chem. 2005, 382, 1815.
21. Gatidou, G.; Kotrikla, A.; Thomaidis, N. S.; Lekkas, T. D.; Anal. Chim. Acta 2005, 528, 89.
22. Caldas, S. S.; Demoliner, A.; Primel, E. G.; J. Braz. Chem. Soc. 2009, 20, 125.
23. Sánchez-Ortega, A.; Sampedro, M. C.; Unceta, N.; Goicolea, M. A.; Barrio, R. J.; J. Chromatogr., A2005, 1094, 70. 24. Guzzella, L.; Pozzoni, F.; Giuliano, G.; Environ. Pollut. 2006,
142, 344.
25. Vigna, C. R. M.; Morais, L. S. R.; Collins, C. H.; Jardim, I. C. F. S.; J. Chromatogr., A 2006, 1114, 211.
26. Rodrigues, M. A.; Ferreira, V.; Cardoso, V. V.; Ferreira, E.; Benoliel, J. M.; J. Chromatogr., A 2007, 1150, 267.
27. Baugros, J. B.; Giroud, B.; Dessalces, G.; Loustalot, M. F. G.; Olivé, C. C.; Anal. Chim. Acta 2008, 607, 191.
28. Liu, F.; Bischoff, G.; Pestemer, W.; Xu, W.; Kofoet, A.; Chromatographia2006, 63, 233.
29. Vega, A. B.; Frenich, G.; Vidal, J. L. M.; Anal. Chim. Acta 2005, 538, 117.
30. Ayano, E.; Kanazawa, H.; Ando, M.; Nishimura, T.; Anal. Chim. Acta 2004, 507, 211.
31. Kuster, M.; Alda, M. J. L.; Barata, C.; Raldúa, D.; Barceló, D.; Talanta2008, 75, 390
32. Marin, J. M.; Sancho, J. V.; Pozo, O. J.; López, F. J.; Hernández, F.; J. Chromatogr., A 2006, 1133, 204.
33. Sancho, J. V.; Pozo, O. J.; Hernández, F.; Analyst2004, 129, 38. 34. Stoob, K.; Singer, H. P.; Goetz, C. W.; Ruff, M.; Mueller, S. R.;
J. Chromatogr., A 2005, 1097, 138.
35. Greulich, K.; Alder, L.; Anal. Bioanal. Chem.2008, 391, 183. 36. Cunha, A. C. B.; Alda, M. J. L.; Barceló, D.; Pizzolato, T. M.;
Santos, J. H. Z.; Anal. Bioanal. Chem.2004, 378, 940. 37. Steen, R. J. C. A.; Bobeldijk, I.; Brinkman, U. A. T.;
J. Chromatogr., A 2001, 915, 129.
38. Perreu, F.; Bados, P.; Kerhoas, L.; Nélieu, S.; Einhorn, J.; Anal. Bioanal. Chem.2007,388, 1265.
39. Titato, G. M.; Bicudo, R. C.; Lanças, F. M.; J. Mass Spectrom. 2007, 42, 1348.
40. Petrovíc, M.; Hernando, M. D.; Cruz-Días, M. S.; Barceló, D.; J. Chromatogr., A 2005, 1067, 1.
41. Zanella, R.; Primel, E. G.; Gonçalves, F. F.; Kurz, M. H. S.; J. Sep. Sci. 2003, 26, 935.
42. USEPA. Method Detection Limit (MDL). EPA 40 CFR (7-1-02), part 136, appendix B. U. S Environmental Protection Agency, Washington, D.C, 1994.
44. Buma, A. G. J.; Sjollema, S. B. ; van de Poll, W. H.; Klamer, H. J.C.; Bakker, J. F.; J. Sea Res. 2009, 61, 133.
45. Avila, L. A.; Lee, D.J.; Senseman, S. A.; McCauley G. N.; Chandler, J. M.; Cothren, J T.; Pest. Manage Sci. 2005, 61, 171.
46. Sapozhnikova, Y.; Wirth, E.; Schiff, K.; Brown, J.; Fulton, M.; Mar. Pollut. Bull. 2007, 54, 1962.
Received: November 27, 2009