0103 - 5053 $6.00+0.00
Short Report
* e-mail: [email protected]
Quantitative Determination of the Enantiomeric Composition of Panthotenic Acid Solutions:
A Mass Spectrometry Experiment
Daniella V. Augusti, Rochel M. Lago and Rodinei Augusti*
Departamento de Química, Universidade Federal de Minas Gerais, Av. Antonio Carlos, 6627, Pampulha, 31270-901 Belo Horizonte - MG, Brazil
Determinações rápidas e quantitativas da composição enantiomérica de soluções de ácido pantotênico foram realizadas pela utilização da ionização do tipo “electrospray” e da espectrometria de massas seqüencial e através da aplicação do método cinético para realizar a análise dos dados. Desvios da ordem de 1%, entre os valores reais e experimentais das composições enantioméricas, foram observados.
Rapid and quantitative determinations of the enantiomeric compositions of pantothenic acid solutions were carried out by using electrospray ionization tandem mass spectrometry and applying the kinetic method to perform the data analysis. Deviations of ca. 1% between the actual and experimental enantiomeric compositions were observed.
Keywords: pantothenic acid, enantiomeric composition, electrospray ionization, tandem mass spectrometry, kinetic method
Introduction
Pantothenic acid belongs to the group of B vitamins and, as a constituent of coenzyme A, plays a key role in the metabolism of carbohydrates, proteins and fats, and is therefore important for the maintenance and repair of all cells and tissue. It is involved in reactions that supply energy, in the synthesis of vital compounds as sterols (cholesterol), hormones (growth, stress and sex hormones), neurotransmitters (acetylcholine), phospholipids (components of cell membranes), porphyrin (component of hemoglobin, the oxygen-carrying red blood cell pigment), antibodies, and in the metabolism of drugs (sulfonamides). It also stimulates the adrenal glands and increases the production of cortisone for healthy nerves and skin. It has been verified, however, that only the D-enantiomer, its naturally-occurring form, has vitamin activity. The L-form, L-pantothenic acid, has been shown
to have an antagonistic effect in animal studies.1
There are few issues in chemistry that has drawn as much attention as the chiral nature of molecules. For instance, systematic examination of the biological activity of individual enantiomers is the rule for all new racemic drug candidates, and an increasing number of optically
pure drugs has been approved and marketed.2
Noteworthy advance has been made during the past few years on general methods of chiral identification and
quantification3 based entirely on mass spectrometry. It is
possible to group the methods used for chiral recognition and for quantification of enantiomeric excess by mass spectrometry into four wide types: (a) generation of
host-guest diasteromeric adducts using a chiral host-guest;4,5 (b)
determination of rates of ion/molecule reactions between
an enantiomeric guest and a host molecule;6 (c)
collision-induced dissociation (CID) of diasteromeric adducts in a
MS/MS experiment;7 (d) utilization of the kinetic method8-12
to quantify the MS/MS chiral effect.13 This last
methodology has been successfully applied to quantitative
analysis of aminoacids,13,14α-hydroxyacids,15 sugars16 and
some drugs17-19 and has been shown to be fast and to require
very small amounts of sample.
trimeric complexes, [M(ref*)(AD)2 - H]+ or [M(ref*)(A L)2 - H]
+
– formed in an electrosprayed solution containing a chiral
analyte (AD or AL, respectively), a chiral reference compound
(ref*), and a metal cation (usually M2+) – are mass-selected
and fragmented upon collision-induced dissociation. Scheme 1 displays the competitive dissociation of both trimeric
complexes to form the corresponding dimeric fragments, i.e.
[M(ref*)(AD(L)) - H]+ and [M(A
D(L))2 - H] +.
Scheme 2 shows the energy diagram for the competitive
dissociations of the trimeric complexes [M(ref*)(AD)2 - H]+
and [M(ref*)(AL)2 - H]+ to form the corresponding dimeric
fragments. Note that the dimeric complexes [M(AD)2 - H]+
and [M(AL)2 - H]+ are enantiomers and, therefore, possess
exactly the same energy level.
Clearly the difference in energy between the
diaste-romeric complexes [M(ref*)(AD) - H]+ and [M(ref*)(A
L)
-H]+ results in differences in their rates of formation and
hence in the relative abundance ratios (RD or RL) for the D
and L isomers, defined in equations 1 and 2, respectively:
RD = [M (ref*)(AD) - H]+/ [M(A
D)2 - H]
+ (1)
RL = [M(ref*)(AL) - H]+/ [M(A
L)2 - H]
+ (2)
The ratio of the individual ratios, RD to RL, defined as
Rchiral (equation 3), indicates the level of chiral distinction achievable in a particular experiment.
Rchiral = RD/RL (3)
Evidently, when Rchiral = 1 there is no chiral
discri-mination, which denotes that this specific array of metal and chiral reference is not able to originate effective enantiomeric distinction under these specific conditions. Therefore, the best systems to be selected are those ones
that provide Rchiral as far as possible from unity, provided
that accurate abundance ratios can still be measured. It must be mentioned, however, that the selection of adequate systems for enantiomeric distinction has been exclusively
performed, as recently reported in literature,13,16,19 based
on an alternative procedure, i.e. the mass-selection and
fragmentation of the trimeric complexes [M(ref*)2(AD(L))
-H]+ instead [M(ref*)(A
D(L))2 - H]
+. In such a case, the trimeric
complexes [M(ref*)2(AD(L)) - H]+ dissociate competitively
to form the dimeric complexes [M(ref*)(AD(L)) - H]+ and
[M(ref*)2 - H]+ by the loss of the neutral reference
compound (ref*) and analyte (A), respectively, and the Rchiral can be obtained.
The enantiomeric composition of a chiral analyte solution is determined founded on a linear relationship between the natural logarithm of the abundance ratios R
(R = [M(ref*)(A) - H]+] / M(A)
2 - H]
+) and the analyte
enantiomeric excess (ee). This relationship can be obtained
from the equation of the kinetic method (equation 4):13,16
ln (R) = ∆(∆G) / RTeff = (∆GD - ∆GL) / RTeff (4)
where Teff is the average effective temperature of the two
activated complexes for the two competitive reactions and
R is the gases constant. This equation says that the natural
logarithm of the ratio R is proportional to the difference in
free energy, ∆(∆G), for the formation of the two
diasteromeric ions [M(ref*)(AD) - H]+ and [M(ref*)(A
L)
-H]+ (Scheme 2). When the analyte sample is made up of
the pure D or L enantiomers, ∆(∆G) becomes ∆GD or ∆GL,
respectively (Scheme 2). For an enantiomeric mixture with an excess of enantiomer D, for example, one can write (equation 5):
∆(∆G) = (∆GD) (1 + ee) / 2 + (∆GL) (1 - ee) / 2 = [(∆GD) +
(∆GL)] / 2 + [(∆GD) - (∆GL)]*ee / 2 (5)
Moreover, the combination of equations 4 and 5 furnishes an expression describing a linear relationship between the enantiomeric excess (ee) and ln (R) as shown in equation 6:
ln(R) = [(∆GD) + (∆GL)] / 2RTeff + [(∆GD) - (∆GL)]*ee / 2RTeff
(6)
Scheme 1.
Thus, unknown enantiomeric mixtures are then analysed by measuring the ratio of the two fragment ions,
i.e. [M(ref*)(A) - H]+] and M(A)
2 - H]
+), in a single tandem
mass spectrum. This methodology is already
well-established and known as the single ratio method.12
The aim of this paper is, therefore, to apply the kinetic method strategy to determine the enantiomeric composition of pantothenic acid solutions, an important substance for the pharmaceutical and food industries. As chiral reference
compounds, a series of α-hydroxyacids (L-tartaric acid,
L-lactic acid, L-3-phenyl lactic acid, L-citramalic acid, L-mandelic acid, L-malonic acid, L-citric acid), sugars (D-glucose, D-mannose, D-galactose), aminoacids (L-Pro, L-Trp, L-Ala, L-Arg, L-Val, L-Tyr, L-Glu, L-Phe, L-Cys, L-Leu, L-His, L-Lys), and modified aminoacids (N-t-Boc-L-Pro, N-t-Boc-L-Phe or N-Fmoc-L-Pro) were tested in order to select the best system for chiral recognition and quantitation. These references were chosen since (a) they can be easily obtained in enantiomerically pure form; and (b) in previous studies, some of these compounds proved to
be useful as reference compounds in chiral analysis.15, 17, 18
Four divalent metal cations (M = Ca2+, Cu2+, Ni2+, Zn2+) were
selected as the central metal ions owing to their well-known ability to form complexes with oxygen and nitrogen-containing compounds, as well as to their recent use in chiral
analysis of several compounds by the kinetic method.13, 15-19
Experimental
All experiments were performed using a commercial LCQ Advantage ion trap mass spectrometer (Thermo
Finnigan, San Jose, CA), equipped with an ESI source and operated in the positive ion mode. The mass spectra reported are the average of about 40 scans, each requiring
0.2 s. Samples were infused into the ESI source via a syringe
pump at a flow rate of 2.00 µL min-1. Typical ESI conditions
were as follow: heated capillary temperature, 150 oC; sheath
gas (N2) flow rate, 0.75 L min-1; spray voltage 5 kV; capillary
voltage 3 V; tube lens off set voltage, 40 V. The aqueous methanol 1:1 solutions were prepared by the mixture of
the following reagents: (a) 2x10⁻⁵ mol L-1 of calcium
pantothenate, the calcium salt of pantothenic acid (in these experiments it was used the pure D-enantiomer and the
racemic mixture of such reagent); (b) 2x10⁻⁵ mol L-1 of a
chiral reference compound (ref*) such as: α-hydroxyacids
(L-tartaric acid, L-lactic acid, L-3-phenyl lactic acid, L-citramalic acid, L-mandelic acid, L-malonic acid, L-citric acid), sugars (D-glucose, D-mannose, D-galactose), aminoacids (L-Pro, L-Trp, L-Ala, L-Arg, L-Val, L-Tyr, L-Glu, L-Phe, L-Cys, L-Leu, L-His, L-Lys), and modified aminoacids (N-t-Boc-L-Pro, N-t-Boc-L-Phe or
N-Fmoc-L-Pro); and (c) 2x10⁻⁵ mol L-1 of a metal cation (nitrate salt of
Ca2+, Cu2+, Ni2+, Zn2+).
Results and Discussion
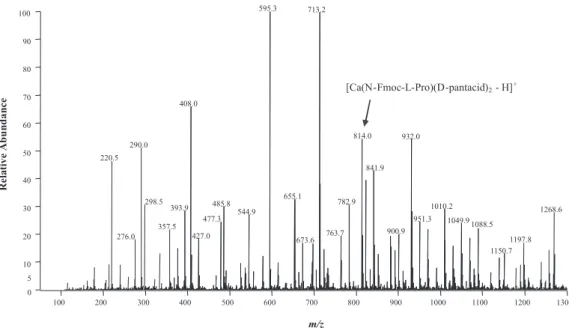
Figure 1 shows the ESI-MS spectrum of a solution containing calcium D-pantothenate and N-Fmoc-L-Pro. The formation of the trimeric complex
[Ca(N-Fmoc-L-Pro)(D-pantacid)2 - H]+ (m/z 814) is observed and indicated
in this spectrum. Note that several other ionic adducts,
such as [D-pantacid + H]+ (m/z 220),
[Ca(NFmoc-L-Figure 1 - ESI-MS spectrum of the aqueous methanol 1:1 solution containing calcium D-panthotenate 2x10⁻⁵ mol L-1 and the modified aminoacid N-Fmoc-L-Pro 2x10⁻⁵ mol L-1. The presence of the trimeric complex [Ca(N-Fmoc-L-Pro)(D-pantacid)
2 - H]
Pro)(pantacid) – H]+ (m/z 595), [Ca(NFmoc-L-Pro) 2 – H]
+
(m/z 713), and the trimeric complex [Ca(N-Fmoc-L-Pro)2
(D-pantacid) - H]+ (m/z 932), are also detected in such spectrum.
Figure 2 (a and b) shows the collision-induced dissociation spectrum of the mass-selected trimeric
complexes [Ca(N-Fmoc-L-Pro)(D-pantacid)2 - H]+ (formed
in the solution containing pure D-pantothenic acid) and
[Ca(N-Fmoc-L-Pro)(DL-pantacid)2 - H]+ (from a solution
with racemate pantothenic acid), respectively. The Rchiral
for this system, calculated by using equation 3, was found to be 0.71 and reflects the difference in stability of the
diastereomeric ions [Ca(N-Fmoc-L-Pro)(D-pantacid) - H]+
and [Ca(N-Fmoc-L-Pro)(L-pantacid) - H]+.
The ratio RL (RL = [Ca(NFmocLPro)(Lpantacid)
-H]+/ [Ca(L-pantacid)
2 - H]
+), which determination is
necessary to calculate Rchiral, is related to the dissociation
of the trimeric complex [Ca(N-Fmoc-L-Pro)(L-pantacid)2
-H]+ (hypothetically formed in a solution containing pure
L-pantothenic acid) and is obtained by extrapolation to
zero in a plot of ln(R) versus the molar fraction of
D-pantothenic acid, as shown in Figure 3.
Curiously, the trimeric complex
[Ca(N-Fmoc-L-Pro)2(pantacid) - H]+ (m/z 932), which could alternatively
be used for such chiral distinction (see some considerations about it in Introduction section), did not produce a
convenient value for Rchiral. Moreover, the use of other
systems, i.e. different combinations of the reference
compounds and metal cations cited in the Experimental section, did not furnish satisfactory results for the chiral recognition of pantothenic acid solutions. This was caused by at least one among the following reasons: (a) no
formation of the required trimeric complexes [M(ref*)(A)2
- H]+ or [M(ref*) 2(A) - H]
+; (b) no production of both dimeric
ions during the dissociation of such trimeric complexes;
and (c) systems with Rchiral very close to unit.
A linear relationship between ln (R), R =
[Ca(N-Fmoc-L-Pro)(pantacid) - H]+/ [Ca(pantacid)
2 - H]
+), versus the molar
fraction of D-pantothenic acid is observed with an excellent
correlation coefficient (R2= 0.9995) (Figure 3). The ratio R
for any solution containing Ca2+, N-Fmoc-L-Pro, and
panthotenic acid can be easily determined by measuring the intensities of the dimeric complexes
[Ca(N-Fmoc-L-Pro)(pantacid) - H]+ (m/z 595) and [Ca(pantacid)
2 - H] + (m/z
477) formed from the dissociation of the mass-selected
trimeric complex [Ca(N-Fmoc-L-Pro)(pantacid)2 - H]+ (m/z
814), as exemplified in Figures 2a and 2b. Using the calibration curve in Figure 3, the enantiomeric composition of prepared solutions of pantothenic acid was determined and outstanding results were obtained, as illustrated by the data of Table 1. Significantly, it was verified that the relative
Figure 2 - MS/MS product ion spectra of (a) [Ca(N-Fmoc-L-Pro)(D-pantacid)2 - H]+ (m/z 814) and (b) [Ca(N-Fmoc-L-Pro)(DL-pantacid)
2 - H]+ (m/z 814). The CID activation level is chosen as 10.6%, corre-sponding to approximately 265 mV AC.
Figure 3 - Calibration curve for chiral analysis of pantothenic acid using Ca2+ as the metal cation and N-Fmoc-L-Pro as the chiral refer-ence compound. The chiral selectivity factor (Rchiral) is 0.71 and the correlation coefficient (R2) is 0.9995. Each point represents an aver-age of ten measurements.
Table 1. Actual and experimental values for the enantiomeric com-position of pantothenic acid solutions
Fraction of D-pantothenic acid (%)
Actual Experimental a,b Difference
6 0 61±2 1
8 0 82±1 2
9 0 91±1 1
concentrations of pantothenic acid vs. N-Fmoc-L-Pro did
not affect the chiral discrimination in these systems.16, 20
This is an indispensable result for successful quantitative analysis of unknown samples.
Conclusions
The subject reported in this paper is of wide relevance, particularly to the pharmaceutical and food industries, both for the general demonstration of a simple method of enantiomer quantitation and in particular because pantothenic acid represents a valuable substance with improved possibilities of application. Furthermore, the
present study demonstrates for the first time that Ca2+, a
non-transition metal previously tested in similar chiral
recognition experiments,21 has a better performance than
transition metal cations, such as Cu2+, Ni2+, Zn2+. The results
presented herein demonstrate that not only [M(ref*)2(A)
-H]+ but also [M(ref*)(A)
2 - H]
+ trimeric complexes can be
used for chiral quantitation by the single ratio method. It can also be envisioned that once the linearity of the semi-log plot has been established for a chiral analysis, a two-point calibration curve would allow a faster but still reliable method of quantitative chiral analysis. By the use of a two-point calibration curve, which could be built by using the D-enantiomer and the racemic mixture of pantothenic acid, the enantiomeric composition of unknown solutions could be determined in a quick, but still reliable, way.
Acknowledgements
The authors thank Conselho Nacional de Desenvolvimento Científico e Tecnológico (CNPq) and Fundação de Amparo à Pesquisa do Estado de Minas Gerais (FAPEMIG) for financial support. The authors are also indebt to Dr. Tânia Maria de Almeida Alves and Dr. Carlos Zani (Centro de Pesquisas René Rachou - Fundação Osvaldo Cruz) for their consent in using the mass spectrometer.
References
1. Stryer, L.; Biochemistry, 4th revised ed.; Spektrum: Heidelberg, Germany, 1996.
2. Stinson, S. C.; Chem. Eng. News2000, 78, 55.
3. Grigorean, G.; Ramirez, J.; Ahn, S. H.; Lebrilla, C. B.; Anal. Chem. 2000, 72, 4275.
4. Sawada, M.; Mass Spectrom. Rev.1997, 16, 73.
5. Nikolaev, E. N.; Denisov, E. V.; Rakov, V. S.; Futrell, J. H.; Int.
J. Mass Spectrom.1999, 183, 357.
6. Grigorean, G.; Lebrilla, C. B.; Anal. Chem.2001, 73, 1684. 7. Smith, G.; Leary, J. A.; J. Am. Chem. Soc.1996, 118, 3293. 8. Cooks, R. G.; Kruger, T. L.; J. Am. Chem. Soc.1977, 99,
1279.
9. Cooks, R. G.; Patrick, J. S.; Kotiaho, T.; McLuckey, S. A.;
Mass Spectrom. Rev.1994, 13, 287.
10. Cooks, R. G.; Wong, P. S. H.; Acc. Chem. Res.1998, 31, 379. 11. Cooks, R. G.; Koskinen, J. T.; Thomas, P. D.; J. Mass Spectrom.
1999, 34, 85.
12. Zheng, X.; Augusti, R.; Tao, W. A.; Cooks, R. G. In The Encyclopedia of Mass Spectrometry, 1st ed.; Gross, M. L.; Caprioli, R. M., eds., Elsevier: Burlington MA, 2003, Vol. 1, pp. 350-362.
13. Tao, W. A.; Zhang, D.; Nikolaev, E. N.; Cooks, R. G.; J. Am. Chem. Soc.2000, 122, 10598.
14. Tao, W. A.; Zhang, D.; Wang, F.; Thomas, P.; Cooks, R. G.;
Anal. Chem.1999, 71, 4427.
15. Tao, W. A.; Wu, L.; Cooks, R. G.; Chem. Commun.2000, 20, 2023.
16. Augusti, D. V.; Carazza, F.; Augusti, R.; Tao, W. A.; Cooks, R. G.; Anal. Chem.2002, 74, 3458.
17. Tao, W. A.; Gozzo, F. C.; Cooks, R. G.; Anal. Chem.2001, 73, 1692.
18. Tao, W. A.; Wu, L.; Cooks, R. G.; Wang, F.; Begley, J. A.; Lampert, B.; J. Med. Chem.2001, 44, 3541.
19. Augusti, D. V.; Augusti, R.; Carazza, F.; Cooks, R. G.; Chem. Commun.2002, 19, 2242.
20. Zhang, D.; Tao, W. A.; Cooks, R. G.; Int. J. Mass Spectrom. 2001, 204, 159.
21. Tao, W. A.; Cooks, R. G.; Anal. Chem.2003, 1, 25A.
Received: October 28, 2003
![Figure 2 - MS/MS product ion spectra of (a) [Ca(N-Fmoc-L-Pro)(D- [Ca(N-Fmoc-L-Pro)(D-pantacid) 2 - H] + (m/z 814) and (b) [Ca(N-Fmoc-L-Pro)(DL-pantacid) 2 - H] + (m/z 814)](https://thumb-eu.123doks.com/thumbv2/123dok_br/18990101.460321/4.892.95.441.367.787/figure-product-spectra-fmoc-fmoc-pantacid-fmoc-pantacid.webp)
