ABSTRACT: Plant residues and certain fertilizers accelerate soil acidification and increase the levels of aluminum-Al+3 in soils under no-tillage (NT). Silicates act as acidity amendments and as a source of silicon as in H4SiO4. An increase in the pH of soil solution causes the deprotonation of H4SiO4 and generates the anionic form (H3SiO4
−). The aim of this study was to evaluate the ionic speciation of Si, Al, Ca, Mg and K in aqueous extracts by means of a software calculation. Since 2006, a field experiment has been under way on an Oxisol under NT subjected to lime and calcium-magnesium silicate applications under four crop systems. The amendments were applied in Oct 2006 and in Oct 2011, aiming to raise base saturation to 70 %. Soil samples were collected in Oct 2013, at depths of 0-5, 5-10, 10-20, 20-40 and 40-60 cm. Both Ca and Mg formed complexes with dissolved organic carbon (DOC) whereas the same was not observed for potassium. These three basic cations were mostly in their free forms regardless of treatment, while Al was mostly complexed with DOC even at the lowest depths (40-60 cm). The highest value of free Al form was 15 %. Si was almost 100 % as H4SiO4, and its activity was similar to its concentration in solution for all crop systems and at all depths, regardless of amendment ap-plied. The percentages of H3SiO4
− and Al-H 3SiO4
2+ were irrelevant, providing more phytoavailable H4SiO4 in soil solution.
Keywords: soil solution, cations speciation, aqueous extraction, amendments
Lime and calcium-magnesium silicate in the ionic speciation of an Oxisol
João Arthur Antonangelo1, Jayme Ferrari Neto2, Carlos Alexandre Costa Crusciol3, Luís Reynaldo Ferracciú Alleoni4*
1Oklahoma State University – Dept. of Plant and Soil Sciences, 039 Agricultural Hall − 74078 − Stillwater, OK − USA.
2Sociedade Porvir Científico – La Salle Faculty, Av. Universitária, 1000w – Bairro Bandeirantes – 78455-000 – Lucas do Rio Verde, MT – Brazil.
3São Paulo State University/FCA − Dept. of Crop Science, R. José Barbosa de Barros, 1780 − 18610-307 − Botucatu, SP − Brazil.
4University of São Paulo/ESALQ − Dept. of Soil Science, Av. Pádua Dias, 11 − 13418-900 − Piracicaba, SP − Brazil. *Corresponding author <[email protected]>
Edited by: Leônidas Carrijo Azevedo Melo
Received July 13, 2016 Accepted October 07, 2016
Introduction
Plants absorb silicon (Si) in the form of silicic acid (H4SiO4). It is gradually becoming recognized nowadays as an important element for plants (Datnoff et al., 2007). Tropical soils are generally deficient in this element, and soluble sources of Si are added to highly weathered soils with low Si available content, less than 2 mg kg−1 (Fox and Silva, 1978), and this practice contributes to improvements in the nutrition-al status of plants, and promotes resistance to a variety of fungal diseases (Datnoff et al., 2001). On the other hand, Si can be strongly bound to the mineral phases and, therefore, becomes less available for plants (Ho-bara et al., 2016). Calcium-magnesium silicates (Ca/ MgSiO3) correct acidity in the soil by raising pH val-ues and provide readily available silicon, calcium and magnesium to plants through the following reaction: Ca/MgSiO3 + H2O Ca2+/Mg2+ + SiO
4
4− (Ramos et al., 2006). In the case of Si, silicates dissolve in acidic soil and promote the release of H4SiO4 in solution (equa-tions 1, 2, 3 and 4 of chemical equilibrium), with sili-con in a form available to plants (Jones and Handreck, 1967). Levels of Ca, Mg and K increase with increases in the soil pH, which is also a consequence of silicate fertilization (Ramos et al., 2006).
SiO44− + H
2O(soil)HSiO4
3− + OH− log K0 = -45.95 Eq. 1
HSiO43− + H
2O(soil)H2SiO4
2− + OH− log K0 = -32.85 Eq. 2
H2SiO42− + H
2O(soil) H3SiO4
− + OH− log K0 = -22.98 Eq. 3
H3SiO4− + H
2O(soil)H4SiO4 + OH
− log K0 = -9.71 Eq. 4
The NT system can change the available Si content in soil solution and minimize the harmful effects of Al3+, especially in the surface layers, where there is greater concentration of organic matter (OM). Much of the Al is present in the soil solid phase and is in equilibrium with the liquid phase (Hiradate, 2011). The greatest con-tribution of OM in soils under no-tillage (NT) systems minimizes the toxic effects of Al through the strong link of this metal with anions derived from organic acids. In this sense, silicate application under NT, in addition to providing available Si, has the potential to make Si even more available due to the strong interaction of or-ganic matter components with aluminum, which is even stronger than hydroxyl ions (OH−), and then provides more Si in soil solution by reducing the formation of alu-minosilicates. Chemical (or ionic) speciation provides a detailing of the chemical composition of soil solution, including the forms of elements in the solution. Ca, Mg, K and Si species found in soil solution under NT, mainly in the surface layers (0-10 cm), or even more in soils sub-jected to the application of amendments, are still little known. Thus, detailed information about the species is necessary because soil management is able to alter them and, thus, interfere in their availability to plants.
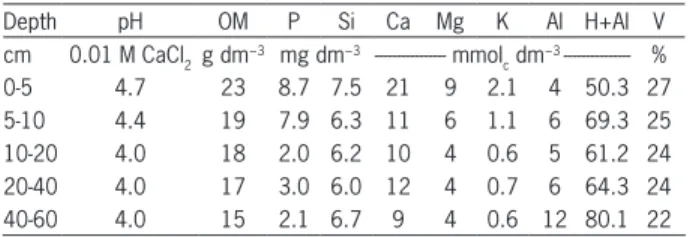
Table 1 − Chemical properties of Oxisol (2006).
Depth pH OM P Si Ca Mg K Al H+Al V
cm 0.01 M CaCl2g dm
−3 mg dm−3 --- mmol c dm
−3 --- %
0-5 4.7 23 8.7 7.5 21 9 2.1 4 50.3 27
5-10 4.4 19 7.9 6.3 11 6 1.1 6 69.3 25
10-20 4.0 18 2.0 6.2 10 4 0.6 5 61.2 24
20-40 4.0 17 3.0 6.0 12 4 0.7 6 64.3 24
40-60 4.0 15 2.1 6.7 9 4 0.6 12 80.1 22
maximum pH value reached by the application of soil amendments being insufficient to provide a good amount of the anion silicate; and that (iii) organic ligands bear, in the main, responsibility for Al, Ca and Mg complexation in soils under NT even at lower depths and after the ap-plication of soil amendments.
Materials and Methods
Description of the area and soil characterization The experimental area has been cultivated under NT since 2002, and this experiment has been under way since 2006 in Botucatu, in the state of São Paulo, Brazil, (48 23’ W; 22 51’ S; 765 m a.s.l). The soil is a typical clay-ey Hapludox, and chemical analysis results prior to the setting-up of the experiment were obtained as Raij (1998) (Table 1). According to the Köppen classification, the pre-vailing climate in the region is Cwa (high altitude, tropi-cal climate with dry winters and hot rainy summers).
Design of the experiment and description of the treatment
The design of the experiment was a randomized block with split plots. The plots consisted of four crop systems (I - Season - Forage; II - Season - Off-season; III - Season - Fallow; IV - Season - Green-manure) and subplots comprising two sources of lime (limestone and calcium-magnesium silicates) and a control (without cor-rective), with four replications (n = 4). This design was adopted so as to enable the experiment to be conducted in a fully mechanized way. Soil samples were collect-ed by using a probe at the following depths: 0-5, -5-10, -10-20, -20-40 and -40-60 cm. Although the NT system provides greater changes in the upper soil layers, we fur-ther planned to evaluate soil solution speciation down to a depth of 60 cm because the root systems of certain grasses cultivated in the experiment since 2006 have the potential to grow down to lower depths, which contrib-utes to a higher content of soil organic matter (SOM) at lower depths. The organic acids excreted may contribute significantly to the contents of DOC. In order to correct the soil acidity, dolomitic lime (Effective CaCO3 equiva-lent - ECCE = 90 %, CaO = 36 % and MgO = 12 %) and calcium-magnesium silicate (ECCE = 80 % = CaO 34 %, MgO = 10 % and SiO2 = 22 %) were used: doses were applied in Oct, 2006 (3.8 and 4.1 Mg ha−1, respectively), followed by a reapplication in Oct, 2011 (4.7 and 5.3 Mg ha−1, respectively), aiming to raise base saturation (V%)
to 70 %. In the reapplication the characteristics of lime were: ECCE = 74 %, CaO = 35 % and MgO = 12 %, and the characteristics of silicate were: ECCE = 66 %, CaO = 32 %, MgO = 9 % and SiO2 = 22 %.
The following crops: soybean (Glycine max), corn (Zea mays), rice (Oryza sativa), soybean, corn, bean (Phaseolus vulgaris) and rice (sown in Nov), comprised the seasons’ crops in the following agricultural years: 2006/07, 2007/08, 2008/09, 2009/10, 2010/11, 2011/12 and 2012/13, respectively.
Soil samples were air-dried, slightly crushed, passed through a 2 mm sieve and then stored in plastic bags kept in the shade at room temperature until analysis.
Extraction and chemical analysis of soil solution The aqueous extract method was used to extract the soil solution using a 1:1 soil:water ratio (Wolt, 1994). Twenty grams of soil and 20 mL of ultrapure water were placed in a 50 mL centrifuge tube, which was then placed in a horizontal table shaker for 15 min at 150 rpm, followed by 1 h rest. The solution was then shaken again for 5 min followed by centrifugation for 30 min at 1,844 × g. Three extractions were performed to obtain extracts of cations, anions, and dissolved organic carbon, which were determined separately. To obtain the extract for determining cations and anions, the solution was fil-tered through a 0.45 µm cellulose membrane and stored for 15 days in a refrigerator until readings were taken. The extract for determining DOC (dissolved organic car-bon) was filtered through a 0.7 µm GF/F glass microfi-ber filter that was previously calcinated at 500 °C for 6 h and then packed in glass vials subjected to washing and decontamination in hydrochloric acid solution (20 % HCl). About 0.1 mL of 30 mmol L−1 HgCl
2 solution was used for this last extraction with the aim of avoiding the proliferation of microrganisms. The filtered extract was stored for 30 days in a freezer until readings were taken. All filtering for obtaining the extracts were per-formed with the aid of 25 mm diameter filters for the fraction of cations, anions and DOC. These supports were coupled in 60 mL plastic syringes in which the ex-tract obtained after centrifugation was placed, and fil-tered under pressure by manual force. In the solutions, immediately after centrifugation, pH was determined by potentiometry and the electrical conductivity (EC) by electrometry (used to calculate the ionic strength of the soil solution). The cation contents (K, Na, Ca, Mg, Cu, Zn, Fe, Al and Si) were determined by ICP-OES, whereas the anion contents (NO2−, NO
3 −, SO
4 2−, PO
4
3−, Cl− and F−), were determined by ionic chromatography; and the DOC, in carbon analyzer. Ultrapure water was used as control, and reference standards were used as quality control and for calibration curves of the equipment.
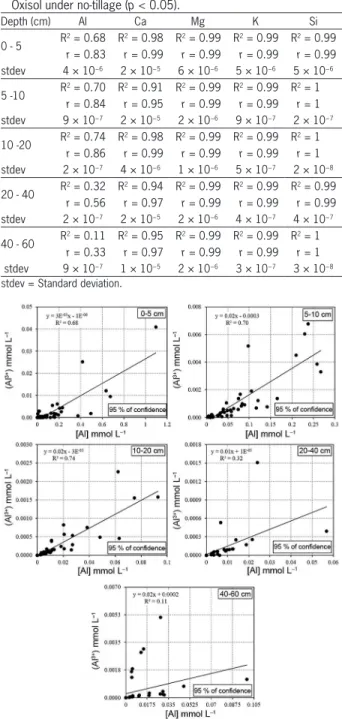
Table 2 − Coefficients of determination and Pearson correlation between total concentrations of aluminum, calcium, magnesium and potassium and their respective activities of their free forms in solution (Al3+, Ca2+, Mg2+ and K+), and silicon and silicic acid activity (H4SiO4), in aqueous extracts for different layers of an Oxisol under no-tillage (p < 0.05).
Depth (cm) Al Ca Mg K Si
0 - 5 R
2 = 0.68 R2 = 0.98 R2 = 0.99 R2 = 0.99 R2 = 0.99
r = 0.83 r = 0.99 r = 0.99 r = 0.99 r = 0.99 stdev 4 × 10⁻⁶ 2 × 10⁻⁵ 6 × 10⁻⁶ 5 × 10⁻⁶ 5 × 10⁻⁶
5 -10 R
2 = 0.70 R2 = 0.91 R2 = 0.99 R2 = 0.99 R2 = 1
r = 0.84 r = 0.95 r = 0.99 r = 0.99 r = 1 stdev 9 × 10⁻⁷ 2 × 10⁻⁵ 2 × 10⁻⁶ 9 × 10⁻⁷ 2 × 10⁻⁷
10 -20 R
2 = 0.74 R2 = 0.98 R2 = 0.99 R2 = 0.99 R2 = 1
r = 0.86 r = 0.99 r = 0.99 r = 0.99 r = 1 stdev 2 × 10⁻⁷ 4 × 10⁻⁶ 1 × 10⁻⁶ 5 × 10⁻⁷ 2 × 10⁻⁸
20 - 40 R
2 = 0.32 R2 = 0.94 R2 = 0.99 R2 = 0.99 R2 = 0.99
r = 0.56 r = 0.97 r = 0.99 r = 0.99 r = 0.99 stdev 2 × 10⁻⁷ 2 × 10⁻⁵ 2 × 10⁻⁶ 4 × 10⁻⁷ 4 × 10⁻⁷
40 - 60 R
2 = 0.11 R2 = 0.95 R2 = 0.99 R2 = 0.99 R2 = 1
r = 0.33 r = 0.97 r = 0.99 r = 0.99 r = 1 stdev 9 × 10⁻⁷ 1 × 10⁻⁵ 2 × 10⁻⁶ 3 × 10⁻⁷ 3 × 10⁻⁸ stdev = Standard deviation.
I Ci Zi
i n
= ⋅
( )
=
∑
1 2
2
1
Eq. 05
Ci is the concentration (mol L−1) of each ion from solu-tion and Ziits charge.
Ionic speciation of soil solution
The ionic speciation of the soil solution was based on the values of the concentrations of organic and inor-ganic cations and anions, by using the Visual MINTEQ software program (Gustafsson, 2013). The free species, the complexed species and the activity of the elements in solution were then estimated. The species linked to organic anions were estimated based on the DOC con-tent by "Gaussian DOM" model (Grimm et al., 1991). The software has a database containing the values of the constant values of formation and stability of all possible species. Thus, it was possible to simulate the percentage distribution of species formed at a given pH, measured in the aqueous extract. All determinations for a given sample were inserted into the software program, and then the speciation was calculated. The concentration of each element in each aqueous extract was verified for each sample. For this, all species for a given element were summed, and then this value was verified against the determined value (from the extract). The average (n = 4) has been used for the species calculated in each sample.
Statistical analysis
For the statistical analysis, the results were plotted as a percentage distribution of species followed by mean standard deviations for lime and Ca-Mg silicate, sepa-rately, and for each crop system, aiming to verify the isolated effect of the soil amendments over the main spe-cies in question. The distribution in percentages of each species in the soil solution was obtained as a function of the soil amendments application and sampling depths, for each crop system. Next, the percentages of each spe-cies were compared at each depth and each crop system using the mean standard deviation (with four replica-tions). Pearson correlation and linear regression analy-ses were configured by the Excel software program and extracted between the total concentrations of the ions and the activities of their free forms in aqueous solu-tion. Linear regressions were constructed with 95 % of confidence, which is in alignment with the probability of error in the fit of the regression model obtained by the Excel software program.
Results and Discussion
Aluminum
Regardless of correctives and crop systems, the activity of aluminum in free form (aAl3+) was posi-tively correlated with the total metal concentration in aqueous extract (Alt) in the first three layers (from 0-5; -5-10 and -10-20 cm). On the other hand, there was no
correlation between the samples from the remaining two layers (20-40 and 40-60 cm) (Table 2 and Figure 1). Ionic aluminum in free form (Al3+) is potentially the most phytotoxic form of this metal (Ma and
kawa, 2003). The differences found between Alt and
aAl3+ in aqueous extract suggest that the total concen-tration of aluminum represents neither its availability nor its potential phytotoxicity (Zambrosi et al., 2007),
which is attributable to free-form Al3+. Total metal concentrations, pH values and the levels of I in soil solution in the aqueous extract are shown in Tables 3, 4, 5 and 6.
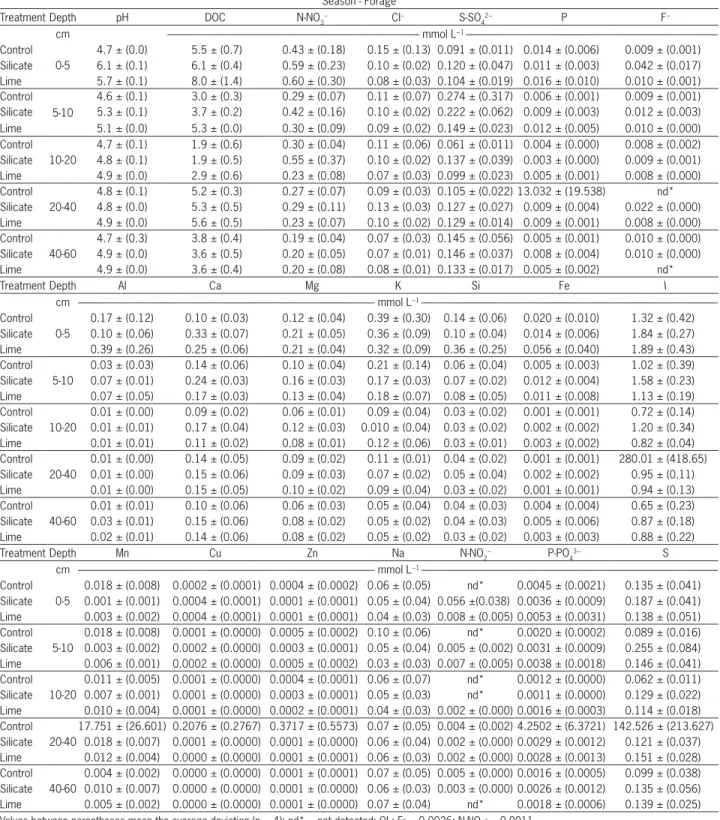
Table 3 – Acidity correctives, pH values, dissolved organic carbon (DOC), inorganic anions, cations and ionic strength (I), micronutrients, sodium, nitrite, phosphate and sulfur on soil solution in five depths of an Oxisol under no-tillage, in Season – Forage system. QL = quantification limit, mmol L−1.
Season - Forage
Treatment Depth pH DOC N-NO3
− Cl− S-SO
4
2− P F−
cm --- mmol L−1 ---Control
0-5
4.7 ± (0.0) 5.5 ± (0.7) 0.43 ± (0.18) 0.15 ± (0.13) 0.091 ± (0.011) 0.014 ± (0.006) 0.009 ± (0.001) Silicate 6.1 ± (0.1) 6.1 ± (0.4) 0.59 ± (0.23) 0.10 ± (0.02) 0.120 ± (0.047) 0.011 ± (0.003) 0.042 ± (0.017) Lime 5.7 ± (0.1) 8.0 ± (1.4) 0.60 ± (0.30) 0.08 ± (0.03) 0.104 ± (0.019) 0.016 ± (0.010) 0.010 ± (0.001) Control
5-10
4.6 ± (0.1) 3.0 ± (0.3) 0.29 ± (0.07) 0.11 ± (0.07) 0.274 ± (0.317) 0.006 ± (0.001) 0.009 ± (0.001) Silicate 5.3 ± (0.1) 3.7 ± (0.2) 0.42 ± (0.16) 0.10 ± (0.02) 0.222 ± (0.062) 0.009 ± (0.003) 0.012 ± (0.003) Lime 5.1 ± (0.0) 5.3 ± (0.0) 0.30 ± (0.09) 0.09 ± (0.02) 0.149 ± (0.023) 0.012 ± (0.005) 0.010 ± (0.000) Control
10-20
4.7 ± (0.1) 1.9 ± (0.6) 0.30 ± (0.04) 0.11 ± (0.06) 0.061 ± (0.011) 0.004 ± (0.000) 0.008 ± (0.002) Silicate 4.8 ± (0.1) 1.9 ± (0.5) 0.55 ± (0.37) 0.10 ± (0.02) 0.137 ± (0.039) 0.003 ± (0.000) 0.009 ± (0.001) Lime 4.9 ± (0.0) 2.9 ± (0.6) 0.23 ± (0.08) 0.07 ± (0.03) 0.099 ± (0.023) 0.005 ± (0.001) 0.008 ± (0.000) Control
20-40
4.8 ± (0.1) 5.2 ± (0.3) 0.27 ± (0.07) 0.09 ± (0.03) 0.105 ± (0.022) 13.032 ± (19.538) nd* Silicate 4.8 ± (0.0) 5.3 ± (0.5) 0.29 ± (0.11) 0.13 ± (0.03) 0.127 ± (0.027) 0.009 ± (0.004) 0.022 ± (0.000) Lime 4.9 ± (0.0) 5.6 ± (0.5) 0.23 ± (0.07) 0.10 ± (0.02) 0.129 ± (0.014) 0.009 ± (0.001) 0.008 ± (0.000) Control
40-60
4.7 ± (0.3) 3.8 ± (0.4) 0.19 ± (0.04) 0.07 ± (0.03) 0.145 ± (0.056) 0.005 ± (0.001) 0.010 ± (0.000) Silicate 4.9 ± (0.0) 3.6 ± (0.5) 0.20 ± (0.05) 0.07 ± (0.01) 0.146 ± (0.037) 0.008 ± (0.004) 0.010 ± (0.000) Lime 4.9 ± (0.0) 3.6 ± (0.4) 0.20 ± (0.08) 0.08 ± (0.01) 0.133 ± (0.017) 0.005 ± (0.002) nd*
Treatment Depth Al Ca Mg K Si Fe I
cm --- mmol L−1 ---Control
0-5
0.17 ± (0.12) 0.10 ± (0.03) 0.12 ± (0.04) 0.39 ± (0.30) 0.14 ± (0.06) 0.020 ± (0.010) 1.32 ± (0.42) Silicate 0.10 ± (0.06) 0.33 ± (0.07) 0.21 ± (0.05) 0.36 ± (0.09) 0.10 ± (0.04) 0.014 ± (0.006) 1.84 ± (0.27) Lime 0.39 ± (0.26) 0.25 ± (0.06) 0.21 ± (0.04) 0.32 ± (0.09) 0.36 ± (0.25) 0.056 ± (0.040) 1.89 ± (0.43) Control
5-10
0.03 ± (0.03) 0.14 ± (0.06) 0.10 ± (0.04) 0.21 ± (0.14) 0.06 ± (0.04) 0.005 ± (0.003) 1.02 ± (0.39) Silicate 0.07 ± (0.01) 0.24 ± (0.03) 0.16 ± (0.03) 0.17 ± (0.03) 0.07 ± (0.02) 0.012 ± (0.004) 1.58 ± (0.23) Lime 0.07 ± (0.05) 0.17 ± (0.03) 0.13 ± (0.04) 0.18 ± (0.07) 0.08 ± (0.05) 0.011 ± (0.008) 1.13 ± (0.19) Control
10-20
0.01 ± (0.00) 0.09 ± (0.02) 0.06 ± (0.01) 0.09 ± (0.04) 0.03 ± (0.02) 0.001 ± (0.001) 0.72 ± (0.14) Silicate 0.01 ± (0.01) 0.17 ± (0.04) 0.12 ± (0.03) 0.010 ± (0.04) 0.03 ± (0.02) 0.002 ± (0.002) 1.20 ± (0.34) Lime 0.01 ± (0.01) 0.11 ± (0.02) 0.08 ± (0.01) 0.12 ± (0.06) 0.03 ± (0.01) 0.003 ± (0.002) 0.82 ± (0.04) Control
20-40
0.01 ± (0.00) 0.14 ± (0.05) 0.09 ± (0.02) 0.11 ± (0.01) 0.04 ± (0.02) 0.001 ± (0.001) 280.01 ± (418.65) Silicate 0.01 ± (0.00) 0.15 ± (0.06) 0.09 ± (0.03) 0.07 ± (0.02) 0.05 ± (0.04) 0.002 ± (0.002) 0.95 ± (0.11) Lime 0.01 ± (0.00) 0.15 ± (0.05) 0.10 ± (0.02) 0.09 ± (0.04) 0.03 ± (0.02) 0.001 ± (0.001) 0.94 ± (0.13) Control
40-60
0.01 ± (0.01) 0.10 ± (0.06) 0.06 ± (0.03) 0.05 ± (0.04) 0.04 ± (0.03) 0.004 ± (0.004) 0.65 ± (0.23) Silicate 0.03 ± (0.01) 0.15 ± (0.06) 0.08 ± (0.02) 0.05 ± (0.02) 0.04 ± (0.03) 0.005 ± (0.006) 0.87 ± (0.18) Lime 0.02 ± (0.01) 0.14 ± (0.06) 0.08 ± (0.02) 0.05 ± (0.02) 0.03 ± (0.02) 0.003 ± (0.003) 0.88 ± (0.22)
Treatment Depth Mn Cu Zn Na N-NO2
− P-PO
4
3− S
cm --- mmol L−1 ---Control
0-5
0.018 ± (0.008) 0.0002 ± (0.0001) 0.0004 ± (0.0002) 0.06 ± (0.05) nd* 0.0045 ± (0.0021) 0.135 ± (0.041) Silicate 0.001 ± (0.001) 0.0004 ± (0.0001) 0.0001 ± (0.0001) 0.05 ± (0.04) 0.056 ±(0.038) 0.0036 ± (0.0009) 0.187 ± (0.041) Lime 0.003 ± (0.002) 0.0004 ± (0.0001) 0.0001 ± (0.0001) 0.04 ± (0.03) 0.008 ± (0.005) 0.0053 ± (0.0031) 0.138 ± (0.051) Control
5-10
0.018 ± (0.008) 0.0001 ± (0.0000) 0.0005 ± (0.0002) 0.10 ± (0.06) nd* 0.0020 ± (0.0002) 0.089 ± (0.016) Silicate 0.003 ± (0.002) 0.0002 ± (0.0000) 0.0003 ± (0.0001) 0.05 ± (0.04) 0.005 ± (0.002) 0.0031 ± (0.0009) 0.255 ± (0.084) Lime 0.006 ± (0.001) 0.0002 ± (0.0000) 0.0005 ± (0.0002) 0.03 ± (0.03) 0.007 ± (0.005) 0.0038 ± (0.0018) 0.146 ± (0.041) Control
10-20
0.011 ± (0.005) 0.0001 ± (0.0000) 0.0004 ± (0.0001) 0.06 ± (0.07) nd* 0.0012 ± (0.0000) 0.062 ± (0.011) Silicate 0.007 ± (0.001) 0.0001 ± (0.0000) 0.0003 ± (0.0001) 0.05 ± (0.03) nd* 0.0011 ± (0.0000) 0.129 ± (0.022) Lime 0.010 ± (0.004) 0.0001 ± (0.0000) 0.0002 ± (0.0001) 0.04 ± (0.03) 0.002 ± (0.000) 0.0016 ± (0.0003) 0.114 ± (0.018) Control
20-40
17.751 ± (26.601) 0.2076 ± (0.2767) 0.3717 ± (0.5573) 0.07 ± (0.05) 0.004 ± (0.002) 4.2502 ± (6.3721) 142.526 ± (213.627) Silicate 0.018 ± (0.007) 0.0001 ± (0.0000) 0.0001 ± (0.0000) 0.06 ± (0.04) 0.002 ± (0.000) 0.0029 ± (0.0012) 0.121 ± (0.037) Lime 0.012 ± (0.004) 0.0000 ± (0.0000) 0.0001 ± (0.0001) 0.06 ± (0.03) 0.002 ± (0.000) 0.0028 ± (0.0013) 0.151 ± (0.028) Control
40-60
0.004 ± (0.002) 0.0000 ± (0.0000) 0.0001 ± (0.0001) 0.07 ± (0.05) 0.005 ± (0.000) 0.0016 ± (0.0005) 0.099 ± (0.038) Silicate 0.010 ± (0.007) 0.0000 ± (0.0000) 0.0001 ± (0.0000) 0.06 ± (0.03) 0.003 ± (0.000) 0.0026 ± (0.0012) 0.135 ± (0.056) Lime 0.005 ± (0.002) 0.0000 ± (0.0000) 0.0001 ± (0.0000) 0.07 ± (0.04) nd* 0.0018 ± (0.0006) 0.139 ± (0.025) Values between parentheses mean the average deviation (n = 4); nd* = not detected: QL: F– = 0.0026; N-NO
2
On average, aAl3+ corresponded to approximately 3 % of the total aluminum concentration in all five soil layers for all treatments studied. Zambrosi et al. (2007) found differences of almost 1 % in their study compared
to 40 % in other authors’ studies for aAl3+ in relation to Alt, respectively. However, these other authors did not determine the fluoride content (F−) for calculating the activity of aluminum in solution. Fluoride ions (F−
an-Table 4 − Acidity correctives, pH values, dissolved organic carbon (DOC), inorganic anions, cations and ionic strength (I), micronutrients, sodium, nitrite, phosphate and sulfur on soil solution in five depths of an Oxisol under no-tillage, in Season – Off-season system. QL = quantification limit, mmol L−1.
Season - Off-season
Treatment Depth pH DOC N-NO3− Cl− S-SO
4
2− P F−
cm --- mmol L−1 ---Control
0-5
5.2 ± (0.0) 5.7 ± (1.2) 0.64 ± (0.24) 0.09 ± (0.02) 0.105 ± (0.029) 0.014 ± (0.003) 0.010 ± (0.001) Silicate 5.8 ± (0.1) 4.5 ± (1.1) 0.44 ± (0.06) 0.07 ± (0.01) 0.134 ± (0.090) 0.008 ± (0.001) 0.026 ± (0.009) Lime 6.3 ± (0.0) 6.5 ± (2.1) 0.57 ± (0.29) 0.07 ± (0.01) 0.084 ± (0.021) 0.016 ± (0.004) 0.020 ± (0.005) Control
5-10
5.0 ± (0.0) 3.7 ± (1.4) 0.33 ± (0.06) 0.10 ± (0.02) 0.081 ± (0.018) 0.011 ± (0.006) 0.025 ± (0.024) Silicate 5.3 ± (0.1) 4.0 ± (1.7) 0.37 ± (0.13) 0.06 ± (0.02) 0.131 ± (0.024) 0.015 ± (0.008) 0.010 ± (0.002) Lime 5.5 ± (0.1) 5.4 ± (1.0) 0.73 ± (0.69) 0.06 ± (0.01) 0.113 ± (0.020) 0.016 ± (0.005) 0.011 ± (0.003) Control
10-20
4.9 ± (0.1) 1.6 ± (0.5) 0.32 ± (0.07) 0.14 ± (0.04) 0.075 ± (0.015) nd* 0.010 ± (0.000) Silicate 5.2 ± (0.1) 2.2 ± (0.6) 0.33 ± (0.17) 0.07 ± (0.02) 0.112 ± (0.038) 0.007 ± (0.001) 0.011 ± (0.001) Lime 5.0 ± (0.0) 3.6 ± (0.6) 0.39 ± (0.09) 0.07 ± (0.01) 0.086 ± (0.015) 0.009 ± (0.003) 0.010 ± (0.001) Control
20-40
5.1 ± (0.2) 5.0 ± (0.0) 0.22 ± (0.09) 0.08 ± (0.03) 0.154 ± (0.011) 0.007 ± (0.001) nd* Silicate 4.7 ± (0.3) 4.6 ± (0.6) 0.24 ± (0.06) 0.08 ± (0.02) 0.119 ± (0.004) 0.009 ± (0.003) nd* Lime 4.9 ± (0.0) 4.6 ± (0.6) 0.39 ± (0.09) 0.11 ± (0.01) 0.109 ± (0.040) 0.009 ± (0.004) 0.008 ± (0.000) Control
40-60
5.0 ± (0.0) 3.9 ± (0.5) 0.23 ± (0.06) 0.09 ± (0.02) 0.128 ± (0.023) 0.014 ± (0.000) nd* Silicate 4.9 ± (0.0) 3.7 ± (0.9) 0.30 ± (0.13) 0.10 ± (0.02) 0.137 ± (0.023) 0.004 ± (0.001) nd* Lime 5.1 ± (0.0) 3.5 ± (0.2) 0.26 ± (0.10) 0.08 ± (0.01) 0.130 ± (0.047) 0.005 ± (0.001) 0.013 ± (0.004)
Treatments Depth Al Ca Mg K Si Fe I
cm --- mmol L−1 ---Control
0-5
0.39 ± (0.35) 0.18 ± (0.04) 0.13 ± (0.03) 0.36 ± (0.13) 0.35 ± (0.30) 0.049 ± (0.041) 1.83 ± (0.69) Silicate 0.04 ± (0.02) 0.34 ± (0.10) 0.20 ± (0.05) 0.22 ± (0.07) 0.05 ± (0.03) 0.007 ± (0.005) 1.62 ± (0.31) Lime 0.13 ± (0.12) 0.40 ± (0.09) 0.26 ± (0.07) 0.32 ± (0.20) 0.12 ± (0.10) 0.016 ± (0.011) 1.79 ± (0.64) Control
5-10
0.08 ± (0.06) 0.15 ± (0.05) 0.09 ± (0.02) 0.13 ± (0.05) 0.08 ± (0.05) 0.011 ± (0.008) 0.95 ± (0.19) Silicate 0.06 ± (0.04) 0.22 ± (0.08) 0.15 ± (0.04) 0.13 ± (0.02) 0.07 ± (0.04) 0.009 ± (0.009) 1.26 ± (0.24) Lime 0.13 ± (0.06) 0.22 ± (0.05) 0.16 ± (0.05) 0.15 ± (0.09) 0.11 ± (0.05) 0.020 ± (0.011) 1.44 ± (0.43) Control
10-20
0.01 ± (0.01) 0.15 ± (0.04) 0.08 ± (0.02) 0.07 ± (0.02) 0.02 ± (0.01) 0.001 ± (0.000) 0.87 ± (0.08) Silicate 0.02 ± (0.01) 0.16 ± (0.05) 0.11 ± (0.03) 0.10 ± (0.06) 0.03 ± (0.02) 0.004 ± (0.004) 1.00 ± (0.33) Lime 0.03 ± (0.02) 0.17 ± (0.04) 0.12 ± (0.02) 0.09 ± (0.05) 0.06 ± (0.02) 0.003 ± (0.002) 1.00 ± (0.19) Control
20-40
nd* 0.14 ± (0.03) 0.09 ± (0.02) 0.06 ± (0.03) 0.02 ± (0.00) 0.000 ± (0.000) 0.92 ± (0.00) Silicate 0.01 ± (0.00) 0.14 ± (0.04) 0.10 ± (0.03) 0.07 ± (0.03) 0.04 ± (0.02) 0.001 ± (0.001) 0.96 ± (0.14) Lime 0.02 ± (0.02) 0.17 ± (0.04) 0.10 ± (0.02) 0.07 ± (0.03) 0.05 ± (0.02) 0.003 ± (0.003) 1.01 ± (0.14) Control
40-60
0.00 ± (0.00) 0.12 ± (0.04) 0.07 ± (0.02) 0.04 ± (0.01) 0.03 ± (0.02) 0.000 ± (0.000) 0.63 ± (0.23) Silicate 0.01 ± (0.00) 0.18 ± (0.10) 0.10 ± (0.03) 0.05 ± (0.02) 0.04 ± (0.03) 0.000 ± (0.000) 1.01 ± (0.29) Lime 0.05 ± (0.04) 0.17 ± (0.06) 0.09 ± (0.02) 0.05 ± (0.02) 0.05 ± (0.02) 0.006 ± (0.005) 0.94 ± (0.23)
Treatments Depth Mn Cu Zn Na N-NO2
− P-PO
4
3− S
cm --- mmol L−1 ---Control
0-5
0.007 ± (0.002) 0.0003 ± (0.0001) 0.0002 ± (0.0000) 0.04 ± (0.03) 0.006 ± (0.004) 0.0045 ± (0.0001) 0.123 ± (0.032) Silicate 0.010 ± (0.011) 0.0002 ± (0.0001) 0.0002 ± (0.0001) 0.03 ± (0.03) 0.022 ± (0.018) 0.0027 ± (0.0002) 0.165 ± (0.100) Lime 0.002 ± (0.001) 0.0003 ± (0.0001) 0.0000 ± (0.0000) 0.04 ± (0.03) 0.047 ± (0.028) 0.0052 ± (0.0001) 0.117 ± (0.042) Control
5-10
0.005 ± (0.001) 0.0001 ± (0.0000) 0.0002 ± (0.0001) 0.03 ± (0.03) 0.003 ± (0.000) 0.0035 ± (0.0018) 0.086 ± (0.020) Silicate 0.004 ± (0.003) 0.0001 ± (0.0001) 0.0002 ± (0.0001) 0.03 ± (0.03) 0.005 ± (0.001) 0.0048 ± (0.0027) 0.158 ± (0.039) Lime 0.005 ± (0.003) 0.0002 ± (0.0000) 0.0001 ± (0.0000) 0.03 ± (0.03) 0.007 ± (0.004) 0.0053 ± (0.0017) 0.127 ± (0.028) Control
10-20
0.006 ± (0.003) 0.0000 ± (0.0000) 0.0002 ± (0.0000) 0.03 ± (0.03) 0.004 ± (0.000) nd* 0.075 ± (0.011) Silicate 0.003 ± (0.002) 0.0001 ± (0.0000) 0.0002 ± (0.0001) 0.03 ± (0.03) 0.005 ± (0.000) 0.0022 ± (0.0002) 0.126 ± (0.031) Lime 0.012 ± (0.006) 0.0001 ± (0.0000) 0.0003 ± (0.0002) 0.03 ± (0.03) 0.003 ± (0.000) 0.0030 ± (0.0010) 0.096 ± (0.009) Control
20-40
0.009 ± (0.002) nd* 0.0002 ± (0.0001) 0.05 ± (0.00) 0.006 ± (0.000) 0.0024 ± (0.0003) 0.162 ± (0.049) Silicate 0.010 ± (0.004) 0.0000 ± (0.0000) 0.0002 ± (0.0001) 0.06 ± (0.01) 0.002 ± (0.000) 0.0028 ± (0.0011) 0.149 ± (0.012) Lime 0.016 ± (0.006) 0.0001 ± (0.0000) 0.0002 ± (0.0001) 0.06 ± (0.03) 0.005 ± (0.004) 0.0029 ± (0.0013) 0.112 ± (0.026) Control
40-60
0.010 ± (0.006) 0.0000 ± (0.0000) 0.0001 ± (0.0000) 0.05 ± (0.01) 0.003 ± (0.001) 0.0046 ± (0.0000) 0.123 ± (0.013) Silicate 0.008 ± (0.004) 0.0000 ± (0.0000) 0.0001 ± (0.0001) 0.07 ± (0.02) 0.002 ± (0.000) 0.0014 ± (0.0002) 0.145 ± (0.025) Lime 0.004 ± (0.003) 0.0001 ± (0.0000) 0.0001 ± (0.0001) 0.07 ± (0.05) 0.009 ± (0.007) 0.0016 ± (0.0002) 0.105 ± (0.047) Values between parentheses mean the average deviation (n = 4); nd* = not detected: QL: P = 0.0032; F– = 0.0026; Al = 0.0022; Cu = 0.00003; P-PO
4
ions) combine strongly with Al3+ (Merino et al., 1998), greatly reducing aAl3+ in solution. This is due to the high stability constant (log β) which exists between the com-plexes formed (log β AlF2+, AlF
2 +, AlF
3, AlF4 −, AlF
5 2− and
AlF63− = 6.13; 11.15; 15.00; 17.75; 19.37 and 19.84 at 20 °C, respectively). The higher the stability constant of an ionic pair, the lower the activity of the free forms of the ions in solution.
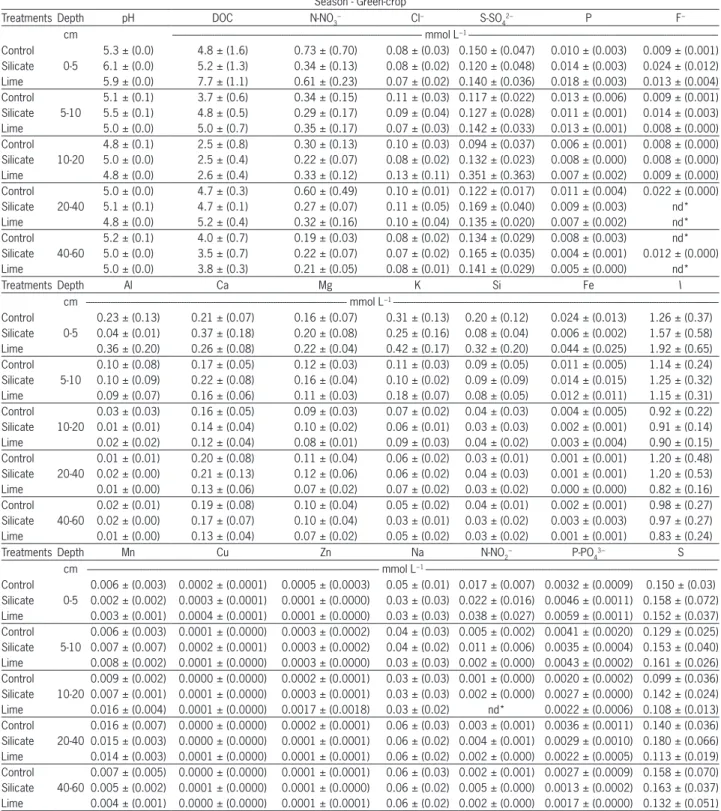
Table 5 − Acidity correctives, pH values, dissolved organic carbon (DOC), inorganic anions, cations and ionic strength (I), micronutrients, sodium, nitrite, phosphate and sulfur on soil solution at five depths of an Oxisol under no-tillage, in Season – Green-crop system. QL = quantification limit, mmol L−1.
Season - Green-crop
Treatments Depth pH DOC N-NO3
− Cl− S-SO
4
2− P F−
cm --- mmol L−1 ---Control
0-5
5.3 ± (0.0) 4.8 ± (1.6) 0.73 ± (0.70) 0.08 ± (0.03) 0.150 ± (0.047) 0.010 ± (0.003) 0.009 ± (0.001) Silicate 6.1 ± (0.0) 5.2 ± (1.3) 0.34 ± (0.13) 0.08 ± (0.02) 0.120 ± (0.048) 0.014 ± (0.003) 0.024 ± (0.012) Lime 5.9 ± (0.0) 7.7 ± (1.1) 0.61 ± (0.23) 0.07 ± (0.02) 0.140 ± (0.036) 0.018 ± (0.003) 0.013 ± (0.004) Control
5-10
5.1 ± (0.1) 3.7 ± (0.6) 0.34 ± (0.15) 0.11 ± (0.03) 0.117 ± (0.022) 0.013 ± (0.006) 0.009 ± (0.001) Silicate 5.5 ± (0.1) 4.8 ± (0.5) 0.29 ± (0.17) 0.09 ± (0.04) 0.127 ± (0.028) 0.011 ± (0.001) 0.014 ± (0.003) Lime 5.0 ± (0.0) 5.0 ± (0.7) 0.35 ± (0.17) 0.07 ± (0.03) 0.142 ± (0.033) 0.013 ± (0.001) 0.008 ± (0.000) Control
10-20
4.8 ± (0.1) 2.5 ± (0.8) 0.30 ± (0.13) 0.10 ± (0.03) 0.094 ± (0.037) 0.006 ± (0.001) 0.008 ± (0.000) Silicate 5.0 ± (0.0) 2.5 ± (0.4) 0.22 ± (0.07) 0.08 ± (0.02) 0.132 ± (0.023) 0.008 ± (0.000) 0.008 ± (0.000) Lime 4.8 ± (0.0) 2.6 ± (0.4) 0.33 ± (0.12) 0.13 ± (0.11) 0.351 ± (0.363) 0.007 ± (0.002) 0.009 ± (0.000) Control
20-40
5.0 ± (0.0) 4.7 ± (0.3) 0.60 ± (0.49) 0.10 ± (0.01) 0.122 ± (0.017) 0.011 ± (0.004) 0.022 ± (0.000) Silicate 5.1 ± (0.1) 4.7 ± (0.1) 0.27 ± (0.07) 0.11 ± (0.05) 0.169 ± (0.040) 0.009 ± (0.003) nd* Lime 4.8 ± (0.0) 5.2 ± (0.4) 0.32 ± (0.16) 0.10 ± (0.04) 0.135 ± (0.020) 0.007 ± (0.002) nd* Control
40-60
5.2 ± (0.1) 4.0 ± (0.7) 0.19 ± (0.03) 0.08 ± (0.02) 0.134 ± (0.029) 0.008 ± (0.003) nd* Silicate 5.0 ± (0.0) 3.5 ± (0.7) 0.22 ± (0.07) 0.07 ± (0.02) 0.165 ± (0.035) 0.004 ± (0.001) 0.012 ± (0.000) Lime 5.0 ± (0.0) 3.8 ± (0.3) 0.21 ± (0.05) 0.08 ± (0.01) 0.141 ± (0.029) 0.005 ± (0.000) nd*
Treatments Depth Al Ca Mg K Si Fe I
cm --- mmol L−1 ---Control
0-5
0.23 ± (0.13) 0.21 ± (0.07) 0.16 ± (0.07) 0.31 ± (0.13) 0.20 ± (0.12) 0.024 ± (0.013) 1.26 ± (0.37) Silicate 0.04 ± (0.01) 0.37 ± (0.18) 0.20 ± (0.08) 0.25 ± (0.16) 0.08 ± (0.04) 0.006 ± (0.002) 1.57 ± (0.58) Lime 0.36 ± (0.20) 0.26 ± (0.08) 0.22 ± (0.04) 0.42 ± (0.17) 0.32 ± (0.20) 0.044 ± (0.025) 1.92 ± (0.65) Control
5-10
0.10 ± (0.08) 0.17 ± (0.05) 0.12 ± (0.03) 0.11 ± (0.03) 0.09 ± (0.05) 0.011 ± (0.005) 1.14 ± (0.24) Silicate 0.10 ± (0.09) 0.22 ± (0.08) 0.16 ± (0.04) 0.10 ± (0.02) 0.09 ± (0.09) 0.014 ± (0.015) 1.25 ± (0.32) Lime 0.09 ± (0.07) 0.16 ± (0.06) 0.11 ± (0.03) 0.18 ± (0.07) 0.08 ± (0.05) 0.012 ± (0.011) 1.15 ± (0.31) Control
10-20
0.03 ± (0.03) 0.16 ± (0.05) 0.09 ± (0.03) 0.07 ± (0.02) 0.04 ± (0.03) 0.004 ± (0.005) 0.92 ± (0.22) Silicate 0.01 ± (0.01) 0.14 ± (0.04) 0.10 ± (0.02) 0.06 ± (0.01) 0.03 ± (0.03) 0.002 ± (0.001) 0.91 ± (0.14) Lime 0.02 ± (0.02) 0.12 ± (0.04) 0.08 ± (0.01) 0.09 ± (0.03) 0.04 ± (0.02) 0.003 ± (0.004) 0.90 ± (0.15) Control
20-40
0.01 ± (0.01) 0.20 ± (0.08) 0.11 ± (0.04) 0.06 ± (0.02) 0.03 ± (0.01) 0.001 ± (0.001) 1.20 ± (0.48) Silicate 0.02 ± (0.00) 0.21 ± (0.13) 0.12 ± (0.06) 0.06 ± (0.02) 0.04 ± (0.03) 0.001 ± (0.001) 1.20 ± (0.53) Lime 0.01 ± (0.00) 0.13 ± (0.06) 0.07 ± (0.02) 0.07 ± (0.02) 0.03 ± (0.02) 0.000 ± (0.000) 0.82 ± (0.16) Control
40-60
0.02 ± (0.01) 0.19 ± (0.08) 0.10 ± (0.04) 0.05 ± (0.02) 0.04 ± (0.01) 0.002 ± (0.001) 0.98 ± (0.27) Silicate 0.02 ± (0.00) 0.17 ± (0.07) 0.10 ± (0.04) 0.03 ± (0.01) 0.03 ± (0.02) 0.003 ± (0.003) 0.97 ± (0.27) Lime 0.01 ± (0.00) 0.13 ± (0.04) 0.07 ± (0.02) 0.05 ± (0.02) 0.03 ± (0.02) 0.001 ± (0.001) 0.83 ± (0.24)
Treatments Depth Mn Cu Zn Na N-NO2
− P-PO
4
3− S
cm --- mmol L−1 ---Control
0-5
0.006 ± (0.003) 0.0002 ± (0.0001) 0.0005 ± (0.0003) 0.05 ± (0.01) 0.017 ± (0.007) 0.0032 ± (0.0009) 0.150 ± (0.03) Silicate 0.002 ± (0.002) 0.0003 ± (0.0001) 0.0001 ± (0.0000) 0.03 ± (0.03) 0.022 ± (0.016) 0.0046 ± (0.0011) 0.158 ± (0.072) Lime 0.003 ± (0.001) 0.0004 ± (0.0001) 0.0001 ± (0.0000) 0.03 ± (0.03) 0.038 ± (0.027) 0.0059 ± (0.0011) 0.152 ± (0.037) Control
5-10
0.006 ± (0.003) 0.0001 ± (0.0000) 0.0003 ± (0.0002) 0.04 ± (0.03) 0.005 ± (0.002) 0.0041 ± (0.0020) 0.129 ± (0.025) Silicate 0.007 ± (0.007) 0.0002 ± (0.0001) 0.0003 ± (0.0002) 0.04 ± (0.02) 0.011 ± (0.006) 0.0035 ± (0.0004) 0.153 ± (0.040) Lime 0.008 ± (0.002) 0.0001 ± (0.0000) 0.0003 ± (0.0000) 0.03 ± (0.03) 0.002 ± (0.000) 0.0043 ± (0.0002) 0.161 ± (0.026) Control
10-20
0.009 ± (0.002) 0.0000 ± (0.0000) 0.0002 ± (0.0001) 0.03 ± (0.03) 0.001 ± (0.000) 0.0020 ± (0.0002) 0.099 ± (0.036) Silicate 0.007 ± (0.001) 0.0001 ± (0.0000) 0.0003 ± (0.0001) 0.03 ± (0.03) 0.002 ± (0.000) 0.0027 ± (0.0000) 0.142 ± (0.024) Lime 0.016 ± (0.004) 0.0001 ± (0.0000) 0.0017 ± (0.0018) 0.03 ± (0.02) nd* 0.0022 ± (0.0006) 0.108 ± (0.013) Control
20-40
0.016 ± (0.007) 0.0000 ± (0.0000) 0.0002 ± (0.0001) 0.06 ± (0.03) 0.003 ± (0.001) 0.0036 ± (0.0011) 0.140 ± (0.036) Silicate 0.015 ± (0.003) 0.0000 ± (0.0000) 0.0001 ± (0.0001) 0.06 ± (0.02) 0.004 ± (0.001) 0.0029 ± (0.0010) 0.180 ± (0.066) Lime 0.014 ± (0.003) 0.0001 ± (0.0000) 0.0001 ± (0.0001) 0.06 ± (0.02) 0.002 ± (0.000) 0.0022 ± (0.0005) 0.113 ± (0.019) Control
40-60
0.007 ± (0.005) 0.0000 ± (0.0000) 0.0001 ± (0.0001) 0.06 ± (0.03) 0.002 ± (0.001) 0.0027 ± (0.0009) 0.158 ± (0.070) Silicate 0.005 ± (0.002) 0.0001 ± (0.0000) 0.0001 ± (0.0000) 0.06 ± (0.02) 0.005 ± (0.000) 0.0013 ± (0.0002) 0.163 ± (0.037) Lime 0.004 ± (0.001) 0.0000 ± (0.0000) 0.0001 ± (0.0001) 0.06 ± (0.02) 0.002 ± (0.000) 0.0017 ± (0.0000) 0.132 ± (0.051) Values between parentheses mean the average deviation (n = 4); nd* = not detected: QL: F– = 0.0026; N-NO
2
Bessho and Bell (1992) found that the addition of lime (CaCO3) and the leaves of leguminous plants and straw bean plants in samples of the surface layer of an Oxisol reduced the activity of aluminum monomeric
species, which corresponded to 20 % of the total Al con-centration in solution. This occurrence is attributable to the formation of aluminum ion complexes with organic compounds released by plant residues, as well as Al3+
Table 6 − Acidity correctives, pH values, dissolved organic carbon (DOC), inorganic anions, cations and ionic strength (I), micronutrients, sodium, nitrite, phosphate and sulfur on soil solution at five depths of an Oxisol under no-tillage, in Season – Fallow system. QL = quantification limit, mmol L−1.
Season - Fallow
Treatments Depth pH DOC N-NO3− Cl− S-SO
4
2− P F−
cm --- mmol L−1 ---Control
0-5
4.8 ± (0.0) 3.1 ± (1.5) 0.45 ± (0.33) 0.10 ± (0.05) 0.178 ± (0.005) 0.007 ± (0.005) 0.008 ± (0.001) Silicate 6.4 ± (0.0) 5.5 ± (0.5) 0.97 ± (0.69) 0.09 ± (0.01) 0.212 ± (0.005) 0.020 ± (0.005) 0.030 ± (0.014) Lime 6.1 ± (0.1) 5.8 ± (0.8) 0.61 ± (0.24) 0.07 ± (0.02) 0.185 ± (0.005) 0.021 ± (0.005) 0.015 ± (0.003) Control
5-10
4.6 ± (0.1) 3.2 ± (0.6) 0.35 ± (0.09) 0.14 ± (0.08) 0.138 ± (0.005) 0.013 ± (0.005) 0.009 ± (0.002) Silicate 5.5 ± (0.1) 4.5 ± (1.3) 0.38 ± (0.10) 0.16 ± (0.13) 0.226 ± (0.005) 0.014 ± (0.005) 0.017 ± (0.004) Lime 5.3 ± (0.1) 3.5 ± (0.5) 0.39 ± (0.02) 0.09 ± (0.03) 0.197 ± (0.005) 0.014 ± (0.005) 0.009 ± (0.001) Control
10-20
4.4 ± (0.0) 1.8 ± (0.5) 0.44 ± (0.19) 0.19 ± (0.06) 0.085 ± (0.005) 0.007 ± (0.005) 0.009 ± (0.001) Silicate 4.8 ± (0.1) 1.6 ± (0.3) 0.48 ± (0.17) 0.17 ± (0.06) 0.152 ± (0.005) 0.003 ± (0.005) 0.009 ± (0.000) Lime 4.8 ± (0.1) 1.6 ± (0.2) 0.51 ± (0.06) 0.18 ± (0.05) 0.124 ± (0.005) 0.004 ± (0.005) 0.010 ± (0.001) Control
20-40
4.6 ± (0.1) 4.9 ± (0.3) 0.38 ± (0.07) 0.16 ± (0.03) 0.106 ± (0.005) 0.011 ± (0.005) 0.009 ± (0.000) Silicate 4.9 ± (0.1) 4.7 ± (0.4) 0.46 ± (0.14) 0.23 ± (0.12) 0.158 ± (0.005) 0.012 ± (0.005) 0.012 ± (0.000) Lime 4.8 ± (0.1) 4.4 ± (0.6) 0.35 ± (0.02) 0.19 ± (0.05) 0.176 ± (0.005) 0.010 ± (0.005) 0.009 ± (0.000) Control
40-60
4.6 ± (0.3) 3.6 ± (0.6) 0.22 ± (0.06) 0.09 ± (0.02) 0.141 ± (0.005) 0.009 ± (0.005) 0.010 ± (0.000) Silicate 4.7 ± (0.2) 3.3 ± (0.3) 0.35 ± (0.19) 0.10 ± (0.05) 0.175 ± (0.005) 0.008 ± (0.005) 0.010 ± (0.000) Lime 4.6 ± (0.4) 3.1 ± (0.0) 0.24 ± (0.05) 0.10 ± (0.02) 0.173 ± (0.005) 0.012 ± (0.005) nd*
Treatments Depth Al Ca Mg K Si Fe I
cm --- mmol L−1 ---Control
0-5
0.07 ± (0.05) 0.16 ± (0.07) 0.13 ± (0.07) 0.55 ± (0.30) 0.09 ± (0.05) 0.012 ± (0.012) 1.58 ± (0.56) Silicate 0.06 ± (0.04) 0.86 ± (0.07) 0.43 ± (0.25) 0.66 ± (0.46) 0.16 ± (0.06) 0.008 ± (0.003) 3.66 ± (1.69) Lime 0.14 ± (0.04) 0.45 ± (0.07) 0.31 ± (0.14) 0.51 ± (0.23) 0.13 ± (0.04) 0.016 ± (0.004) 2.42 ± (1.01) Control
5-10
0.01 ± (0.00) 0.13 ± (0.07) 0.09 ± (0.04) 0.24 ± (0.10) 0.03 ± (0.02) 0.001 ± (0.000) 1.14 ± (0.34) Silicate 0.04 ± (0.04) 0.31 ± (0.07) 0.19 ± (0.06) 0.16 ± (0.06) 0.04 ± (0.03) 0.006 ± (0.005) 1.75 ± (0.46) Lime 0.04 ± (0.03) 0.24 ± (0.07) 0.17 ± (0.05) 0.16 ± (0.03) 0.04 ± (0.02) 0.005 ± (0.003) 1.57 ± (0.34) Control
10-20
0.01 ± (0.00) 0.14 ± (0.07) 0.09 ± (0.03) 0.14 ± (0.04) 0.02 ± (0.01) 0.000 ± (0.000) 1.09 ± (0.27) Silicate 0.01 ± (0.01) 0.22 ± (0.07) 0.14 ± (0.04) 0.09 ± (0.03) 0.02 ± (0.00) 0.000 ± (0.000) 1.39 ± (0.39) Lime 0.02 ± (0.03) 0.20 ± (0.07) 0.14 ± (0.04) 0.09 ± (0.01) 0.02 ± (0.01) 0.002 ± (0.002) 1.37 ± (0.30) Control
20-40
0.00 ± (0.00) 0.13 ± (0.07) 0.07 ± (0.02) 0.08 ± (0.01) 0.02 ± (0.01) 0.000 ± (0.000) 1.00 ± (0.11) Silicate 0.01 ± (0.01) 0.24 ± (0.07) 0.14 ± (0.05) 0.07 ± (0.01) 0.03 ± (0.02) 0.001 ± (0.000) 1.46 ± (0.43) Lime 0.01 ± (0.00) 0.22 ± (0.07) 0.14 ± (0.05) 0.08 ± (0.01) 0.03 ± (0.01) 0.000 ± (0.000) 1.40 ± (0.21) Control
40-60
0.00 ± (0.00) 0.11 ± (0.07) 0.06 ± (0.02) 0.07 ± (0.01) 0.04 ± (0.03) 0.001 ± (0.000) 0.86 ± (0.10) Silicate 0.01 ± (0.00) 0.18 ± (0.07) 0.10 ± (0.05) 0.05 ± (0.02) 0.02 ± (0.01) 0.000 ± (0.000) 1.14 ± (0.42) Lime 0.02 ± (0.01) 0.12 ± (0.07) 0.07 ± (0.03) 0.06 ± (0.01) 0.03 ± (0.01) 0.003 ± (0.003) 0.88 ± (0.35)
Treatments Depth Mn Cu Zn Na N-NO2
− P-PO
4
3− S
cm --- mmol L−1 ---Control
0-5
0.010 ± (0.004) 0.0001 ± (0.0000) 0.0003 ± (0.0000) 0.05 ± (0.03) 0.020 ± (0.018) 0.0021 ± (0.0005) 0.212 ± (0.077) Silicate 0.001 ± (0.001) 0.0003 ± (0.0001) 0.0000 ± (0.0000) 0.05 ± (0.03) 0.068 ± (0.055) 0.0064 ± (0.0016) 0.265 ± (0.049) Lime 0.002 ± (0.001) 0.0004 ± (0.0001) 0.0000 ± (0.0000) 0.04 ± (0.03) 0.047 ± (0.022) 0.0067 ± (0.0010) 0.238 ± (0.059) Control
5-10
0.018 ± (0.003) 0.0001 ± (0.0000) 0.0008 ± (0.0001) 0.04 ± (0.03) nd* 0.0041 ± (0.0008) 0.163 ± (0.062) Silicate 0.003 ± (0.002) 0.0001 ± (0.0000) 0.0001 ± (0.0001) 0.03 ± (0.02) 0.004 ± (0.001) 0.0045 ± (0.0024) 0.285 ± (0.107) Lime 0.005 ± (0.003) 0.0001 ± (0.0000) 0.0002 ± (0.0001) 0.04 ± (0.03) 0.007 ± (0.000) 0.0046 ± (0.0010) 0.257 ± (0.041) Control
10-20
0.024 ± (0.003) 0.0001 ± (0.0000) 0.0009 ± (0.0001) 0.03 ± (0.02) nd* 0.0022 ± (0.0006) 0.096 ± (0.019) Silicate 0.011 ± (0.007) 0.0000 ± (0.0000) 0.0007 ± (0.0003) 0.03 ± (0.02) nd* 0.0011 ± (0.0000) 0.162 ± (0.018) Lime 0.013 ± (0.006) 0.0000 ± (0.0000) 0.0003 ± (0.0001) 0.03 ± (0.03) nd* 0.0014 ± (0.0002) 0.139 ± (0.012) Control
20-40
0.030 ± (0.003) 0.0001 ± (0.0000) 0.0003 ± (0.0001) 0.06 ± (0.01) 0.003 ± (0.000) 0.0037 ± (0.0010) 0.125 ± (0.043) Silicate 0.026 ± (0.014) 0.0000 ± (0.0000) 0.0002 ± (0.0001) 0.06 ± (0.02) nd* 0.0040 ± (0.0005) 0.177 ± (0.007) Lime 0.021 ± (0.003) 0.0000 ± (0.0000) 0.0002 ± (0.0001) 0.07 ± (0.04) 0.003 ± (0.000) 0.0033 ± (0.0010) 0.219 ± (0.027) Control
40-60
0.008 ± (0.001) 0.0000 ± (0.0000) 0.0001 ± (0.0001) 0.06 ± (0.02) 0.003 ± (0.000) 0.0029 ± (0.0005) 0.161 ± (0.025) Silicate 0.007 ± (0.004) nd* 0.0002 ± (0.0001) 0.06 ± (0.03) 0.002 ± (0.000) 0.0027 ± (0.0008) 0.194 ± (0.033) Lime 0.010 ± (0.005) 0.0000 ± (0.0000) 0.0001 ± (0.0000) 0.04 ± (0.01) nd* 0.0040 ± (0.0007) 0.255 ± (0.034) Values between parentheses mean the average deviation (n = 4); nd* = not detected: QL: F– = 0.0026; N-NO
2
combinations with hydroxyl ions (OH−), residues of lime reaction in the soil surface, both of which contribute sig-nificantly to reducing Al3+ activity in solution.
Correlations between Alt and aAl3+ were posi-tive in all layers with higher coefficients of determina-tion in the first three layers (Figure 1). The low values of aAl3+ compared to the Alt are due to complexation of Al3+ by organic anions, which decreases this ion’s activ-ity in solution, especially in the topsoil layers (Vance et al., 1996). In the deeper layers, where there is little OM activity, low correlation may be related to differences in the concentrations of organic compounds and fluoride (F−) in solution. Failure to correct the pH in the subsur-face, taking into account the fact that the application of correctives occurred in the top surface layers, may also explain the low correlations being related to differences between the concentrations of hydroxyls (OH−) and fluo-ride (F−).
In accordance with the findings of Zambrosi et al. (2008), aluminum was detected in lower quantities in the free form (Al3+), and in greater quantities when forming complexes in the soil solution (Figure 2) regard-less of corrective or crop system adopted. According to Drabeck et al. (2005), the toxicity threat to the plant decreases in the following order: Al13 polymers (except for phosphates and silicates), Al3+, Al(OH)2+, Al(OH)
2 +, Al(OH)3, Al(OH)4− and AlSO
4
+. However, the toxicity of the last four species is not always considered. The free form which is toxic to plants (Al+3) was not very repre-sentative, even in those soil samples which received nei-ther lime nor silicate (Figure 2). The highest value was 15 %, observed in samples under the Season - Off-season system - at a depth of 20-40 cm in the control treatment (Figure 2), probably due to the non-formation of ionic pairing with F− (Table 3). Overall, this species was found with more frequency in the deepest two layers, (the ma-jor part in the 40-60 cm layer) where the performance of OM and correctives is generally poor.
According to an average based on all the treat-ments, the Al-DOC species was predominant in the majority of cases, surpassed by the Al-F species only in the 0-20 cm layer under two systems - Season - Forage and Season - Fallow (Figure 2), and the Al-OH species in the upper surface layer (0-5 cm) of the Season - Fallow system under which both correctives were applied; the Season - Green-crop system, under which calcium-mag-nesium silicates were added; and Season - Off-season system under which only lime was added (Figure 2).
The Season - Fallow system does not maintain veg-etation in the soil during the off-season, which reduces the supply of both OM in the soil and, consequently, or-ganic acids mineralized during OM decomposition. The organic anions derived from these acids form complexes with Al (Al-DOC), and this accounts for the higher per-centage of Al-OH species, compared to the Al-DOC spe-cies, in the upper layers. OM decomposition under the Season - Fallow system may have occurred gradually, and is possibly explained by several factors, including
higher Si in the grasses, which adds rigidity to the plant structure and retards its rate of decomposition (Ramos et al., 2006). In the deeper layers of the soil, where there is no strong presence of organic compounds or correctives, the F− will prevail when combining with Al (Zambrosi et al., 2007), which also depends on the concentration and activity of the fluoride in solution.
Although, in general, the greater part of the root system of crops of agricultural interest is to be found in the first 10 cm below the surface, the root system can ex-tend down to 40 cm. The complexation of Al by DOC, up to a depth of 40 cm, remained unaffected by acidity cor-rectives treatments (Zambrosi et al., 2008). Alleoni et al. (2010) observed that the proportion of Al-DOC in the soil solution under NT was approximately 85 % in the layer from 0.0 to 0.2 m, and this proportion was only slightly affected by the application of lime on the surface. Adams et al. (1999) found that the amount of Al-DOC positively correlated with concentrations of dissolved humic sub-stances (high molecular weight) in acidic soils in New Zealand. Thus, the dissolved organic anions gain stabil-ity from complexing with Al in solution, and its contri-bution depends on the OM activity in the soil.
Generally, all species bind to the F− ion and or-ganic compounds (DOC), and precipitate as Al(OH)3. Al-though Al13 (Al3+) is the most toxic, or most damaging, species to plant root systems it is not usually present in high numbers in soils (Drabeck et al., 2005), as was revealed by our study. Even under the natural condi-tions of acidic soils where, in solution, low to moder-ate concentrations of Al3+ of the complexes formed can be observed between aluminum and fluoride (Al-F) and aluminum and dissolved organic carbon (Al-DOC) still prevails as the most commonly found aluminum species (Merino et al., 1998). Fluoride (F−), which strongly petes with DOC, was responsible for the strong com-plexation of Al in soil solution (Figure 2), given that the magnitude of such complexation, particularly in highly acidic soils (pH < 4.8) is of fundamental importance, since it reduces the toxicity by the Al-Fx species forma-tion (Alva and Sumner, 1988).
Where the complexation of Al by F− is intense, it is possible that there has been an application of phosphate fertilizers containing fluoride (Zambrosi et al., 2007). In this study, the average content of F− in the samples was 0.24 mg L−1, well below that normally present in natu-ral conditions, around 1 mg L−1 (Noemmik, 1953). Thus, aluminum complexes with phosphates and sulfates pre-vail over Al-Fx in samples with F−concentrations that are reduced or even absent, but are almost always less than the amounts of Al-DOC.
Sulfate (S-SO42−) and phosphate (P-HxPO
Tables 3, 4, 5 and 6). Si complexation by Al and the for-mation of the AlH3SiO42+ species appeared in negligible quantities, in general, reaching a level less than 1 % of all species of Al.
Sulfate and phosphate have similar binding con-stant values for complex formation with Al, which are both very much lower than the binding constant values between Al and F (Walthall and Lindsay, 1996). These
complexes follow a descending order of stability: AlF2+ > AlH2PO42+ > AlSO
4
+ with K
0 log values equal to 6.98, 3.50 and 3.10, respectively (Lindsay and Walthall, 1995). In many cases, the chemical species Al-HxPO4x (AlH-PO4+ + Al
2PO4
3+) are barely detected (Zambrosi et al., 2008), which could also be due to the low concentration of phosphate ion in solution (Tables 3, 4, 5 and 6). In our study, sulfate also minimally influenced Al behav-Figure 2 – Chemical species of aluminum (%) in solution of an Oxisol under NT as a function of acidity amendments and crop systems. Vertical
bars represent the mean deviation of replications for each treatment (n = 4). Al-OH = Al(OH)2+ + Al(OH)2+ + Al(OH) 3
0; Al-F = Al(F) 2
+ + Al(F)2+ + Al(F)30 + Al(F)
4
−. Other species: AlHPO 4
+ + Al 2(PO4)
3+ + AlSO 4
+ + AlH 3SiO4
ior in solution. According to Alvarez et al. (2002), the AlSO4+ species, non-toxic to plants (Pavan et al., 1982), was rarely found in Spanish soils which have different parent materials. Zambrosi et al. (2008) reported small increases in participation of the Al-SO4+ species after the application of gypsum.
Liming and silicate application promoted an in-crease in the amount of hydroxylated forms of Al (Al-OH) due to the increased pH of the solution, especially in the first layer (Figure 2), and such forms are consid-ered less toxic to plants than the free form Al+3. The range of variation in pH in this layer (0.00 - 0.05 m), taking into account the Season - Fallow system, was 4.8 for the samples of control treatment, 6.1 for samples that received lime and 6.4 in samples which received Ca-Mg silicate (Table 6). In the same layer, under the Season - Green-crop system, the pH value was also lower for the control (pH = 5.3) and higher for the silicates (pH = 6.1); already under the Season - Off-season system the control treatment also had the lowest pH (5.2), with the highest value being observed after the addition of lime (pH = 6.3) (Tables 5 and 4, respectively). Conse-quently, to what extent the application of lime and the calcium-magnesium silicates can neutralize the toxicity of Al is dependent on the pH of the soil solution as well as the presence of organic compounds and fluoride, and their respective concentrations and activities in solution. Among the species formed from Al in the soil solution, hydroxylated Al species are the most sensitive to man-agement practices because of their dependence on the pH of the soil (Zambrosi et al., 2008).
Calcium
Regardless of sampling depth, crop system ad-opted and correctives reapplied, the free form of Ca (Ca2+) was predominant in the soil solution, while the Ca-DOC species was in second place (Figure 3). This fac-tor reflects the strong influence of OM, its subsequent decomposition, and the release of soluble organic com-pounds (DOC) in the speciation and complexation of Ca in soil solution. This complexation is important in soils that have accumulated OM on the surface due to man-agement practices adopted, such as NT (Zambrosi et al., 2008).
The complexing of Ca by organic anions facilitates vertical mobility of this element deep in the soil, arising from the accumulation of organic residue and release of anions at the surface. These anions complex the cation (Ca2+) and favor its leaching and mobilization (Cassiolato et al., 2000). There was considerable complexation of Ca by DOC up to a depth of 60 cm (Figure 3), and the same was observed by Zambrosi et al. (2008) up to a depth of 80 cm. Thus, there is strong evidence that this form of leaching occurs in areas under NT.
Ionic pairs of calcium and inorganic anion (sul-phate, chloride and nitrate) in the soil solution also col-laborate in mobilizing this cation through the length of the soil profile (Pavan et al., 1984; Piirainem et al., 2002).
In this study, sulfate was the inorganic anion which most formed ionic pairs with calcium (CaSO4) in all five layers of the soil sampled for all correctives and crop systems adopted. However, in general, the quantity did not ex-ceed 5 %. There were also associations of Ca with fluo-ride (CaF+), phosphate (CaHPO
4(aq); CaH2PO4
+), chlorine (CaCl+), and nitrate (CaNO
3
+) (“other species”), repre-senting, however, when present, less than 1 % of the total of all species of Ca. Adams (1971) states that the ion pairs of Ca2+ with these anions (Cl− and NO
3
−) do not occur or are very irrelevant, while the sulfate may have a higher expression compared to other inorganic anions, though still significantly less than DOC.
The results of Ca complexing with inorganic an-ions corroborate Chaves et al. (1991), who claim that the NO3−, Cl− and the SO
4
2− are the main inorganic binders of Ca in solution, because they form part of the compo-sition of the majority of fertilizers used in agriculture. Ca binding with inorganic anions follows the ensuing stability sequence: SO42− > Cl− > NO
3
−, and the stabil-ity of each complex-dependent activstabil-ity of anions in solu-tion (Lindsay, 1979). The formasolu-tion of these pairs of ions, in addition to acting directly on the mobility of calcium (leaching), interferes with availability to plants. These ionic pairings result in the chemical potential or real ion availability being reduced (Zambrosi et al., 2008).
Chaves et al. (1991) observed that the absorption of Ca by coffee (Coffea arabica) tree roots (after the ap-plication of calcium salts) in two northern acidic Oxisols in the state of Paraná, Brazil, followed the order: Ca2+ > CaNO3+ > CaCl+ > CaSO
4
0. Zambrosi et al. (2008) did not observe significant increases in the percentage of acidic soils in CaSO40 even after gypsum application, and the CaSO40 was uniformly distributed along the pro-file (up to 80 cm) regardless of application of lime or gypsum. Liming and silicate application had no obvious effects on the distribution of the species of calcium, and there were no noticeable changes in comparisons made between depths. Unlike in Zambrosi et al. (2007), free form Ca (Ca2+) did not decrease at lower depths in the soil profile, but maintained their high activity level and a positive correlation with the total concentrations of Ca in the aqueous extract (Table 2 and Figure 4). On aver-age, the activity of calcium (aCa2+) corresponded to 65 % of Cat, in the five layers studied (Table 2 and Figure 4).
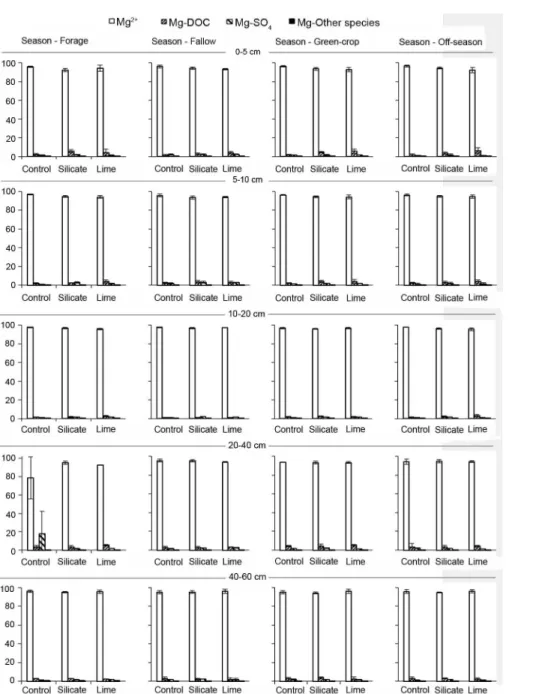
Magnesium
As with Ca, DOC was the main Mg binder in the soil solution (Mg-DOC), but to a lesser extent than the Ca-DOC. The free forms (Mg2+) were predominant and in even greater quantities than Ca2+ (Figure 5). In gen-eral, among the inorganic anions, the interaction with sulphate (MgSO40) occurred in quantities close to 3 %, or less than the CaSO40, where up to 5 % for these species was recorded. The only exceptions were found in the layer of 20-40 cm under the Season - Forage system and control treatment, where approximately 15 % of MgSO4 was observed, and the same applies to the Ca-SO4 (Fig-ures 5 and 3, respectively). Zambrosi et al. (2008)
ob-served that the ion pair MgSO4 represented at most 1 % of the total Mg species in solution of an Oxisol from the state of Paraná.
The inorganic anion most responsible for the mo-bility of Mg is sulfate (SO42−), which explains the intense leaching of Mg when gypsum is applied. The MgSO40 complex contributes significantly to the total concentra-tion of Mg2+ in solution when the concentration of SO
4 −2 is above 10−4 mol L−1 (Lindsay, 1979). The forms of Mg with other inorganic anions, such as fluoride (MgF+), phosphate (MgHPO4(aq)), nitrate (MgNO3+) and chloride (MgCl+) were detected in amounts close to 0 % of the
Figure 3 − Chemical species of calcium (%) in solution of an Oxisol under NT as a function of acidity amendments and crop systems. Vertical bars represent the mean deviation of replications for each treatment (n=4). Other species: CaCl+; CaNO
3
+; CaF+; CaHPO
total (“other species”) (Figure 5). The magnesium com-plexes of chloride and nitrate have stability constants which are very close (logK0 ~ 0.6), but are of minimal significance in solution (Lindsay, 1979).
The amount of free form magnesium (Mg2+) is much greater than when in association with organic an-ions and, in the main, inorganic anan-ions (Table 2 and Fig-ure 6). For the inorganic anions, the nitrate ion pair also failed to form an ionic pair in significant amounts with Mg, which can indicate little activity of this cation at depth. The organic anions were significant contributors to the mobility of Mg, as were the components of the soil solution which combined with a higher proportion of this cation across all layers, as observed by Zambrosi et al. (2008). The total concentrations of Mg in aqueous ex-tract (Mgt) were highly positively correlated with aMg2+ in all layers (Table 2 and Figure 6). On average, aMg2+ corresponded to 81 % of the total Mg concentration in the five layers studied, or even higher than the percent-age of aCa2+ compared to Cat. This fact can be explained by higher percentages of Mg2+and lower Mg-DOC com-pared to Ca2+ and Ca-DOC, respectively.
Potassium
The activity of free form K (aK+) was not affected by any of the treatments (Table 2 and Figure 7), even in the two deepest layers, where total K concentrations were reduced (Tables 3, 4, 5 and 6). The activity of K free
ions positively correlated with soluble concentrations (Table 2 and Figure 7), and high aK+ corresponded to total concentrations of the ion in solution (Kt). On aver-age, aK+ corresponded to 96 % of the total concentration of K in solution for all depths, this number being quite similar to that observed by Zambrosi et al. (2007), who observed a value of 95 % for such activity. Potassium, unlike Ca and Mg, was not complexed by organic anions in solution. The percentages of ion pairs to K (KCl(aq), KNO3 and KSO4−) represented less than 1 % of the total, regardless of crop system, treatment or depth sampled.
In well-drained soils, complexes with K have little relevance (Lindsay, 1979). In moist tropical soils with high clay content, iron oxides form strong aggregates in Oxisols which allow leaching and facilitate drainage. However, the interaction of potassium with anions in soil solution affects the leaching of the monovalent cat-ionic form (K+) since potassium facilitates the migration of anions along the soil profile.
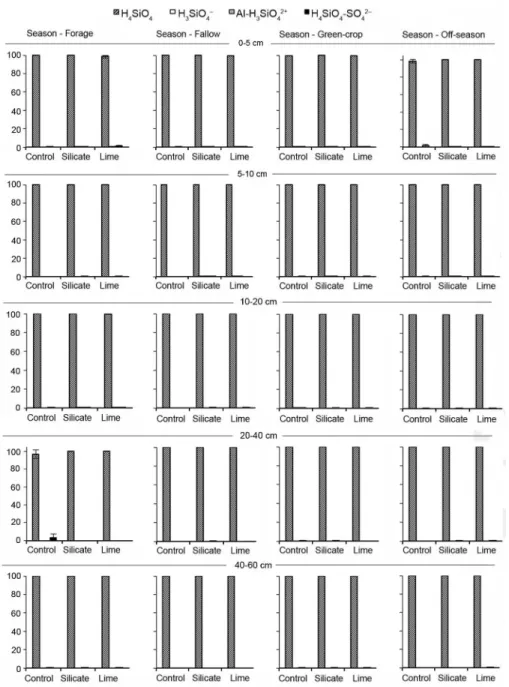
Silicon
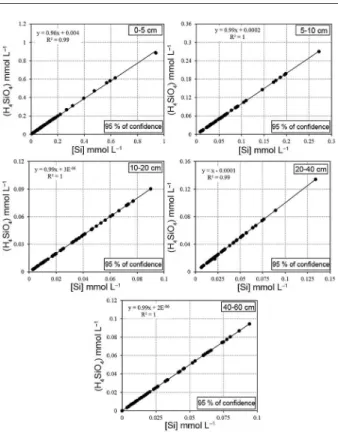
Monosilicic acid (H4SiO4) prevailed in all the soil layers for all crop systems, regardless of the corrective applied (Figure 8), which was expected in Oxisols judg-ing by the range of variation in pH observed in water extracts. The H4SiO4 species, in general, accounted for almost 100 % of Si species in soil solution, with a num-ber of exceptions (Figure 8). The activity of the most protonated free form of Si in the water sample taken from the ground (aH4SiO4) also remained unaffected by treatments (Table 2 and Figure 9), even in the deepest layers, where the concentrations of H4SiO4 were reduced (Tables 3, 4, 5 and 6).
The H4SiO4 activity positively correlates with the soluble concentration of the species (Table 2 and Figure 9). The high level of aH4SiO4 corresponded to the total concentrations of the species in solution (H4SiO4t), which further enhances the strong presence of monosilicic acid in soil solution. On average, aH4SiO4 corresponded to almost 100 % of H4SiO4t solution.
At pH values around 7, less than 1 % in the form of H4SiO4 ionizes to negative (silicate anion H3SiO4−), and the degree of ionization decreases as the pH de-creases (McKeague and Cline, 1963). For the condi-tions of this study, we noticed the substantially reduced presence by approximately, in general, less than 1 % of the aluminum species complexed with silicate anions (AlH3SiO42+), which could be responsible for a decrease in Al3+ phytoxicity in solution. Where the pH values ex-ceeds the neutral level, the presence of silicate in solu-tion increased as pH increased. However, other complex aluminum ion stability constants have even greater sta-bility than H3SiO4− and start to predominate in solution as is the case with Al complexes formed with hydroxyls (Figure 10).
On the other hand in a solution with the presence of only aluminum and silicon in equimolar fractions, it is known that the AlH3SiO42+ species is present in solution
in pH ranges varying from 3.5 to 6.5, such as is com-monly found in humid tropical soils, and its percentage in solution can reach approximately 10 % of the distribu-tion of species at pH values close to 5.5 (Figure 10). The activity of these species reached levels comparable to those in their solution concentrations. The presence of more ions in solution alters the distribution of all pos-sible species in solution depending on their concentra-tion and respective activities.
The aluminosilicate species (AlH3SiO42+) in solu-tion represented approximately 2 % under the Season - Forage system, in the 0.00-0.05 m layer where lime
Figure 5 − Chemical species of magnesium (%) in solution of an Oxisol under NT as a function of acidity amendments and crop systems. Vertical bars represent the mean deviation of replications for each treatment (n = 4); Other species: MgCl+; MgNO
3
+; MgF+; MgHPO 4(aq).
to form the ion pair AlH3SiO42+, whereas the solubility of free form Al3+ is nil after pH = 6 and the silicate an-ion begins to increase when the pH is around 7 (neutral range) (Figure 10).
The Si (Si4+) species complexed with the fluoride ion (F−) was also detected, but in concentrations close to zero, despite having a relatively high stability constant (SiF62−, log K
0 = 30.18). This is because the free Si 4+ spe-cies hardly appears in the tropical acid soil solution due to the low pH value. The solubility of Si4+ occurs in an alkaline environment, and even this free form is mini-mally complexed by fluoride (F−).
Sulfur
Ionic pairs of monosilicic acid with sulfate were formed in solution (H4SiO4–SO42−), as was observed for Ca and Mg under the Season - Forage system (Figures 3 and 5) in larger amounts, and Season - Fallow for Si in the 20-40 cm and 5-10 cm layers, respectively, in lesser quantities (Figure 8). The average concentration of S was 142.5 mmol L−1 (or 4,570 mg dm−3) for the Season - For-age system, in the control treatment at a depth of 20-40 cm (Table 3); this amount is approximately 4,500 times the concentration of silicon (Si = 0.04 mmol L−1 or 1.02 mg dm−3) for the same sample, that is, an S
total value cer-tainly much higher than that normally found in soils, which indicates probable contamination of the area for the sample in question. Neptune et al. (1975) classified
as average the Stotal content of between 209 and 398 mg kg−1 of a tropical soil after alkaline digestion with NaO-Br. Sulfur contents in the humid tropical soils would be even lower than those in a temperate climate due to sul-fate leaching along the length of the soil profile.
Sulfate (SO42−) was the predominant species, occupying approximately 95 % of the total in soils. Moreover, the average total percentage taken from all depths was 82 % for sulfate activity (aSO42−) with re-spect to the Stotal (St) obtained in water extracts and the coefficient of determination was 0.99. For the deepest two layers, the percentage ratio of aSO42−/St was 82 %, and the R2 = 1; and 85 % with R2 = 0.99 to 20-40 and 40-60 cm, respectively (for all the results, p < 0.05). Under conditions of synthetic solution, without inter-ference of the activity of other ions in solution, the presence of Si species complexed with SO42−, defined by the ion-pair H4SiO4–SO42−, log K
0 = -0.54 (Visual MINTEQ) is registered in percentages above 25 % for concentrations of S thousands of times higher than Si (Figure 12).
These factors were reflected in the formation of the H4SiO4–SO42− species, in relation to other species, and were different from the H4SiO4 species, even in the presence of other ions in solution (Figure 8). The appli-cation of gypsum (post-liming), as well as the adoption of NT, can increase SO42− content in the soil. Firstly, to promote mobility of SO42− down to the deepest layers
Figure 7 − Linear regressions for potassium concentration ([K]) and the activity of its free form ((K+)) in solution at five depths of an Oxisol under NT.
(where a good part of the roots is located) and, therefore, complex toxic elements and has other components in so-lution and secondly, to ensure S organic mineralization, responsible for more than 90 % of the total S in soils (Neptune et al., 1975).
Conclusions
For all crop systems, silicon was almost entirely in the form of H4SiO4 in the aqueous extract, and the activity of this species was equivalent to its concentra-tion in soluconcentra-tion, providing negligible percentage values
Figure 8 − Chemical species of silicon (%) in solution of an Oxisol under NT as a function of acidity amendments and crop systems; Vertical bars represent the mean deviation of replications for each treatment (n = 4).
of both species H3SiO4− and Al-H 3SiO4
2+, regardless of depth sampled and the amendment applied.
Unlike K, Ca and Mg formed complexes with the DOC no matter the sampling depth, and the free forms of these three cations are the most prevalent species in this experiment. Their total concentrations were also strongly correlated with the activity of free forms in so-lution.
Acknowledgments
To FAPESP (São Paulo Research Foundation) for financial support of this research (Registry num-bers: 2011/10566-6, 2013/18594-4, 2013/18694-9, 2013/02000-8 and 2014/08768-8) and CNPq (Brazilian National Council for Scientific and Technological De-velopment) for productivity grants in research to Luís Reynaldo Ferracciú Alleoni and Carlos Alexandre Costa Crusciol.
Figure 12 – Distribution of silicon species (H4SiO4) and sulphate (SO42−), ratio S/Si = 4,500 (0.9/0.0002 mol L−1), as a function of pH; Figure made by Visual MINTEQ software (Gustafsson, 2013). Figure 9 − Linear regressions for silicon concentration ([Si]) and the
activity of its silicic acid form ((H4SiO4)) in solution at five depths of an Oxisol under NT.
Figure 10 – Distribution of species and solubility of silicon and aluminum as a function of pH; Figure made by Visual MINTEQ software (Gustafsson, 2013).
Figure 11 – Activity of silicon and aluminum species as a function of pH; Figure made by Visual MINTEQ software (Gustafsson, 2013).
References
Adams, F. 1971. Ionic concentrations and activities in soil solutions. Soil Science Society of America Proceedings 35: 420-426. Adams, M.L.; McIntosh, P.D.; Patterson, R.D.; Powell, K.J. 1999.
Aluminium speciation in seasonally dry high country soils, South Island, New Zealand. Soil Research 37: 1005-1015.
Alleoni, L.R.F.; Cambri, M.A.; Caires, E.F.; Garbuio, F.J. 2010. Acidity and aluminum speciation as affected by surface liming in tropical no-till soils. Soil Science Society of America Journal 74: 1010-1017. Alva, A.K.; Sumner, M.E. 1988. Effects of phosphogypsum or
calcium sulfate on aluminum reactive aluminum in solutions at varying pH. Communications in Soil Science and Plant Analysis 19: 1715-1730.
Álvarez, E.; Monterroso, C.; Fernándes Marcos, M.L. 2002. Aluminium fractionation in Galicia (NW Spain) forest soils as related to vegetation and parent material. Forest Ecology and Management 166: 193-206.
Bessho, T.; Bell, L.C. 1992. Soil solid and solution phase changes and mung bean response during amelioration of aluminium toxicity with organic matter. Plant and Soil 140: 193-192.

![Figure 6 − Linear regressions for magnesium concentration ([Mg]) and the activity of its free form ((Mg 2+ )) in solution at five depths of an Oxisol under NT.](https://thumb-eu.123doks.com/thumbv2/123dok_br/15861459.662898/14.918.450.788.109.530/figure-linear-regressions-magnesium-concentration-activity-solution-oxisol.webp)