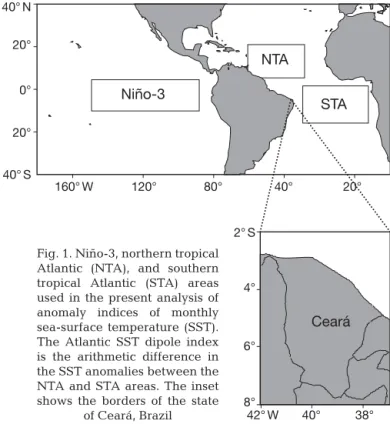
Relationship between ocean climatic variability and rainfed agriculture in Northeast Brazil
Texto
Imagem


Documentos relacionados
Se ha observado que el 12% del total de los inscriptos a la Maestría, han aprobado su Tesis de Posgrado, mientras que, en la Especialización, más del 80% realizaron
21 Figura 5: Curva de dissociação do fragmento do gene 16S rRNA do controle positivo e das amostras positivas de cães domésticos oriundos de áreas urbana e rural do
FIGURE 1 Relationship between the body mass index and each motor coordination test item in girls and boys in each age group.. are summarized in
The relative mean difference was calculated as follows (Eq. For each location, the average and standard deviation of δ ij , were calculated and graphically presented. With
The correlation between the average rate of seizures calculated per million of inhabitants and the Human Development Index calculated by the Municipality of São Paulo for
The averages of the differences between the values of SII55 and SII65 showed that, for the Gr1 and Gr2 groups (lower averages), the decrease in the input signal may not
O experimento foi realizado com uma amostra de 43 alunos dos cursos de licenciatura em Engenharia Informática da Universidade Fernando Pessoa, como já referido,
Table 1 - Average rates of hydatidosis, cysticercosis, and tuberculosis infection in cattle slaughtered between the years 2009 and 2017 in the state of Rio Grande do Sul, Brazil
