1. INTRODUCTION
Many studies worldwide have shown the importance of climatic variability in agricultural production and fi-nancial income from crops (Handler 1990, Semenov & Porter 1995, Carlson et al. 1996, Hansen et al. 1998, Sivakumar 2006). The techniques recently used in sea-sonal climate forecasting confront challenges in pre-dicting the variations in crop production early enough to adjust critical decisions (Doblas-Reyes et al. 2006, Hansen & Sivakumar 2006, Rubas et al. 2006) that may, in turn, have a positive impact on rural society (Smit et al. 1996, Adams et al. 1999, Hansen et al. 2006). For
emergent and developing countries, where the practice of soil conservation is often not widespread (Cane et al. 1994), and where the decision-making process is often deficient (Vogel & O’Brien 2006), this issue is not trivial. The socio-economic impact of forecasting is even more intense in areas where a high incidence of abnormal climatic conditions mean that harvests vary consider-ably from year to year (Garnett & Khandekar 1992) and where the poorly educated rural population has mul-tiple difficulties adapting to modern agricultural tech-nologies (Brou et al. 2005). The state of Ceará, in the northern part of northeast Brazil (hereafter called Nordeste) (Fig. 1), provides one such example, with
© Inter-Research 2009 · www.int-res.com *Email: brabo@funceme.br
Relationship between ocean climatic variability and
rain-fed agriculture in northeast Brazil
José Maria Brabo Alves
1,*, Jacques Servain
2, 3, José Nilson B. Campos
11Fundação Cearense de Meteorologia e Recursos Hídricos (FUNCEME)/Departamento de Engenharia Hidráulica e Ambiental, Centro de Tecnologia, Universidade Federal do Ceará (UFC), Av. Rui Barbosa 1246, Aldeota, 60115-221 Fortaleza, Ceará, Brazil
2Institut de Recherche pour le Développement (IRD), UMR-182, LOCEAN, Université Paris-6, 4 Place Jussieu, Tours 45-55, Case 100, 75252 Paris Cédex 05, France
3Present address: Fundação Cearense de Meteorologia e Recursos Hídricos (FUNCEME), Av. Rui Barbosa, 1246, Aldeota, 60115-221 Fortaleza, Ceará, Brazil
ABSTRACT: The statistical relationship between sea-surface temperature variability over tropical oceans and the 1952 to 2000 crops of maize and beans in the state of Ceará, Brazil, was investigated. This region mainly receives precipitation from February to May. The climatic indices used were the Niño-3 for the Pacific and the dipole index for the Atlantic. In a first series of diagnostic analyses, the climatic precursor variables were examined from November to January (Years 0 to 1) for the Niño-3 in-dex and from February to April (Year 1) for the Atlantic dipole components. The agronomic variables were the planted area, annual production, yield (which showed a negative linear trend during the study period), price, and aggregate value (price/yield) for Year 1. A more robust statistical weight was obtained with the Atlantic dipole. The Pacific weight added to, or decreased, the Atlantic effect, de-pending on the sign of the index. Ocean climatic conditions that generate drought episodes in the Nordeste region of Brazil are generally associated with bad harvests. However, the reverse (i.e. wet weather episodes) does not necessarily produce good harvests. In a second series of prognostic analy-ses, a statistical model used the ocean climatic information available before the rainy season to forecast the yields of maize and beans. The model gave some relevant data in terms of yield tendencies, and was more sensitive when the climatic conditions were neutral or dry. Remarkably good yield forecasts were noted at the end of the study period. Harvests depend on complex combinations of multiple climatic criteria related, not only to quantitative, but also qualitative factors connected with the rainy season.
KEY WORDS: Climate variability · Northeast Brazil (‘Nordeste’) · Climatic impact · Rain-fed agriculture
the vulnerability of subsistence agriculture affecting >1 million people (Magalhães & Glantz 1992, Lemos et al. 2002).
Ninety-three percent of the state of Ceará (146 300 km2) is influenced by a semi-arid climate, with great seasonal and inter-annual variability in the rain-fall regime. The rainy season is roughly limited to 4 mo, with > 60% of the total rainfall (about 650 mm yr–1on average) occurring in February to May. This is directly linked to the southward migration of the inter-tropical convergence zone (ITCZ), which is itself controlled to a large extent by the delayed feedback of sea-surface temperature (SST) variability over the tropical oceans (e.g. Hastenrath & Greischar 1993). Any abnormal climatic event in these tropical oceans leads to an abnormal latitudinal displacement and/or intensity of the ITCZ. When such an anomalous climatic event occurs in the months around the end or beginning of a year, it may lead to disruption in the seasonal rainfall of the Nordeste a few weeks later, with a consequent impact on rain-fed crops.
The main objective of the current study was to pre-sent an analysis of the impact of the Pacific and Atlantic tropical SST variability on the quality and quantity of rain-fed agriculture in the state of Ceará, Brazil. The period studied was 1952 to 2000, which includes a good sample of drought years, flood years, and years considered normal in the Nordeste. The eco-nomic responses are measured here in terms of various agricultural variables for the 2 major rain-fed crops in
Ceará, bean Phaseolus vulgarisL. and maize Zea mays (traditional species that have been grown for at least a century). These crops are mainly consumed (including use as animal feed) at a regional level in the Nordeste, which strongly attenuates any unspecified effects of external markets.
In Section 2 we give a brief overview of the precari-ous rain-fed agriculture in the Nordeste. In Section 3 we present the data sets, and an initial analytical dis-cussion of them. The main results section (Section 4) is divided into 2 parts. The first part investigates the delayed impact of tropical SST variability on the annual crops in Ceará using the technique of compos-ite yearly events (Nobre & Shukla 1996), combining different climatic situations over the Pacific and the Atlantic. In the second part, a series of prognostic methods are tested using simple and multiple linear regressions to forecast the indirect (via rainfall distrib-ution) climatic influence of the tropical oceans on rain-fed agronomic productivity. Our conclusions and a dis-cussion of the results are then given (Section 5), with suggestions on how to improve the seasonal forecasts for the Nordeste.
2. THE PRECARIOUS RAIN-FED AGRICULTURAL SECTOR
The Nordeste has a developing economy that in-cludes a modern agricultural processing sector in the narrow strip of land along the humid coast (mainly sugar and cocoa production) and extensive traditional subsistence agricultural activity (mainly beans and maize) in the large, semi-arid portion in the interior (‘sertãos’). In this latter region, climate is the most important factor determining the efficiency of the rain-fed agricultural sector (Magalhães & Glantz 1992). Because the yearly rainfall in the region is generally concentrated within 3 to 4 mo, the inverno (winter), farmers usually plant at the beginning of that period (January or February) and harvest the crops at its end (April to June) to take advantage of the period when soil humidity is adequate. Maize is generally planted a few weeks before beans. It takes about 90 to 120 d for maize and 60 to 90 d for beans to reach maturity. Therefore, the harvests occur more or less simultane-ously at the end of the rainy season.
Campos & Studart (2008) jointly analyzed agricul-tural practices and the occurrence of drought. The drought index is defined by the soil moisture that is in-sufficient to maintain the vegetation root system, lead-ing to considerably reduced agricultural production. The effects are well known: economic losses and seri-ous social disturbances, such as hunger, rural exodus, and separation of family members.
2° S
42° W 160° W 120°
Niño-3
NTA
STA
Ceará
80° 40° 20°
40° 38° 4°
6°
8° 40° S
40° N
20° 0° 20°
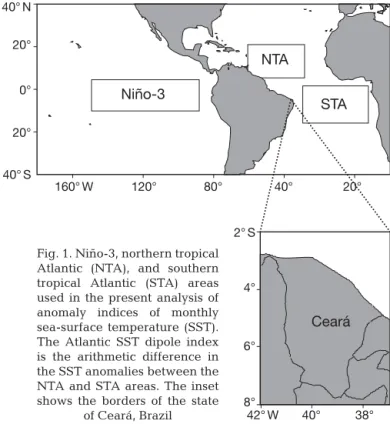
Fig. 1. Niño-3, northern tropical Atlantic (NTA), and southern tropical Atlantic (STA) areas used in the present analysis of anomaly indices of monthly sea-surface temperature (SST). The Atlantic SST dipole index is the arithmetic difference in the SST anomalies between the NTA and STA areas. The inset shows the borders of the state
Another negative effect (or, at the very least, a neu-tral effect) is that the subsistence agriculture practiced in the sertãos is still rudimentary. Partly because of the often extreme poverty of the rural population, the agri-cultural practices (poor mechanization, little techno-logical improvement, sporadic use of fertilizers and irrigation, etc.) have remained the same for many de-cades. According to Brant (2007), ~50% of the farmers in Ceará are landless, and many more own parcels too small to form a viable production unit. Additionally, most people have little political voice, and, historically, political focus has been on emergency measures to alleviate the effects of drought rather than on creating environments that promote increased livelihood options (Nelson 2005).
Furthermore, most of the rivers in the Nordeste are small and non-perennial, with practically no phreatic layer (i.e. the substrate is impervious granite). This contributes to the strongly restricted water supply out-side the short rainy season.
Thus, although a positive trend in yields is generally expected in agricultural sectors worldwide, as a result of advances in agriculture science and practices, the present study shows that this is not the case in the sertãos. Indeed, the most significant change in the farmers’ behaviour in recent years has been derived from the increasing information available via the media in climate forecasts delivered by various public organi-zations, such as the Fundação Cearense de Meteorolo-gia e Recursos Hídricos (FUNCEME). Since the 1980s, and especially since the beginning of the 1990s, the increasing availability of climate information has influ-enced the decisions of small farmers regarding whether or not to plant. In this way, adequate climatic forecasts are of crucial importance for the whole agricultural economy of the Nordeste, especially that of the sertãos.
3. DATA SETS AND FIRST DIAGNOSTIC ANALYSES
3.1. Agronomic variables
Agronomic data were collected by the Instituto Brasileiro de Geografia e Estatistica and compiled by the Instituto de Planjeamento do Ceará. The variables used here were planted area, annual production, yield (or productivity, defined as the production divided by the entire agricultural area), price (corrected according to long-term monetary fluctuations), and aggregate value (price/yield).
The planted area during the study period from 1952 to 2000 (Fig. 2a) strongly paralleled the growth rate of the rural population. It ranged from about 150 000 ha in the middle of the 20th century for both maize and
beans, to about 600 000 ha at the end of the century. However, 2 distinct periods are apparent. Whereas the increase in the planted area was virtually constant from the beginning of the 1950s until the end of the 1970s, that variable experienced large inter-annual changes during the last 2 decades of the 20th century. The present study shows that many of those changes can be directly related to climatic variability.
The production, yield, and aggregate values for maize and beans are given in Fig. 2b, c, and d, respec-tively. The general long-term patterns of these vari-ables distinctly differ from the variability in planted areas (Fig. 2a). A slow increase (not significant at 95%) is observed for production across the full 1952 to 2000 time series. The yearly crop of maize varies from very small values (e.g. 1958, 1981, 1983) to > 600 000 tons (in 2000), but with strong inter-annual and multi-decadal changes. The yearly crop of beans is smaller, with val-ues ranging between very low (usually in the years when the maize crop is also low) and 300 000 tons (in 1994), and the inter-annual and multi-decadal changes are weaker than those of maize. As shown in Section 3.2, consecutive drought years occurred at the begin-ning of the 1980s, and the immediate effect was an obvious, dramatic fall in both maize and bean produc-tion during this period (Fig. 2b). This was also associ-ated with the previously mentioned abrupt change in the area planted (Fig. 2a).
In contrast to the planted area and production time series, a negativetrend1(significant at 95%) is
appar-ent in the yield time series for both maize and beans (Fig. 2c). Yields were smaller for beans (about 50 to 600 kg ha–1) than for maize (about 50 to 1050 kg ha–1), again with higher inter-annual variability for maize. It is interesting to note that, except for isolated years such as 1958 and 1970, the yields for both species were best during the first half of the recorded data. After the half-decade episode around the drought years of the 1980s, during which the yield values were particularly low (very low production with strong changes in the areas planted), the yields increased again, but without reaching their former values.
The yearly aggregate values (Fig. 2d) vary consider-ably compared with the production and yield variables discussed above. A relatively regular increase in aggregate values (from US$ 20 to 80 million yield–1) was observed for both species during the first part of the record, with about the same values. The peak of profit occurred in the mid-1970s (e.g. about US$ 160 million and US$ 100 million yield–1in 1975 for beans and maize, respectively). The following decade (1975 to 1985) was marked by a reduction in aggregate
ues, especially for maize. The last 10 yr of the record show a new increase for beans, with relative stability, at close to US$ 80 million yield–1. During this time, the aggregate value for maize contin-ued to show significant inter-annual variability. The worst years for aggre-gate values (e.g. 1958, 1970, 1981, 1983, 1993, and 1998) were also the years with the lowest production values, the worst yields, and often a dramatic reduction in the planted area.
3.2. Climatic variables
The intra-seasonal and inter-annual variability in the ITCZ, and conse-quently the Nordeste’s climate, are largely teleconnected with worldwide climate phenomena, such as the El Niño-Southern Oscillation (ENSO) in the equatorial Indo-Pacific Ocean (Phi-lander 1990, Trenberth 1997) and the SST anomaly dipole in the tropical Atlantic (Moura & Shukla 1981, Servain 1991, Nobre & Shukla 1996). The El Niño/La Niña phenomena (Philander 1990) have multiple climatic and socio-economic consequences all over the world. Among these, El Niño is often associated with dry episodes over the Nordeste, whereas La Niña can lead to flooding in this semi-arid region (Uvo et al. 1998). The meridian mode of climate variability in the tropical Atlantic, usu-ally called the ‘dipole’ (Servain 1991), is represented by a latitudinal gradient in the SST anomaly pattern between the north and south of the tropical basin (Ayina & Servain 2003). The phases of the standard Atlantic dipole control the zonal band of cloudiness and precipita-tion associated with the ITCZ (Hasten-rath & Greischar 1993). During a posi-tive phase (i.e. posiposi-tive SST anomalies in the northern tropical basin and neg-ative SST anomalies in the south), the thermal gradient points towards the northern hemisphere. Consequently, the ITCZ is predominantly located to the north of its climatological position, and rains are often below normal in the Nordeste (Hastenrath & Heller 1977, Hastenrath 1990). Conversely, during a
a
0 100 200 300 400 500 600 700 800 900
1952 1954 1956 1958 1960 1962 1964 1966 1968 1970 1972 1974 1976 1978 1980 1982 1984 1986 1988 1990 1992 1994 1996 1998 2000
Ar
ea (10
3 ha)
Maize Bean
b
0 100 200 300 400 500 600 700
1952 1954 1956 1958 1960 1962 1964 1966 1968 1970 1972 1974 1976 1978 1980 1982 1984 1986 1988 1990 1992 1994 1996 1998 2000
Pr
oduction (10
3 t)
c
0 200 400 600 800 1000 1200
1952 1954 1956 1958 1960 1962 1964 1966 1968 1970 1972 1974 1976 1978 1980 1982 1984 1986 1988 1990 1992 1994 1996 1998 2000
Year
Y
ield (kg ha
–1)
d
0 20 40 60 80 100 120 140 160 180
1952 1954 1956 1958 1960 1962 1964 1966 1968 1970 1972 1974 1976 1978 1980 1982 1984 1986 1988 1990 1992 1994 1996 1998 2000
V
alue (10
6 US$ Y
ield
–1)
Maize Bean
Maize Bean
Maize Bean
Fig. 2. From 1952 to 2000: (a) planted area, (b) annual production, (c) yield, and (d) aggregate values by year for maize and bean crops in Ceará. Solid and
negative phase of the dipole, the whole system is moved abnormally southwards, generally bringing more rain to the Nordeste (Wagner 1996). We must also note that El Niño (La Niña) years are sometimes asso-ciated with positive (negative) occurrences of the SST dipole (Enfield & Mayer 1997), thus increasing the influence of the tropical Atlantic.
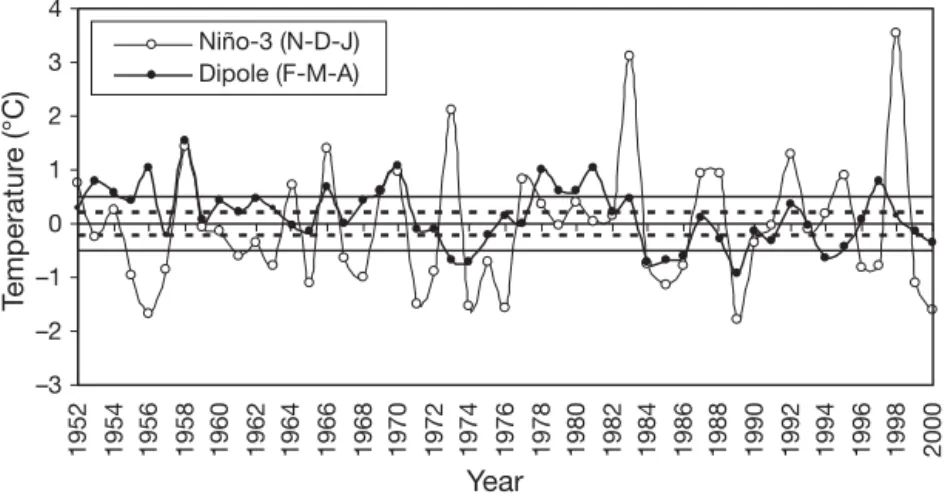
There is no universal single definition of ENSO (SCOR 1983, Trenberth 1997, Chen et al. 2002). Most of the time, this major ocean–atmosphere-coupled event is defined by either the surface pressure differ-ence between Tahiti and Darwin (e.g. Ropelewski & Jones 1987) or the SST anomaly in specified regions of the eastern tropical Pacific (Chen et al. 2002). Among these test regions, the Niño-3 area (5° N to 5° S, 150 to 90° W) (Fig. 1) and the Niño-3.4 area (5° N to 5° S, 170 to 120° W), both strongly correlated, are those cur-rently most used. Based on similar previous analyses, for instance that by Uvo et al. (1998), we chose the Niño-3 area as that most closely related to the climate of the Nordeste. In the present sudy, we used an adap-tation of the definition proposed by Trenberth (1997): positive PacPos (negative PacNeg) Pacific episodes are flagged when the SST anomaly, averaged in the Niño-3 area for the period from November to January is greater (lower) than + 0.5°C (–0.5°C) and neutral Pacific episodes (PacNeu) are flagged when the Niño-3 SST anomaly remains at the |0.5|°C threshold (Fig. Niño-3). The months November to January were chosen here because this period, which overlaps Christmas, statisti-cally represents the El Niño signal most adequately, and because it includes the possible 3 to 4 mo delayed climatic connection between the eastern tropical Pacific, the Atlantic tropics (Enfield & Mayer 1997, Sar-avanan & Chang 2000), and the seasonal rainfall over the Nordeste (Uvo et al. 1998).
In the tropical Atlantic, where the variability is weaker than in the Pacific, a significant positive DipPos (negative DipNeg) dipole value is flagged when the dif-ference in the SST anomalies from the northern tropical Atlantic (NTA) and the southern tropical Atlantic (STA) regions (Fig. 1), averaged from February to April, is greater (lower) than + 0.2°C (–0.2°C); neutral Atlantic dipole episodes (DipNeu) are noted when the differ-ence between the anomalies remains within the |0.2|°C threshold (Fig. 3). The months February to April were chosen here because this period sees an almost imme-diate impact of the tropical Atlantic on the Nordeste cli-mate (Servain 1991, Nobre & Shukla 1996), and it also corresponds to the first phase of plant growth in this semi-arid region. With these definitions, all the years during the study period were classified according to the 9 possible combinations of Pacific and Atlantic climatic episodes, as either positive, negative, or neutral. Table 1 shows the years in each climatic category. The num-ber of years varies from 2 (category DipNeg/PacNeu) to 9 (category DipNeu/PacNeg). Consequently, the statis-tical analysis was performed with caution, using rigor-ous significance tests. For each group of years in Table 1, we calculated the averages, standard deviations, and anomalies (differences between averages for composite years and the long-term average calculated over the entire 1952 to 2000 time series) of the 4 agricultural variables previously defined (production, yield, aggre-gate value, and price for the maize and bean crops). The 95% confidence interval for statistical significance was calculated with the following formulae:
(1)
(2)
where tc is defined according to Stu-dent’s t-distribution, in agreement with n, the number of years in each compos-ite group; µ and σindicate the mean and standard deviation (SD) of the sample, respectively. The statistical significance of the anomalies at 95% was calculated according to Harrison & Larkin (1998). Significant anomalies were those for which the absolute value exceeded:
(3)
where t95is the Student’s t-value for n degrees of freedom.
These Pacific and Atlantic climatic indices are from the observed monthly SST data from the Comprehensive Atmospheric–Ocean Data Set (COADS) (da Silva et al. 1994).
t95n n
1 2 ( )⋅ / ( σ) ( ) σ±t
(
σ)
n
c 2 µ±t
( )
σn
c
–3 –2 –1 0 1 2 3 4
1952 1954 1956 1958 1960 1962 1964 1966 1968 1970 1972 1974 1976 1978 1980 1982 1984 1986 1988 1990 1992 1994 1996 1998 2000
Year
Temperatur
e (°C)
Niño-3 (N-D-J) Dipole (F-M-A)
Fig. 3. November to January (February to April) averages for Niño-3 (Atlantic SST dipole) indices. The |0.5|°C and |0.2|°C limits, which are used for the com-posite years (see Table 1), are indicated by continuous lines and broken lines,
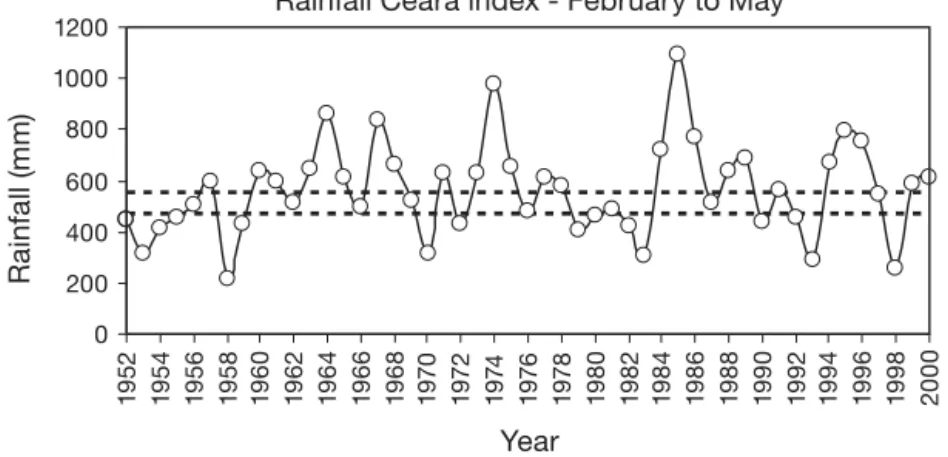
Not directly used in the present study, but shown here to illustrate the obvious relationship between sub-sistence harvests and precipitation over the Nordeste, a time series of the Ceará rainfall index, averaged dur-ing the mean rainy season (February to May) in the same study period (1952 to 2000), is presented in Fig. 4. This index was constructed using the daily rainfall observations obtained at the weather station network for the state of Ceará (60 to 150 weather stations, according to time period) under the auspices of FUNCEME. In Fig. 2, we can see that most of the worst years for production, yield, and aggregate values for the 2 rain-fed species (i.e. 1958, 1970, 1983, 1993, 1998) occurred during the driest years, and were also very often associated with El Niño years (for instance, the 2 big El Niño years in 1983 and 1998) and positive Atlantic dipole occurrences (see Fig. 3). Such a rela-tionship is less clear during flood years (e.g. 1974 and 1985), which are sometimes associated with La Niña years or with negative values of the Atlantic dipole index (see Fig. 4).
In a simple correlation analysis be-tween the precipitation time series shown in Fig. 4 and the agronomic vari-ables (production and yield) shown in Fig. 2, the correlation coefficients were as follows: + 0.52 and + 0.38 for produc-tion and yield of maize, respectively, and + 0.46 and + 0.22 for production and yield of beans, respectively. Values > 0.30 are significant at the 95% level. Therefore, it seems that the climatic response of maize was slightly higher than that of beans.
4. MAIN RESULTS
4.1. Diagnostic analysis of climatic impact Our first objective was to investigate how agronomic variables are directly related to climatic variables. To do that, we mainly used the diagnostic analysis below. For each composite in Table 1, Fig. 5 shows the mean, standard deviation (SD), and the upper (U.L.) and lower (L.L.) 95% confidence limits for yearly produc-tion, yield, and price for the bean and maize crops. Means and SD are also given for the full series, inde-pendently of the climate categories. The 2 production variables show similar behaviour (Fig. 5a,b), and the SD values, which remain relatively stable, are strongly dependent on the yearly composites. Thus, the great-est mean values for both crops (up to 250 000 and 430 000 t for beans and maize, respectively) clearly occur when a significant negative Atlantic dipole (cold NTA, warm STA) is associated with neutral conditions over the eastern equatorial Pacific. However, this yearly composite is marked by the highest ranges between the upper and lower 95% confidence limits. The inter-mediate values for production (about 140 000 and 300 000 tons for beans and maize, respectively) are associated with a negative Pacific SST, generally inde-pendently of the Atlantic surface condi-tions. The worst harvest quantities (< 80 000 and 100 000 tons for beans and maize, respectively), also marked by a minimum 95% confidence interval, commonly appear when a neutral or positive Atlantic dipole is associated with neutral or positive Pacific events.
Contrary to the production variables, the yield variables for beans (Fig. 5c) and maize (Fig. 5d) do not show this sort of dispersion according to the Climatic variables Years
DipNeg/PacNeg 1957, 1974, 1984, 1985, 1986, 1989, 2000 DipNeg/PacNeu 1991, 1994
DipNeg/PacPos 1973, 1988, 1995
DipNeu/PacNeg 1961, 1965, 1967, 1971, 1972, 1975, 1976, 1996, 1999 DipNeu/PacNeu 1959, 1982, 1990, 1993
DipNeu/PacPos 1964, 1977, 1987, 1998 DipPos/PacNeg 1955, 1956, 1963, 1968, 1997
DipPos/PacNeu 1953, 1954, 1960, 1962, 1978, 1979, 1980, 1981 DipPos/PacPos 1952, 1958, 1966, 1969, 1970, 1983, 1992
Table 1. Composite years classified according to definitions of the observed cli-matic events in the Pacific and Atlantic tropical oceans. Dip: Atlantic dipole;
Pac: Pacific; Neg: negative; Neu: neutral; Pos: positive
Rainfall Ceará index - February to May
0 200 400 600 800 1000 1200
19
5
2
1
954 195
6
19
5
8
19
6
0
19
6
2
19
6
4
19
6
6
19
6
8
19
7
0
19
7
2
19
74
19
7
6
19
7
8
19
8
0
19
8
2
19
8
4
19
8
6
1
988 199
0
19
9
2
19
9
4
19
9
6
19
9
8
2
000
Year
Rain
fa
ll (
m
m
)
Fig. 4. Ceará rainfall index (mm) from 1952 to 2000, averaged during the main rainy season (February to May). The 2 horizontal broken lines separate the cat-egories (according to the percentile method) between flooding years (above the higher line), normal years (between the lines), and drought years
yearly composites (means, SD, and 95% confidence intervals remain relatively stable), although the high-est mean values are clearly noted when a cold Pacific episode is associated with a positive or neutral Atlantic dipole (about 480 and 800 kg ha–1for beans and maize,
respectively). However, the behaviour of the worst yields according to the yearly composites differs some-what for beans and maize. Thus, the worst yield is noted for beans (255 kg ha–1) when neutral conditions over the Atlantic are associated with a positive Pacific event. For maize, the 2 lowest yields, of similar magni-tudes (about 400 kg ha–1), were observed when the Atlantic and Pacific were neutral, and a positive Atlantic dipole occurred during a positive Pacific epi-sode. To summarize, cold SST over the tropics gener-ates rather good yields, whereas warm SST produces rather bad yields.
Similar to the yield variables, the price variables (Fig. 5e,f) do not show strong variability according to the yearly composites, and here too the ranges be-tween the upper and lower 95% confidence limits are relatively large (and stable) for both crops. The overall averages of the means were US$ 0.63 kg–1(± 0.33 SD) for beans and US$ 0.22 kg–1(± 0.06 SD) for maize. The prices for beans and maize were lowest for the com-bination DipNeg/PacNeu, i.e. when production was at its highest (Fig. 5a,b). Other low values for price occurred for the combination DipPos/PacNeg, which corresponds to modest production but the highest yield. Conversely, high prices for beans and maize generally appeared with Atlantic–Pacific combina-tions associated with low values for production (e.g. DipPos/PacNeu). These characteristics, which balance price against production, must be related to the laws of the local market, as mentioned by Chimelli et al. (2002).
Fig. 6 shows, for the 9 types of yearly composites given in Table 1, the anomalies described earlier in production, yield, and price for the bean and maize crops. Obviously, there is great consistency with the results presented in Fig. 5 (although the use of the sta-tistical tests described previously implies that some of the preceding conclusions must be viewed with cau-tion). Thus, for the production anomalies (Fig. 6a,b), the very largest harvests definitively occurred for the composite years when a negative Atlantic dipole was associated with a neutral situation over the eastern equatorial Pacific (about +125 000 t for beans, + 250 000 t for maize). Such a distinct yearly composite does not exist for the worst harvests, which usually occur-red when the Pacific and Atlantic dipoles were neutral or positive, and were around –50 000 t for beans and –100 000 t for maize. Although not very pronounced, a modest positive production anomaly for both crops during positive dipole conditions was associated with a cold event over the Pacific (i.e. the simultaneous occurrence of different climate phenomena inducing 2 opposing rainfall effects over the Nordeste). The illus-tration of yield anomalies (Fig. 6c,d) qualitatively con-firms the previous results obtained from the raw values
a
Bean0 100 200 300 400 500
Pr
oduction (10
3 t)
Mean SD U.L. (95%) L.L. (95%)
b
Maize0 100 200 300 400 500 600 700 800
c
Bean0 100 200 300 400 500 600 700
d
Maize0 200 400 600 800 1000 1200
Y
ield (kg ha
–1)
e
Bean0 0.2 0.4 0.6 0.8 1.0 1.2 1.4
Price (US$ kg
–1)
f
Maize0 0.1 0.2 0.3 0.4
DipNeg/Pa cNeg
DipNe g/Pa
cNeu
DipNeg/PacPosDipNeu/Pac Neg
DipNe u/PacNeu
DipNe u/Pac
Pos
DipPos/PacN eg
DipPo s/PacNeu
DipP os/PacPo
s
Climat e
Categories of climatic events
Fig. 5. Mean, SD, and 95% upper and lower confidence lim-its (U.L., L.L., respectively) of different measures for the composite years given in Table 1 for bean and maize crops: (a,b) production, (c,d) yield, and (e,f) price. ‘Climate’: overall
(Fig. 5c,d). It is interesting to note, however, and con-trary to the production anomalies, that there was a very similar balance between the positive and nega-tive extreme values for these yield anomalies (~80 kg ha–1 for beans, ~190 kg ha–1 for maize), according to the different yearly composites. As seen previously (Fig. 5e,f), the price anomalies generally vary in a way that is clearly opposite to the variability in the produc-tion anomalies.
Fig. 7, which shows the aggregate value anomalies (in US$ millions yield–1), better illustrates the balance between the Pacific and Atlantic in their mutual cli-matic impact on the agrarian quantities. Independently of the Pacific index, the 3 climatic combinations on the right (on the left), which include a significant negative (positive) dipole in the Atlantic, are associated with positive (negative) aggregate value anomalies. During neutral climatic conditions over the Atlantic, cold Pacific events are associated with positive excess ag-gregate values, whereas for similar neutral Atlantic conditions, neutral and warm Pacific episodes imply a deficit for the farmers. It is also noteworthy that, even if the qualitative responses of maize and beans are com-pletely similar for the 9 index combinations, there are some significant differences in the absolute values. For beans, the best profit (US$ 30.6 million yield–1) was achieved with the combination DipNeg/PacNeu (see Fig. 6: the largest production, about normal yield, modestly good price), whereas the largest deficit (US$ –22.6 million yield–1) occurred during the combi-nation DipPos/PacPos (low production and yield, mod-estly good price). For maize, the best profit (US$ 22.8 million yield–1) was associated with the combination DipNeg/PacPos (the second largest production, mod-est yield, bad price), whereas the greatmod-est losses occurred with the combination DipPos/PacPos (low production and yield, good price), and especially (US$ –16.4 million yield–1) during neutral SST condi-tions over the 2 oceans (DipNeu/PacNeu) (modest pro-duction, very bad yield, modestly positive price).
The most theoretically favourable situation for a good rainy season over the Nordeste (i.e. the combination DipNeg/PacNeg) does not imply an exceptionally good harvest. The production anomalies are just above nor-mal for beans (Fig. 6a) and modestly positive for maize (Fig. 6b). The behaviour is different for the yields: they are modestly negative for beans (Fig. 6c) and just below
–150 –100–50 0 50 100 150 200 250 300 –100 –50 0 50 100 150
–150 –100 –50 0 50 100
–200 –150 –100–50 0 50 100 150 200 250
–0.3 –0.2 –0.1 0 0.1 0.2 0.3
–0.08 –0.06 –0.04 –0.020 0.02 0.04 0.06 0.08
DipNe g/Pa
cNeg
DipNeg/PacNeuDipNe g/Pa
cPos
DipNeu/PacNegDipNeu/PacNeuDipNeu /PacPo
s
DipPos /PacNeg
DipPos/PacNeuDip Pos/PacPo
s
Pr
oduction (10
3 t)
Y
ield (kg ha
–1)
Price (US$ kg
–1)
Categories of climatic events
a
Beanb
Maizec
Beand
Maizee
Beanf
MaizeFig. 6. Bean and maize crop anomalies in: (a,b) production, (c,d) yield, and (e,f) price for the composite years given in Table 1. Shaded (blank) bars have a statistical significance
above (below) 95%
–30 –20 –10 0 10 20 30 40
DipNeg/PacNegDipNeg/PacNeuDipNeg/PacPosDipNeu/PacNegDipNeu/PacNeuDipNeu/PacPosDipPos/PacNegDipPos/P acN
eu
DipPos/PacPos Categories of climatic events
V
alue (10
6 US$ Y
ield
–1)
Maize Bean
Fig. 7. Aggregate value anomalies for maize and bean crops according to the composite years given in Table 1. Black (bean) and grey (maize) bars are significant at 95% according to Student’s t-test. The white bar (DipNeg/PacNeu with
normal for maize (Fig. 6e). The prices are just below normal (Fig. 6e,f), and the aggregate value anomalies are slightly positive for both species (Fig. 7).
4.2. Prognostic model for productivity Our second objective was to test the prediction of rain-fed agricultural variables using only climatic indices as the statistical precursors. Such calculations seem inadequate for the variables production, price, and aggregate value, which are not only dependent on climate variability, but also on various anthropogenic factors (e.g. planted area, local economy, etc.). For yield variability, we have already noted that one possi-ble anthropogenic factor that increases the crops (i.e. technological improvement) has been virtually absent in the sertãos in recent decades. On the other hand, however, the negative trends observed in the yield time series (see Fig. 2a) could have arisen from the fail-ure to apply land conservation techniques and the impoverishment of the soil. Therefore, our prognostic analyses were only performed on the detrended time series.
The oceanic inputs were from the previously defined SST indices: the Niño-3 (NI3), NTA, and STA regions and the Atlantic dipole, DIP (NTA – STA = DIP). For the simple regressions, the time series of each individual climatic index was correlated with the detrended time series for maize and bean yields. For the multiple lin-ear regressions, the climatic indices were grouped ac-cording to the following: NI3 with NTA, NI3 with STA, NI3 with NTA & STA, NI3 with DIP, and finally NI3 with NTA, STA, & DIP. We also tested numerous time lags between climatic indices (from November of Year 0 to March of Year 1) and the agricultural yield vari-able observed in Year 1. The regression processes were calibrated using the set of odd years during the period from 1952 to 2000, and the prognostic analyses were tested over the set of even years during the same period2. This method allowed us to avoid any effect of
the well-known break in tropical climatic events in the 1970s (Soon-Il & Wang 2000).
For the analysis presented here, the selected precur-sory SST index linked to the Pacific (NI3) was aver-aged for November to January (Years 0 to 1), i.e. the same period analyzed in the previous section, and the 3 precursory SST indices linked to the Atlantic (NTA, STA, DIP) were averaged across the period from December to January (Years 0 to 1). These 2 choices of time lags are justified because the period around December is the most significant period representing
the ENSO index (Trenberth 1997) and because the cli-matic conditions during the period December to Janu-ary are regularly used by different worldwide climate institutes to forecast the coming rainy season over the Nordeste. Therefore, the proposed statistical forecast process has a different objective from that suggested by Sun et al. (2007), who used simultaneous periods between climatic indices and the growth of the culti-vated species in Ceará (February to May for maize, March to April for beans).
Fig. 8 shows the correlation (determination coeffi-cients in percentages) between the observed and sim-ulated yields for the calibration series of odd years, according to various linear or multi-linear combina-tions of climatic indices. The values, which are very similar for both species (with generally a slight advan-tage for beans), confirm again the predominant impor-tance of the Atlantic versus the Pacific in their climatic impacts on the Nordeste’s rain-fed agriculture. Indeed, the values vary strongly from about 15–22% (NI3 only) to > 40% (at the extreme right of Fig. 8), the latter value being associated with the simultaneous combination of the 4 climatic precursor indices. Thus, the multiple lin-ear regression model was used according to its most complete configuration, i.e. simultaneously weighted with the 4 climatic indices (NI3, NTA, STA, and DIP).
The model equations derived with this configuration are given below. They relate the forecasts for the annual yields (in US$ kg–1) of beans and maize using the climatic indices (in degrees):
Bean yield = (4)
380 – 84(NI3) + 1553(DIP) – 1414(NTA) – 1655(STA)
Maize yield = (5)
620 – 131(NI3) – 355(DIP) + 533(NTA) – 152(STA)
2An inverse calculation between even and odd years leads to overall similar results
0 5 10 15 20 25 30 35 40 45
NI3 NI3/ST
A DIP
NI3/DIP
NTA STA
NI3/NT A/ST
A
NI3/NT A
NI3 /NTA/ST
A/DIP
Predictors
r
2 (%)
Bean Maize
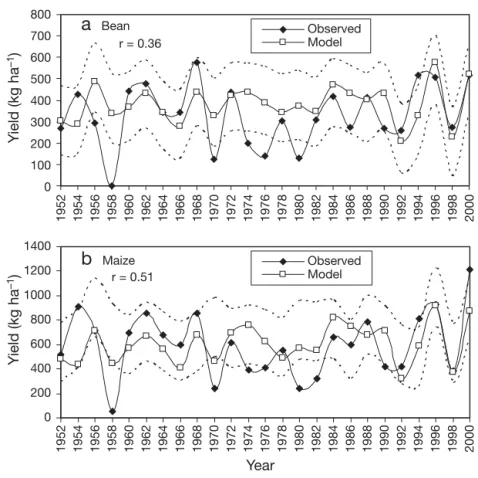
These equations were used for the model validation. Fig. 9 shows the simulated and (detrended) observed yields for the even years between 1952 and 2000. The correlation coefficients between the simulated and observed yields are + 0.36 and + 0.51 for beans and maize, respectively (Fig. 9a,b). Although these values exceed the threshold for statistical significance at 95% (+ 0.30), it is clear from the simulated and observed time series that the statistical model does not forecast the bean and maize yields very well, especially that of beans. However, it gives some indication (most of the time) of the quality of the coming harvests. This is true, for instance, for 1958 and 1970 (2 dry years). In another example, the 1960s, which did not experience large cli-matic variations (especially for the dipole; see Fig. 3), are relatively well simulated for both species. There is even an exceptional series of good results in 1996, 1998, and 2000 for both crops. It seems that the large inter-annual fluctuations observed for the yields in the even years of the validation series can be accommo-dated only with difficulty by the model, resulting in a slow modulation of the simulated values around a mean value. The climatic impact was also more pro-nounced for maize than for beans, as previously dis-cussed in the diagnostic part of the study.
5. CONCLUSIONS AND PERSPECTIVES There is a definite statistical relationship between the climatic variability of the tropical oceans (Pacific and Atlantic) and the traditional rain-fed crops in the Nordeste. Most of the climatic responses were very similar for bean and maize cultures, with a general (but not inevitable) advantage for maize. Although there are discrepancies for different climatic scenarios, good harvests of both crops were usually associated with cold SST over the tropics, whereas warm SST pro-duced bad crops.
We observed that the role of the tropical Atlantic (the dipole) is, at the very least, as important as the role of the equatorial Pacific (ENSO). The climatic impact of the Atlantic dipole is more robust and systematic than that of ENSO. The occurrence of a negative dipole in the Atlantic (i.e. a north-to-south positive gradient in SST anomalies over the tropics) correlated well with increases in the aggregate values (in US$ yield–1) for both agricultural species. This positive economic effect increased, especially for beans, during neutral climatic conditions over the Pacific. Conversely, the occurrence of a positive dipole in the Atlantic is related to a deficit in these aggregate values, regardless of the sign of the Pacific event. With neutral conditions over the Atlantic, the aggregate values seem to be more dependent on the Pacific conditions, especially during cold Pacific events. Series of oceanic events inducing severe drought in the Nordeste (i.e. El Niño events linked to positive Atlantic dipoles) are generally associated with very bad harvests. Paradoxically, an ‘ideal’ series of oceanic events inducing significant precipitation in the Nordeste (i.e. La Niña events linked to negative Atlantic dipoles) are not necessarily the most appropriate for planting. Indeed, strong excess precipitation, which is often associated with bacteriological epi-demics and/or insect proliferation, does not necessarily present the best condi-tions for a good harvest. Furthermore, equivalent quantities of precipitated water can produce harvests of different quantity and quality, according to whether the precipitation is well dis-tributed during the rainy season.
Usually in world agriculture, yields increase with time, indicating a contin-uous improvement in agricultural tech-niques. This is not the case for the sertãos. The Nordeste’s bean and maize
a
Bean0 100 200 300 400 500 600 700 800
1952 1954 1956 1958 1960 1962 1964 1966 1968 1970 1972 1974 1976 1978 1980 1982 1984 1986 1988 1990 1992 1994 1996 1998 2000
1952 1954 1956 1958 1960 1962 1964 1966 1968 1970 1972 1974 1976 1978 1980 1982 1984 1986 1988 1990 1992 1994 1996 1998 2000
Y
ield (kg ha
–1)
Y
ield (kg ha
–1)
Year
Observed Model
Observed Model r = 0.51
r = 0.36
b
Maize0 200 400 600 800 1000 1200 1400
Fig. 9. Observed (detrended) and simulated yields for: (a) beans and (b) maize during the validation years (even years between 1952 and 2000) for the statistical
yield time series are quite unique because they both show a negative trend during the years 1952 to 2000. Although not fully explained in this paper, such a neg-ative trend could have its origin in continuous impov-erishment and desertification of the soil.
After detrending the bean and maize yield time series, a multi-linear prognostic model was used to test its predictive capacity for the rain-fed harvests using only oceanic climate variability. The climatic precursor variables were chosen in the period from November to January (Years 0 to 1) for the SST anomaly in the east-ern tropical Pacific and from December to January (Years 0 to 1) for 3 tropical Atlantic indices (the dipole and its northern and southern components), i.e. before the beginning of the seasonal rainfall over the Nord-este (February to May). The set of calibrations was tested over the odd years during the period from 1952 to 2000, and the even years were used as the validation set. From the calibration analysis, the prognostic model is very sensitive to the Atlantic precursor indices. How-ever, it is most reliable (i.e. highest values for the cor-relation coefficients between the observed and simu-lated agronomic variables) when all the Pacific and Atlantic climatic precursor indices are used together. The correlation coefficients calculated according to that configuration on the set of validation data (odd years) were + 0.36 and + 0.51 for bean and maize yields, respectively. Although significant, these values only give some indication of the quality of the coming har-vests. Generally, they do not allow us to simulate the yield numbers with precision (especially for beans). However, as an interesting exception, the yields were efficiently predicted for both crops during the last study period (1996 to 2000), possibly because of the relevant climate forecasts and good communication of that information to the farmers. Another positive obser-vation was that some of the greatest deficits in yield during the last 50 yr were relatively well simulated by the model. These years, including 1958, 1970, and (again) 1998, were generally marked by extreme drought over the Nordeste, the logical climatic conse-quence of an El Niño episode combined with a positive Atlantic dipole. A less-obvious inference is the confir-mation that ideal climatic oceanic behaviour (La Niña + negative dipole) does not necessarily result in a good subsequent harvest. Indeed, even when a delayed relationship is evident between oceanic variability and some harvest variables, statistical forecasting with lin-ear regression methods still involves significant
diffi-culties. Other statistical methods (e.g. neuronal network methods) should be investigated in future research.
This study forms part of a broad scientific plan of FUNCEME, currently under development (e.g. Souza Filho & Lall 2003, Sun et al. 2005, 2007) based on a complete arsenal of regional climatic statistical and numerical modelling (using various types of downscal-ing techniques). In collaboration with other national and international institutes (e.g. CPTEC/INPE, INMET, IRI, ECMWF)3, this plan has, as its prime
objective, an improvement in the forecasting of the rainy season across the entire Nordeste (Hammer et al. 1996). The second objective, which depends largely on the success of the first, is to identify relevant and valid elements that will allow medium-scale forecasting of the socio-economic conditions that are associated with the intra-seasonal variability in the regional climate. The anticipated identification of these conditions should facilitate better planning of public policies, to minimize agricultural losses (Risbey et al. 1999) and thus improve the living conditions of the ‘sertanejos’ vis-à-vis climatic adversity.
Acknowledgements.This work is part of the CNPq-IRD Pro-ject ‘Climate of the Tropical Atlantic and Impacts on the Northeast’ (CATIN), No. CNPq Process 492690/2004-9. The authors thank the Fundação Cearense de Meteorologia e Recursos Hidricos (FUNCEME) and the Fundação Cearense para o Apoio Científico e Tecnológico (FUNCAP).
LITERATURE CITED
Adams RM, Chen CC, McCarl BA, Weither RF (1999) Eco-nomic consequences of ENSO for agriculture. J Clim 13: 165–172
Ayina LH, Servain J (2003) Spatial–temporal evolution of the low frequency climate variability in the tropical Atlantic. In: Goni GJ, Malanotte-Razzoli P (eds) Interhemispheric water exchange in the Atlantic Ocean. Elsevier Oceano-graphic Series, Elsevier, Amsterdam, p 475–495
Brant S (2007) Assessing the vulnerability to drought in Ceará, Northeast Brazil. MS thesis, School of Natural Resources and Environment, University of Michigan, Ann Arbor, MI. Available at: http://deepblue.lib.umich.edu/bitstream/ 2027.42/57432/1/Brant_thesis.pdf
Brou YT, Akindés F, Bigot S (2005) Climatic variability in Côte d’Ivoire: between social perceptions and agricultural responses. Cah Etudes Recherches Francophones Agri-cultures 14:533–540
Campos JNB, Studart TMC (2008) Drought and water poli-cies in Northeast Brazil: backgrounds and rationale. Water Policy 10:425–438
Cane MA, Eshel G, Buckland RW (1994) Forecasting Zim-babwean maize yield using eastern equatorial Pacific sea surface temperature. Nature 370:204–205
Carlson RE, Todey DP, Taylor SE (1996) Midwestern maize yield and weather in relation to extremes of the southern oscillation. J Prod Agric 9:2003–2009
Chen CC, McCarl BA, Hiel HSJ (2002) Agricultural value of ENSO information under alternative phase definition. Clim Change 54:305–325
3CPTEC/INPE: Centro de Previsão de Tempo e Estudos Climáticos/Instituto Nacional de Pesquisas Espacias; INMET: Instituto Nacional de Meteorologia; IRI: International Re-search Institute for Climate and Society; ECMWF: European Centre for Medium-Range Weather Forecasts
➤
➤
➤
Chimelli AB, Mutter CZ, Ropelewski C (2002) Climate fluc-tuations, demography and development: insights and opportunities for Northeast Brazil. J Int Aff 56:213–234 da Silva AAM, Young CC, Levitus S (1994) Atlas of surface
marine data, Vol 1. Algorithms and procedures. NOAA ATLAS NESDIS 6, US Department of Commerce, NOAA, NESDIS, Washington, DC
Doblas-Reyes FJ, Hagedorn R, Palmer TN (2006) Develop-ments in dynamical seasonal forecasting relevant to agri-cultural management. Clim Res 33:19–26
Enfield DB, Mayer DA (1997) Tropical Atlantic sea surface temperature variability and its relation to El Niño–South-ern Oscillation. J Geophys Res 102:929–945
Garnett ER, Khandekar ML (1992) The impact of large-scale atmospheric circulations and anomalies on Indian mon-soon droughts and floods and on world grain yields — a statistical analysis. Agric For Meteorol 61:113–128 Hammer GL, Holzworth DP, Stone R (1996) The value of skill
in seasonal climate forecasting to wheat crop manage-ment in a region with high climatic variability. Aust J Agric Res 47:717–737
Handler P (1990) USA maize yields, the El Niño and agri-cultural drought: 1867–1988. Int J Climatol 10:819–828 Hansen JW, Sivakumar MVK (2006) Advances in applying
climate prediction to agriculture. Clim Res 33:27–41 Hansen JW, Hodges AW, Jones JW (1998) ENSO influence on
agriculture in the southeastern United States. J Clim 11: 404–411
Hansen JW, Challinor A, Ines A, Wheeler T, Moron V (2006) Translating climate forecasts into agricultural terms: advances and challenges. Clim Res 33:1–2
Harrison DE, Larkin NK (1998) El Niño–Southern Oscillation sea surface temperature and wind anomalies, 1946–1993. Rev Geophys 36:353–399
Hastenrath S (1990) Prediction of northeast Brazil rainfall anomalies. J Clim 3:893–904
Hastenrath S, Greischar L (1993) Circulation mechanisms related to Northeast Brazil rainfall anomalies. J Geophys Res 98:35093–35102
Hastenrath S, Heller L (1977) Dynamics of climatic hazards in northeast Brazil. Q J R Meteorol Soc 103:77–92
Lemos MCT, Finan TJ, Fox RW, Nelson DR, Tucker J (2002) The use of seasonal climate forecasting in policymaking: lessons from northeast Brazil. Clim Change 55:479–507 Magalhães AR, Glantz MH (1992) Socio-economic impacts of
climate variations and policy response in Brazil. Esquel Brazil Foundation, Brasília
Moura AD, Shukla J (1981) On the dynamics of droughts in northeast Brazil: observations, theory and numerical experiments with a general circulation model. J Atmos Sci 38:2653–2675
Nelson DR (2005) The public and private sides of vulnerabil-ity to drought, an applied model of participatory planning in Ceará, Brazil. The University of Arizona, Tuscon Nobre P, Shukla J (1996) Variations of sea surface
tempera-ture, wind stress and rainfall over the tropical Atlantic and South America. J Clim 9:2464–2479
Philander SG (1990) El Niño, La Niña, and Southern Oscilla-tion. Academic Press, London
Risbey J, Kanlikar M, Dowlatabadi H, Granetz D (1999) Scale, context, and decision making in agricultural adaptation to climate variability and change. Mitig Adapt Strategies Glob Change 4:137–165
Ropelewski CF, Jones PD (1987) An extension of the Tahiti– Darwin Southern Oscillation index. Mon Weather Rev 115:2161–2165
Rubas DJ, Hill HSJ, Mjelde JW (2006) Economics and climate applications: exploring the frontier. Clim Res 33:43–54 Saravanan R, Chang P (2000) Interactions between tropical
Atlantic variability and El Niño–Southern Oscillation. J Clim 13:2195–2216
SCOR (Scientific Committee for Ocean Research) (1983) Pre-diction of El Niño. In: Proc 19th Meet of the Scientific Committee for Ocean Research working group, Vol 55. SCOR, Paris, p 47–51
Semenov MA, Porter JR (1995) Climatic variability and the modelling of crop. Agric For Meteorol 73:265–283 Servain J (1991) Simple climate indices for the tropical
Atlantic Ocean and some applications. J Geophys Res 96: 15137–15146
Sivakumar MVK (2006) Climate prediction and agriculture: current status and future challenges. Clim Res 33:3–17 Smit B, McNabb D, Smithres J (1996) Agricultural adaptation
to climatic variation. Clim Change 33:7–29
Soon-Il A, Wang B (2000) Interdecadal change in the struc-ture of the ENSO mode and its impact on the ENSO frequency. J Clim 13:2044–2055
Souza Filho FA, Lall U (2003) Seasonal to interannual ensem-ble streamflow forecasts for Ceará, Brazil: applications of a multivariate semiparametric algorithm. Water Resour Res 39:1307–1325
Sun L, Moncunnil DF, Li H, Moura AD, Filho FDDS (2005) Climate downscaling over Nordeste Brazil using NCEP RSM97. J Clim 18:551–567
Sun L, Li H, Ward MN, Moncunnil DF (2007) Climate variabil-ity and maize yields in semi-arid Ceará Brazil. J Appl Meteorol Climatol 46:226–240
Trenberth KE (1997) The definition of El Niño. Bull Am Mete-orol Soc 78:2771–2777
Uvo CB, Repelli CA, Zebiak SE, Kushnir Y (1998) The relationship between tropical Pacific and Atlantic SST and northeast Brazil monthly precipitation. J Clim 11: 551–562
Vogel C, O’Brien K (2006) Who can eat information? Examin-ing the effectiveness of seasonal climate forecast and regional climate-risk management strategies. Clim Res 33: 111–122
Wagner RG (1996) Mechanisms controlling variability of the inter-hemispheric sea surface temperature gradient in the tropical Atlantic. J Clim 9:2010–2019
Editorial responsibility: Nils Chr. Stenseth, Oslo, Norway
Submitted: April 14, 2008; Accepted: December 12, 2008 Proofs received from author(s): February 20, 2009
➤
➤
➤
➤
➤
➤
➤
➤
➤
➤
➤
➤
➤