Federal University of Ceará
Ph.D. in Chemistry
MANGIFERIN: MICROENCAPSULATION IN PECTIN/CHITOSAN
SYSTEMS, IN VITRO INTESTINAL METABOLISM AND
ANTICANCER ACTIVITY
In Cooperation with:
DKFZ – German Cancer Research Center
JOSÉ ROBERTO RODRIGUES DE SOUZA
MANGIFERIN: MICROENCAPSULATION IN PECTIN/CHITOSAN
SYSTEMS, IN VITRO INTESTINAL METABOLISM AND
ANTICANCER ACTIVITY
Thesis submitted to the coordination of the graduate program in chemistry at the Federal University of Ceará, as a partial requirement for obtaining a doctoral degree in chemistry.
Supervisors:
Federal University of Ceara:
Supervisor: Prof. Ph.D. Judith Pessoa de Andrade Feitosa
Co-supervisor: Prof. Ph.D. Nágila Maria Pontes Silva Ricardo
German Cancer Research Center:
Supervisor: Prof. Ph.D. Robert Wyn Owen
JOINT PROGRAM OF DOCTORAL SCHOLARSHIPS in the Federal Republic of Germany 2010/2011
DAAD - CAPES - CNPq
xáÑxv|tÄÄç wâÜ|Çz à{x y|Üáà çxtÜá Éy Åç Ä|yx
xáÑxv|tÄÄç wâÜ|Çz à{x y|Üáà çxtÜá Éy Åç Ä|yx
xáÑxv|tÄÄç wâÜ|Çz à{x y|Üáà çxtÜá Éy Åç Ä|yx
xáÑxv|tÄÄç wâÜ|Çz à{x y|Üáà çxtÜá Éy Åç Ä|yx
tÇw àÉ Åç yÜ|xÇwá yÉÜ à{x
tÇw àÉ Åç yÜ|xÇwá yÉÜ à{x
tÇw àÉ Åç yÜ|xÇwá yÉÜ à{x
tÇw àÉ Åç yÜ|xÇwá yÉÜ à{x
xÇvÉâÜtzxÅxÇà
I would like firstly to thank all professors of the Polymers group, especially Professors Judith and Nágila who helped to develop the feelings of being a scientist during these research years as well as their friendship and teachings as well as Professors Sandra and Regina for their teachings.
I would like to thank Professor Teresa for the collaboration opportunity, friendship and teachings.
I thank all the Professors and their teachings during my graduation studies.
I would like to thank Professor Bob for the teachings and patience during my stay at DKFZ, in Germany.
I would like to thank Gerd Würtele for his special patience in the lab at DKFZ and to Roswitha for the explanations.
I would like to thank Eva Frei and Andrea Breuer for the practice and explanations with cell culturing.
I would like to thank Professor Neli for the opportunity to have worked in the preventive oncology research group at the DKFZ and all group colleagues for the acquaintanceship.
I would like to thank my colleague Helder for the early years work in the lab as well as Pablyana for her early motivation and enthusiasm.
I would like to thank all lab colleagues of the polymers group in Brazil for the acquaintanceship along these years.
I would like to thank staff Teresa for thermal analysis, Orlando for the bureaucratic help and CENAUREM (Jeanny and Elenir) for NMR analysis.
I would like to thank some friends and colleagues during my stay in Germany for the time together.
I woud like to thank Prof Berger for the nice conversations and his group for some support. Thank you Michael for the help with flow cytometry.
I would like to thank Felix for the help with fluorescence microscopy.
All colleagues from Goethe Institute for the nice time learning german with so much fun and pleasure.
MANGIFERIN: MICROENCAPSULATION IN PECTIN/CHITOSAN
SYSTEMS, IN VITRO INTESTINAL METABOLISM AND
ANTICANCER ACTIVITY
This work was performed in four parts:
The first part was the isolation of pectin from a regional pumpkin in order to be used as matrix for drug encapsulation: Pumpkin (Cucurbita moschata) is an excellent and low cost source of carotenoids, precursors of vitamin A. Moreover, it is also a great source of natural and low-cost pectin. Pectin is a heterogeneous complex polysaccharide found in the primary cell wall of most cells and its effect on health is receiving growing interest for applications such as an ingredient in food products and in pharmaceutical formulations for drug encapsulation. In the first part of this work, high-methoxyl pectin was isolated from a regional pumpkin by the method of acid hydrolysis. The isolated pectin was characterized by FTIR, 1H 13C NMR, GPC, elemental analysis and rheology.
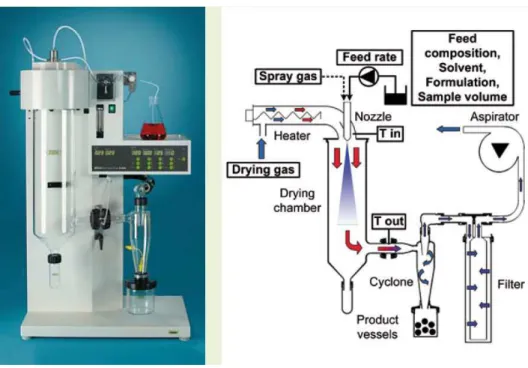
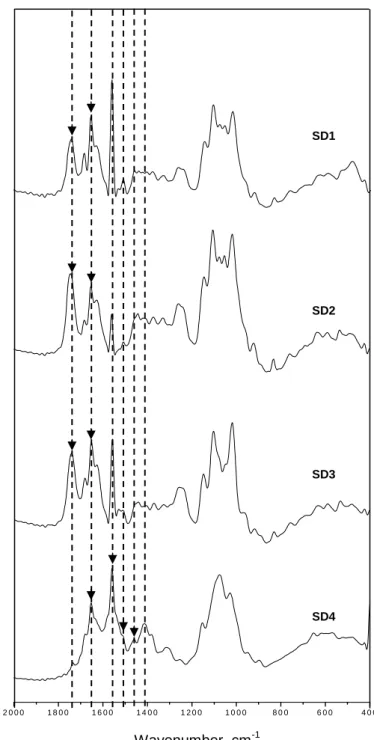
In the second part, pectin with chitosan samples were used for encapsulation procedure: Microencapsulation processes, such as spray-drying is an alternative to enhance solubility of bioactive materials and a good way to preserve, protect and control the release rate of a substance until it reaches its target in the body. Mangiferin is an active phytochemical present in various plants including Mangifera indica L. This substance is reported to have anti-cancer, antioxidant and other activities, but has a low solubility in aqueous medium. In the second part of this work we encapsulated mangiferin within four different natural polymers compositions by using spray-drying techniques. The products were characterized by FTIR, SEM and HPLC-ESI-MS. The efficiency of mangiferin incorporation into each encapsulate was calculated by HPLC. The highest encapsulation efficiency was determined to be for pectins using Polysorbate 80 (Tween 80) as emulsifier.
In the third part of this work, a gut metabolic study with mangiferin was performed: Mangiferin has low bioavailability, already reported in many scientific publications, and is more available in the gut, where it will be metabolized into other compounds. The aim of the third part was to produce and identify mangiferin metabolites simulating intestinal conditions as well as their isolation and characterization using different techniques such as HPLC-ESI-MS, Semipreparative HPLC, Nano-ESI-MS, and 1H / 13C NMR.
The fourth part was the investigation of the cytotoxicic effects of mangiferin and its metabolites in human cancer cell lines: The aim of the fourth study was to investigate the cytotoxic effects of mangiferin and its main metabolites in human cancer cell lines such as intestinal cancer cell line Caco-2 in order to observe the potential anticancer activity of these compounds in vitro.
MANGIFERINA: MICROENCAPSULAMENTO EM SISTEMAS
PECTINA/QUITOSANA, METABOLISMO INTESTINAL IN VITRO
E ATIVIDADE ANTICANCER
Este trabalho foi realizado em quatro partes:
A primeira parte trata do isolamento de pectina a partir de uma abóbora regional a fim de ser utilizado como matriz para encapsulamento de fármaco: a abóbora (Cucurbita moschata) é uma excelente fonte de baixo custo de carotenóides, precursores da vitamina A. Além disso, é também uma grande fonte de pectina natural e de baixo custo. A pectina é um polissacarídeo complexo e heterogêneo encontrado na parede celular primária da maioria das células vegetais e o seu efeito sobre a saúde está a receber um interesse crescente para aplicações tais como ingrediente em produtos alimentares e em formulações farmacêuticas para o encapsulamento de fármacos. Na primeira parte deste trabalho, pectina de alto grau de metoxilação foi isolada a partir de uma abóbora regional pelo método de hidrólise ácida. A pectina isolada foi caracterizada por FTIR, 1H 13C RMN, GPC, análise elementar e reologia.
Na segunda parte, pectinas e quitosana foram utilizadas para o procedimento de encapsulação: processos de microencapsulação, como atomização por spray-drying é uma alternativa para aumentar a solubilidade de materiais bioativos e uma boa forma de preservar, proteger e controlar a taxa de liberação de uma substância até atingir o seu alvo no corpo. Mangiferina é um fitoquímico ativo presente em várias plantas, incluindo Mangifera indica L. Essa substância é relatada por ter potencial anti-câncer, antioxidante e outras atividades, mas tem uma baixa solubilidade em meio aquoso. Na segunda parte deste trabalho, mangiferina foi encapsulada em quatro diferentes composições usando polímeros naturais através da técnica de spray-drying. Os produtos foram caracterizados por FTIR, MEV e HPLC-ESI-MS. A eficiência da incorporação de mangiferina em cada formulação foi calculada por HPLC. A maior eficiência de encapsulação foi determinada como sendo de pectinas utilizando Polissorbato 80 (Tween 80) como emulsionante.
Na terceira parte deste trabalho, um estudo simulando o metabolismo intestinal foi realizado com a mangiferina: mangiferina possui baixa biodisponibilidade, já relatado em muitas publicações científicas, e é mais disponível no intestino, onde irá ser metabolizada em outros compostos. O objetivo da terceira parte foi produzir e identificar metabólitos da mangiferina simulando as condições intestinais, bem como o seu isolamento e caracterização utilizando diferentes técnicas, tais como: HPLC-ESI-MS, HPLC semipreparativa, Nano-ESI-MS, 1H /
13
foi investigar os efeitos citotóxicos da mangiferina e seus metabólitos principais, em linhas de células tumorais humanas, tais como a linhagem tumoral de células intestinais Caco-2, a fim de observar a atividade anticâncer destes compostos in vitro.
CHAPTER 1
TABLE 1 – Assignments to the peaks of the 13C spectrum of pectic polysaccharides... 40
TABLE 2 – Microanalysis data for pumpkin pectin... 42
CHAPTER 2 TABLE 1 – Formulations used as polymer coating for mangiferin... 62
TABLE 2 – Assignment of bands in FTIR for encapsulated mangiferin systems... 66
TABLE 3 – HPLC-ESI-MS data for the mangiferin and encapsulated samples. Signal absorbances at 278 nm and tr at app. 21 min………..………...….……77
TABLE 4 – Values for the concentration of mangiferin in the capsules... 79
CHAPTER 3 TABLE 1 – Fermentations for mangiferin with different volunteers’ samples... 105
TABLE 2 – Human volunteers profiles (n=3)... 105
TABLE 3 – Fractionation of the fermented BHI in the SPE-C18 Cartridges... 107
TABLE 4 – HPLC-UV wavelengths from DAD 278 nm for mangiferin and metabolites... 112
TABLE 5 – Fractions separated from AFM V1-1 by semipreparative HPLC... 117
TABLE 6 – SPE gradient fractionation for AF of mangiferin with V1-2 sample... 125
TABLE 7 – SPE gradient fractionation for AF of mangiferin with V2-1 sample... 135
TABLE 8 – Fractions isolated from V2-1 SPE-F4 sample... 142
TABLE 9 – Fractions isolated from V2-1 SPE-F5 sample...150
TABLE 10 – 1H and 13C NMR data for norathyiol; chemical shifts in ppm relative to TMS (multiplicity, coupling J in Hz)... 160
TMS (multiplicity, coupling J in Hz)...163
CHAPTER 4
TABLE 1 – Composition of a standart cell culture medium with 10 % fetal bovine serum
(Full medium) for the A240286S cell line...
191
TABLE 2 – Composition of a standart cell culture medium with 15 % fetal bovine serum
(Full medium) for the Caco-2 cell line...
191
TABLE 3 – Scheme for planning cell culture assays using a 96-well plate... 198
TABLE 4 – First growth curve for the A240286S cells... 199
TABLE 5 – Cytotoxicity assay for mangiferin... 200
LIST OF FIGURES
CHAPTER 1
FIGURE 1 – Pumpkin Cucurbita moschata. Family: Cucurbitaceae; genus: Cucurbita;
species: moschata. (A) Pumpkin crop photograph from Encyclopædia Britannica
Online, (pumpkin, 2012). (B) Picture of pumpkin “jerimum de leite”, taken in the
polymers laboratory at the Federal University of
Ceará...
30
FIGURE 2 – Conventional (A) and alternative (B) pectin structures proposed by Willats
et al., 2006………..
31
FIGURE 3 – RGI (A) and RGII (B) structures. Figure from Sigmaaldrich website, 2012... 32
FIGURE 4 – Plant cell wall. Pectic substances are shown in purple. Figure from
Molecular expressions website, 2012...
33
FIGURE 5 – Junction zones of chemical interactions in pectic HG chains. Adapted from
Willats et al., 2006...
34
FIGURE 9 – 13C NMR spectrum for sample of pectin... 228 FIGURE 10 – GPC of pectin sample... 41
FIGURE 11 – Flow curves of continuous shear of 1% pectin in presence (○) and
absence (■) of 1% calcium ions at 25°C...
43
FIGURE 12 – Interaction between Ca2+ ions and unesterified carboxyl groups of galacturonic acid residues of HG chains. Adapted from Vincken et al., 2003b...
43
FIGURE 13 – Shear Flow curves for pectin solution (3%) in presence (○) and absence (■) of calcium ions (1%) at 25 °C...
44
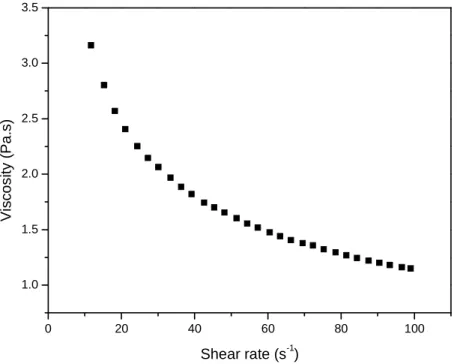
FIGURE 14 – Shear flow curve plot for aqueous solution of 5% pumpkin pectin (■) at 25 °C...
45
FIGURE 15 – Elastic (G’, ■) and loss modulus (G’’, ○) for the solution of pectin 5% in the presence (B) and absence (A) of Ca2+ (1%) in frequency range of 1-10 Hz at 25 °C………...
46
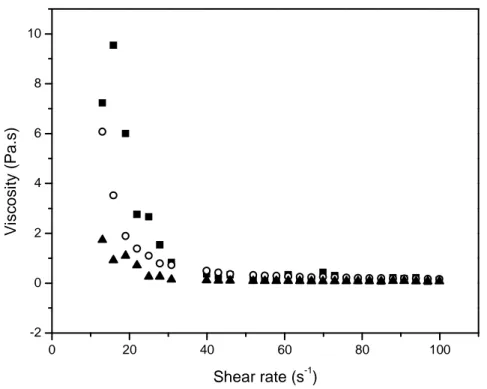
FIGURE 16 – Shear ramp plot for aqueous 3% pectin (w/v) at pH = 3 and at different temperatures (20 °C, ■ ; 40 °C, ○ ; 60 °C, ▲) ...
47
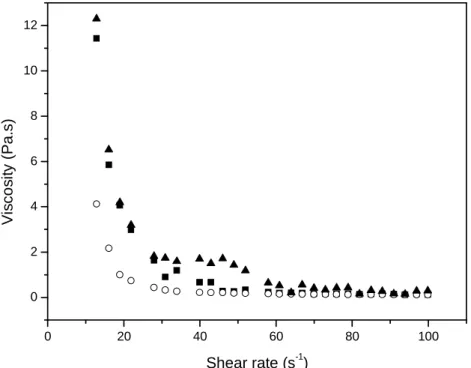
FIGURE 17 – Shear ramp for 3% pectin + 10% sucrose solution (w/v) of at pH = 3 and at different temperatures (20 °C, ■ ; 40 °C, ○ ; 60 °C, ▲). ...
48
FIGURE 18 – Temperature ramp plot for an aqueous pectin solution (3%, w/v) in presence (■) and absence (○) of sucrose (10%, w/v) and at pH = 3...
49
FIGURE 19 – Parameters G' (■) and G" (○) versus temperature for pectin (3%) (A) and
pectin/sucrose (10%) (B) systems (w/v)...
50
CHAPTER 2
FIGURE 1 – Different absorbance mechanisms of bioactive molecules released from
encapsulation systems to the intestine. Adapted from Chen et al.,
2006...
FIGURE 3 – Structure of mangiferin drawn using chemwin software……... 59
FIGURE 4 – Preparations of solid formulations for oral application. Figure adapted from
Lüllmann et al. (2000)...
60
FIGURE 5 – FTIR of encapsulated mangiferin samples with different polymer coatings.. 65
FIGURE 6 – FTIR for mangiferin between 400 - 2000 cm-1... 68
FIGURE 7 –- Photographs for the encapsulated materials obtained after the atomization
by spray-drying...
69
FIGURE 8 –SEM images for SD1 and SD2 samples... 71
FIGURE 9 – SEM images for SD3 and SD4 samples... 72
FIGURE 10 – HPLC chromatograms coupled with UV and MS spectra for standard and
extracted mangiferin……….………
74
FIGURE 11 – HPLC chromatograms coupled with UV and MS spectra for SD1 and SD2
samples………...
75
FIGURE 12 – HPLC chromatograms coupled with UV and MS spectra for the SD3 and
SD4 samples...
76
FIGURE 13 – Standard curve for mangiferin in MeOH... 78
CHAPTER 3
FIGURE 1 – Structure of norathyriol drawn using chemwin software... 91
FIGURE 2 – Complex of Erk2 With Norathyriol. Avaiable at NCBI, 2011 and PDB,
2011...
92
FIGURE 3 – Fermentation in the Colon. In the caecum and right colon, fermentation is
very intense with a rapid bacterial growth while in the left or distal colon, bacterial
populations are close to static. (from Guarner & Malagelada, 2003)...
94
FIGURE 4 – Impact of colonic microflora in reactions on polyphenols, carbohydrates and
other food ingredients. Adapted from Puupponen-Pimiä et al., 2002...
96
FIGURE 5 – Complex Enzyme-Substrate. Metabolic mechanism for activation of prodrugs.
From Living Science, 2011...
98
FIGURE 8 – HPLC chromatogram for 36 h of mangiferin anaerobic fermentation... 109
FIGURE 9 – HPLC chromatogram for 48 h of mangiferin anaerobic fermentation... 110
FIGURE 10 – HPLC chromatogram for 96 h of mangiferin anaerobic fermentation... 110
FIGURE 11 - HPLC chromatogram for 120 h of mangiferin anaerobic fermentation... 111
FIGURE 12 - HPLC-UV Spectra of mangiferin at 12 h and metabolites at 120 h of anaerobic fermentation... 113
FIGURE 13 – MS Spectrum of mangiferin at 0 h of anaerobic fermentation... 114
FIGURE 14 – MS Spectra of M-1 and M-2 at 120 h of reaction... 115
FIGURE 15 – Separation of mangiferin metabolites by semipreparative HPLC from V1-1 fermentation study... 116
FIGURE 16 - Fractions separated by semipreparative HPLC from AFM V1-1... 117
FIGURE 17 - UV spectrum for fraction 2: retention time at 15.08 min and absorbances at, 214, 224, 244, 262, 278, 322, 368 nm; and for fraction 3: retention time at 20.8 min and absorbances at 210, 222, 240, 256, 276, 318, 368 nm... 118
FIGURE 18 - HPLC chromatogram of the semiprep fraction 2 from V1-1 study... 119
FIGURE 19 - MS spectra of fraction 2 separated by semipreparative HPLC... 120
FIGURE 20 – UV Spectra of fraction 2. Absorbances at 208,218, 222, 242, 258, 274, 318, 366 nm………... 120
FIGURE 21 - HPLC chromatogram of the semiprep fraction 3 from V1-1 study... 121
FIGURE 22 – MS spectrum of fraction 2 separated by semipreparative HPLC... 122
FIGURE 23 - UV Spectrum of fraction 2. Absorbances at 210, 214, 222, 236, 254, 272, 316, 364 nm... 122
FIGURE 24 - HPLC chromatogram for 120h of mangiferin anaerobic fermentation... 123
FIGURE 25 - MS Spectra showing the consumption of mangiferin (0 h) to produce the Metabolites (120 h)... 124
FIGURE 26 - HPLC chromatogram of SPE fraction 3 from AFM V1-2... 126
FIGURE 27 - UV Spectra for mangiferin and metabolites detected in fraction 3... 127
FIGURE 28 - MS Spectra for mangiferin and metabolites detected in fraction 3... 128
SPE fraction 5 from AFM V1-2... 130
FIGURE 31 - MS Spectra for norathyriol and its monodehydroxyl metabolites detected in fraction 5……….. 131
FIGURE 32 - HPLC for 0 h of mangiferin anaerobic fermentation... 132
FIGURE 33 – HPLC for 24 h of mangiferin anaerobic fermentation... 133
FIGURE 34 - HPLC for 48 h of mangiferin anaerobic fermentation... 133
FIGURE 35 - HPLC for 72 h of mangiferin anaerobic fermentation... 134
FIGURE 36 - HPLC for 96 h of mangiferin anaerobic fermentation... 134
FIGURE 37 - HPLC for 120 h of mangiferin anaerobic fermentation. ... 135
FIGURE 38 - HPLC chromatogram for mangiferin detected in SPE fraction 3 from AFM V2-1. ……… 136
FIGURE 39 MS and UV spectra for mangiferin detected in fraction 3 ... 137
FIGURE 40 - HPLC chromatogram, UV and MS spectra M-2 detected in SPE fraction 4 from AFM V2-1 ... 138
FIGURE 41 - HPLC chromatogram and UV spectra for M-2 and M-3 detected in SPE fraction 5 from AFM V2-1... 139
FIGURE 42 - MS spectra for M-2 and M-3 detected in SPE fraction 5 from AFM V2-1 …… 140
FIGURE 43 - Separation of mangiferin metabolites by semipreparative HPLC from V2-1 fermentation study ... 141
FIGURE 44 - HPLC chromatogram, and UV spectra M-2 detected in SPE fraction 4 from AFM V2-1…... 143
FIGURE 45 - MS spectra for compounds detected in subfraction 1. ... 144
FIGURE 46 - HPLC chromatogram and UV spectra for compounds detected in subfraction 2. ... 145
FIGURE 47 - MS spectra for compounds detected in subfraction 2. ... 146
FIGURE 48 - HPLC chromatogram, UV, and MS spectra for compounds detected in subfraction 3... 147
FIGURE 49 - HPLC chromatogram and UV, MS spectra for compounds detected in subfraction 4. ... 148 FIGURE 50 - Separation of compounds by semipreparative HPLC from V2-1 SPE-5. ... 149
subfraction 2 from V2-1 SPE-F5... 152
FIGURE 53 - MS spectra for compounds detected in subfraction 2 from V2-1 SPE-F5... 153
FIGURE 54 - HPLC chromatogram for 0 h and 120 h of mangiferin anaerobic fermentation... 154
FIGURE 55 - HPLC chromatogram for 0 h of mangiferin blank fermentation without gut bacteria... 155
FIGURE 56 - HPLC chromatogram for 0 h and 120 h of blank anaerobic fermentation without mangiferin... 156
FIGURE 57 - Reaction progress of mangiferin anaerobic fermentation with volunteer 1 sample ... 157
FIGURE 58 - Nano-ESI-MS spectrum for V2F4-SP1 in negative ion mode... 229
FIGURE 59 - Nano-ESI-MS2 fragmentation spectrum of peak 259.1 for M-2... 230
FIGURE 60 - Nano-ESI-MS2 fragmentation spectrum of peak 421.2 for Ma………... 231
FIGURE 61 - Nano-ESI-MS2 fragmentation spectrum of peak 437.1 for M-1... 232
FIGURE 62 - Numbered structures for norathyriol, mangiferin ... 159
FIGURE 63 - 1H NMR spectrum (600 MHz) for norathyriol in CD3OD... 233
FIGURE 64 - 13C NMR spectrum (600 MHz) for norathyriol in CD3OD... 234
FIGURE 65 - 1H NMR spectrum (600 MHz) for mangiferin in CD3OD……….. 235
FIGURE 66 - 13C NMR spectrum (600 MHz) for mangiferin in CD3OD……… 236
FIGURE 67 - Numbered structure for homomangiferin. ... 162
FIGURE 68 - 1H NMR spectrum (600 MHz) for homomangiferin in CD3OD... 237
FIGURE 69 - 13C NMR spectrum (600 MHz) for homomangiferin in CD3OD... 238
FIGURE 70 - Rotamers for homomangiferin structure. ... 162
FIGURE 1 – Anatomy of the respiratory system, showing the trachea and both lungs and
their lobes and airways... 179
FIGURE 2 – Image of non-small cell lung cancer (Metrohealth, 2011)……….. 180
FIGURE 3 – The 20 Most Commonly Diagnosed Cancers in 2008. (*Colorectum including anus). Estimates from GLOBOCAN 2008. Prepared by Cancer Research UK, 2012)……… 181 FIGURE 4 – This picture shows part of the digestive system (National Cancer Institute. The Colon and Rectum, 2011)... 182
FIGURE 5 – Caco-2 cells co-immunostained with the polyclonal M-APC antibody for microtubules. A microtubule-independent junctional localisation is seen. Tubulin green, APC red and DAPI blue. Panel C is a merged image (Adapted from Lagford et al., 2006)... 184
FIGURE 6 – Chemical structure of the anionic dye sulforhodamine B and possible binding site on cell proteins (Sigma-Aldrich, 2012; Aniara, 2012)... 185
FIGURE 7 –- UV Spectra for the Sulforhodamine B Solution... 202
FIGURE 8 – First growth curve performed for the A240286S cell line... 203
FIGURE 9 – Second growth curve performed for the A240286S cell line... 204
FIGURE 10 – Third growth curve performed for the A240286S cell line ……… 205
FIGURE 11 – Growth of the cell line A240286S after 24 (A) and 48h (B) without (1) and with (2) the staining SRB dye ………. 206
FIGURE 12 – Growth of the cell line A240286S after 72 (C) and 96h (D) without (1) and with (2) the staining SRB dye……….. 207
FIGURE 13 – First growth curve performed for the Caco-2 cell line... 208
FIGURE 14 – Second growth curve performed for the Caco-2 cell line... 209
FIGURE 15 – Growth of the Caco-2 cell line before staining (A) and after 24 (B) and 48h (C) 72 (D) and 96h (E) with the staining SRB dye... 210
FIGURE 16 - Effect of mangiferin at different concentrations (0.1 µM, 1 µM, 10 µM, 100 µM) on the cell line A240286S. Cell density = 2.0 x 10³ cells/well... 211
FIGURE 17 - Effect of norathyriol at different concentrations (0.1 µM, 1 µM, 10 µM, 100 µM) on the cell line A240286S. Cell density = 2.0 x 10³ cells/well... 212
FIGURE 18 - Effect of norathyriol and at different concentrations (20 µM, 40 µM, 60 µM, 80 µM and 100 µM) on the cell line A240286S. Cell density = 2.0 x 10³ cells/well... 213 FIGURE 19 - Effect of homomangiferin and at different concentrations (0.1 µM, 1 µM, 10
100 µM) on the cell line A240286S in the SRB-Test. Cell density = 2.0 x 10³ cells/well … 215 FIGURE 21 - Synergistic effect of mangiferin/gallic acid and at different concentrations
(10/90 µM, 25/75 µM, 50/50 µM, 75/25 µM) on the cell line A240286S. Cell density = 2.0
x 103 cells/well……… 216
FIGURE 22 – IC50 calculation for norathyriol at 72h assay with A240286S cell line... 217
FIGURE 23 - Effect of mangiferin at different concentrations (0.1 µM, 1 µM, 10 µM, 100
µM) on the Caco-2 cell line. Cell density = 5.0 x 10³ cells/well……….. 218 FIGURE 24 - Effect of norathyriol at different concentrations (10 µM - 100 µM) on the
Caco-2 cell line. Cell density = 5.0 x 10³ cells/well... 219 FIGURE 25 - IC50 calculation for norathyriol at 72h assay with Caco-2 cell line……… 220
Final Conclusions
FIGURE 1 - Possible mechanism pathway for the anticancer activity of mangiferin...226
LIST OF ABBREVIATIONS
A240286S: non-small bronchial carcinoma cells
AFM: anaerobic fermentation of mangiferin
BHI: brain heart infusion
C1, 2, 3: compound 1, 2, 3.
Caco-2: human epithelial colorectal adenocarcinoma cells
CP: citric pectin
Ch: chitosan
DDW: double-distilled water
DM: degree of methoxylation
F: fraction
FBS: Fetal Bovine Serum
FTIR: Fourier transform infrared
GPC: gel permeation chromatography
HG: homogalacturonan
HM: high-methoxyl
HPLC-ESI-MS: chromatography-electrospray-ionization-mass spectrometry
IC50: concentration of compound that causes 50 % reduction in viable cell count
LM: low-methoxyl
Ma: mangiferin
Mang: mangiferin
M-2: metabolite 2, norathyriol
M-3: metabolite 3, norathyriol monodehydroxyl
McCT: Multiplex cell Contamination Test
NMR: nuclear magnetic resonance
NEAA: non-essential amino acids
NSCLC: non-small cell lung carcinoma
Pec: pectin
pH: potential hydrogen
PP: pumpkin pectin
RGI: ramnogalacturonan I
RGII: ramnogalacturonan II
SD: spray-drying
SEM: Scanning Electronic Microscopy
SF: subfraction
SPE: solid phase extraction
Suc: sucrose
Tris:Tris (hydroxymethyl) aminomethan
UV: ultraviolet
CONTENTS
CHAPTER 1
ISOLATION AND CHARACTERIZATION OF REGIONAL PUMPKIN PECTIN FOR DRUG
ENCAPSULATION
ABSTRACT ... 29
1. INTRODUCTION ... 30
1.1. PUMPKIN... 30
1.2. PECTINS AND ITS ISOLATION FROM PLANT CELL WALL... 31
1.3. PECTINS AND ITS APPLICATIONS... 34
2. EXPERIMENTAL... 35
2.1. EXTRACTION OF PECTIN... 35
2.2. INFRARED SPECTROSCOPY (FTIR)... 36
2.3. 1H, 13C NUCLEAR MAGNETIC RESONANCE (NMR)... 36 2.4. GEL PERMEATION CHROMATOGRAPHY (GPC)... 36
2.5. ELEMENTAL ANALYSIS – PROTEIN CONTENT... 36
2.6. RHEOLOGICAL MEASUREMENTS... 36
3. RESULTS AND DISCUSSIONS... 37
3.1. INFRARED SPECTROSCOPY (FTIR)... 37
3.2. NMR ANALYSIS: DETERMINATION OF METHYLATION (DM) BY 1H... 38 3.3. CHARACTERIZATION OF PECTIN BY 13C NMR... 39 3.4. GEL PERMEATION CHROMATOGRAPHY (GPC)... 41
3.5. ELEMENTAL ANALYSIS – PROTEIN CONTENT... 42
3.6. RHEOLOGICAL PROPERTIES – FLOW AND OSCILLATORY BEHAVIOR... 42
3.6. RHEOLOGICAL EXPERIMENTS – EFFECT OF TEMPERATURE AND SUCROSE. 47
4. CONCLUSIONS... 51
5. ACKNOWLEDGMENTS... 51
SPRAY-DRYING ENCAPSULATION OF MANGIFERIN USING NATURAL POLYMERS
ABSTRACT ... 56
1. INTRODUCTION ... 57
1.1. MICROENCAPSULATION TECHNIQUES…... 57
1.2. SPRAY-DRYING TECHNIQUE………... 58
1.3. MANGIFERIN – A XANTHONE GLUCOSIDE…... 59
1.4. POLYMERS & ENCAPSULATION OF BIOACTIVE SUBSTANCES... 60
2. EXPERIMENTAL... 62
2.1. MATERIALS………... 62
2.2. SPRAY-DRYING ENCAPSULATION OF MANGIFERIN……... 62
2.3. METHODS OF CHARACTERIZATION………..……... 63
2.3.1. INFRARED SPECTROSCOPY (FTIR)... 63
2.3.2. DIGITAL IMAGES OF THE ENCAPSULATED MATERIALS... 63
2.3.3. SCANNING ELECTRON MICROSCOPY (SEM)... 63
2.3.4. ANALYTICAL HPLC-ESI-MS... 63
2.3.5. ELECTROSPRAY IONIZATION MASS SPECTROMETRY (ESI-MS)... 64
2.3.6. DETECTION AND LOADING EFFICIENCY OF MANGIFERIN IN ENCAPSULATED SAMPLES BY HPLC-ESI-MS... 64
3. RESULTS AND DISCUSSIONS... 65
3.1. INFRARED SPECTROSCOPY (FTIR) OF THE ENCAPSULATED MATERIALS….…. 65
3.2. ELECTRONIC PHOTOGRAPHS OF THE ENCAPSULATED MATERIALS... 69
3.3. SCANNING ELECTRONIC MICROSCOPY - SEM... 70
3.4. ANALYSIS OF MANGIFERIN IN ENCAPSULATED MATERIALS BY HPLC... 73
3.5. DETERMINATION OF MANGIFERIN IN ENCAPSULATED MATERIALS... 78
4. CONCLUSIONS... 80
5. ACKNOWLEDGMENTS... 80
PRODUCTION AND CHARACTERIZATION OF MANGIFERIN METABOLITES BY
INTESTINAL ENVIRONMENT SIMULATION
ABSTRACT ... 86
1. INTRODUCTION ... 87
1.1. CONSIDERATION ABOUT DRUGS AND NATURAL COMPOUNDS………... 87
1.2. MANGIFERIN – A XANTHONE GLYCOSIDE PRODRUG……... 89
1.3. MANGIFERIN - BIOAVAILABILITY, PHARMACOCYNETICS AND
PHARMACODYNAMICS …... 90
1.4. CLEAVAGE OF THE GLUCOSYL BOND OF C-GLUCOSIDES BY HUMAN
INTESTINAL BACTERIA... 90
1.5. NORATHYRIOL – THE MANGIFERIN AGLYCONE………...…... 91
1.6. THE HUMAN GASTROINTESTINAL MICROBIOTA AND ITS
BIOTRANSFORMATION ACTIVITY ………...…... 93
1.7. BIOTRANSFORMATION ACTIVITY OF THE GASTROINTESTINAL MICROBIOTA (GIM)………...
96
1.8. BACTERIAL METABOLISM, ENZYMES AND POLYMORPHISM……….. 97
2. EXPERIMENTAL... 100
2.1. REAGENTS AND MATERIALS…... 100
2.2. EQUIPAMENTS………..……... 101
2.3. INSTRUMENTAL METHODS………..……... 102
2.3.1. ANALYTICAL HPLC... 102
2.3.2. ELECTROSPRAY IONIZATION MASS SPECTROMETRY (ESI-MS)... 102
2.3.3. SEMI-PREPARATIVE HPLC... 103
2.3.4. NANO-ELECTROSPRAY IONIZATION MASS SPECTROMETRY (NANO-ESI-MS)... 103
2.3.5. 1H AND 13C NUCLEAR MAGNETIC RESONANCE SPECTROSCOPY (NMR)... 103 2.4. ANAEROBIC FERMENTATION SET UP... 104
2.4.3. PROCESSMENT AND FRACTIONATION OF FERMENTATED BROTH ON SPE - C18 CARTRIDGES………...………...
106
3. RESULTS AND DISCUSSIONS... 108
3.1. ANAEROBIC FERMENTATION OF MANGIFERIN – VOLUNTEER 1 (AFM V1-1)
SAMPLE ……… 108
3.1.1. FERMENTATION ANALYSIS BY HPLC- ESI- MS………. 108
3.1.2. HPLC-UV SPECTRA FOR MANGIFERIN AND METABOLITES……… 111
3.1.3. MASS SPECTRA FOR MANGIFERIN AND METABOLITES………..……… 114
3.1.4. SEMIPREPARATIVE HPLC – PURIFICATION OF MANGIFERIN METABOLITES
FROM ANAEROBIC FERMENTATION OF MANGIFERIN WITH V1-1 SAMPLE…………...
116
3.1.5. ANALYSIS OF THE FRACTION 2 BY HPLC-ESI-MS………..…………. 119
3.1.6. ANALYSIS OF THE FRACTION 3 BY HPLC-MS-MS………..…………. 121
3.2. ANAEROBIC FERMENTATION OF MANGIFERIN – VOLUNTEER 1 (AFM V1-2) SAMPLE ………
123
3.2.1. FERMENTATION ANALYSIS BY HPLC- ESI- MS………..….. 123
3.2.2. ANALYSIS OF SPE FRACTIONS FROM AF OF MANGIFERIN - FERMENTATION
V1-2………... 126
SPE FRACTION 3……….………….. 126
SPE FRACTION 4……….…………. 129
SPE FRACTION 5……….. 130
3.3. ANAEROBIC FERMENTATION OF MANGIFERIN – VOLUNTEER 1 (AFM V1-2) SAMPLE ………
132
3.3.1. FERMENTATION ANALYSIS BY HPLC- ESI- MS………. 132
3.3.2. FERMENTATION ANALYSIS BY HPLC- ESI- MS………. 136
FRACTION 3……….………... 136
FRACTION 4………...……….... 138
FRACTION 5………... 139
3.3.3. SEMIPREPARATIVE HPLC – PURIFICATION OF MANGIFERIN METABOLITES
FROM ANAEROBIC FERMENTATION OF MANGIFERIN WITH V2-1 SPE-F4 SAMPLE… 141
3.3.4. HPLC-ESI-MS ANALYSIS OF SEMIPREPARATIVE HPLC SUBFRACTIONS FROM
SUBFRACTION 2……….……...……… 145
SUBFRACTION 3……….………... 147
SUBFRACTION 4………..……….………. 148
3.3.5. SEMIPREPARATIVE HPLC – PURIFICATION OF MANGIFERIN METABOLITES
FROM V2-1……… 149
3.3.6. HPLC-ESI-MS ANALYSIS OF SEMIPREPERATIVE HPLC SUBFRACTIONS FROM
V2-1 SPE-F5………
150
SUBFRACTION 1……….……….. 150
SUBFRACTION 2……….……….. 152
3.4. ANAEROBIC FERMENTATION STUDY – VOLUNTEER 3 (V3-1) SAMPLE ….…….…. 154
3.5. BLANKS FOR ANAEROBIC FERMENTATION OF MANGIFERIN ………..……….. 155
3.5.1. ANAEROBIC FERMENTATION WITHOUT BACTERIA ……...………..…….. 155
3.5.2. ANAEROBIC FERMENTATION WITHOUT MANGIFERIN SAMPLE ………. 156
3.6. KINECTS FOR THE GUT SIMULATION REACTIONS OF MANGIFERIN …………... 157
3.7. ANALYSIS OF MANGIFERIN AND METABOLITES BY NANO-ESI-MS2,3....……… 158 3.8. ANALYSIS OF MANGIFERIN AND METABOLITES BY 1H AND 13C NMR....…………... 159 4. CONCLUSIONS... 165
5. ACKNOWLEDGMENTS... 166
CYTOTOXIC SCREEN OF MANGIFERIN AND METABOLITES IN TWO
HUMAN TUMOR CELL LINES
ABSTRACT ... 177 1. INTRODUCTION ... 178 1.1. CANCER AND CHEMOPREVENTION – BASIC CONCEPTS …... 178
1.2. THE LUNGS AND OCCURRENCE OF CANCER ………... 179
1.3. THE NON-SMALL BRONCHIAL CARCINOM CELLS…... 180 1.4. THE COLON, RECTUM AND OCURRENCE OF CANCER... 182 1.5. THE CACO-2 CELL LINE... 183 1.6. CITOTOXICITY ASSAYS OF COMPOUNDS - SULFORHODAMINE B METHOD... 184 2. EXPERIMENTAL... 186
THAW OF CELLS………... 195 2.2.5. CULTIVATION OF CELLS - CELL PASSAGES OF THE ADHERENT GROWING A240286S AND CACO-2 CELLS LINES …...
196
2.2.6. DETERMINATION OF THE OPTIMUM GROWTH DENSITY OF THE CELL LINE
A240286S ……… 197
2.2.7. CYTOTOXICITY EXPERIMENTS ……… 197
2.2.8. EXAMPLE OF A CELL CULTURE EXPERIMENT PLANNING ………..……… 198
3. RESULTS AND DISCUSSIONS... 201 3.1. CITOTOXICITY TEST FOR THE CELL LINES A240286S AND CACO-2 USING
THE SULFORHODAMINE B – STAINING METHOD….……….. 201
3.2.1. GROWTH CURVES FOR THE A240286S CELLS... 203 3.2.2. GROWTH CURVES FOR THE CACO-2 CELLS... 208 3.3. IN VITRO CYTOTOXICITY ASSAYS WITH THE CELL LINE A240286S... 211 3.3.1. EFFECT OF MANGIFERIN AND METABOLITES ON THE CELLS... 211
3.3.2. EFFECT OF GALLIC ACID AND SYNERGY OF MANGIFERIN/GALLIC ACID ON THE CELL LINE A240286S... 215 3.3.3. CALCULATING IC50 VALUES FOR THE CYTOTOXIC ACTIVITY AGAINST THE
A240286S CELL LINE...
217
3.4. IN VITRO CYTOTOXICITY ASSAYS WITH THE CACO-2 CELL LINE... 218 3.4.1. EFFECT OF MANGIFERIN AND METABOLITES ON THE CELLS... 218 3.4.2. CALCULATING IC50 VALUES FOR THE CYTOTOXIC ACTIVITY AGAINST THE
CACO-2 CELL LINE………... 220
4. CONCLUSIONS... 221 5. ACKNOWLEDGMENTS... 221 6. REFERENCES... 222
FINAL CONCLUSIONS... 226
CHAPTER 1
Isolation and Characterization of Regional Pumpkin Pectin for
Drug Encapsulation
Souza, J. R. R1, Brito, E. S.2, Ricardo, N. M. P. S1, Feitosa, J. P. A.1
1
Departament of Organic and Inorganic Chemistry, Federal University of Ceará
P. O. Box: 6.021, ZIP-Code: 60455-760, Fortaleza, Ceará, Brazil
2
Embrapa Tropical Agroindustry, R. Dra. Sara Mesquita, 2270, Pici, 60511-110,
Fortaleza, CE, Brazil
Pumpkin (Cucurbita moschata) is an excellent and low cost resource of carotenoids, precursors of vitamin A. Moreover, it is also a great source of natural and low-cost pectin. Pectin is a heterogeneous complex polysaccharide found in the primary cell wall of most cells and its effect on health is receiving growing interest and for applications such as an ingredient in food products and in pharmaceutical formulations for drug encapsulation. In this work, high-methoxyl pectin was isolated from a regional pumpkin by the method of acid hydrolysis. The isolated pectin was characterized by FTIR, 1H and 13C NMR, GPC, elemental analysis and rheology.
1. Introduction
1.1. Pumpkin
Pumpkin, a member of the plant family Cucurbitaceae, is an excelent resource of carotenoids, precursors of vitamin A and has been regarded as a functional food. Several other phytochemicals have been isolated from pumpkin: polysaccharides, phenolic glycosides, 13-hydroxy-9Z, 11E-octadecatrienoic acid from the leaves of pumpkin and proteins from germinated seeds (Arima & Rodriguez-Amaya, 1990; Adams et al., 2012). The Figure 1 shows pictures of pumpkin species Cucurbita moschata.
Figure 1 – Pumpkin Cucurbita moschata. Family: Cucurbitaceae; genus: Cucurbita; species: moschata. (A) Pumpkin crop photograph from
Encyclopædia Britannica Online, (pumpkin, 2012). (B) Picture of pumpkin
“jerimum de leite”, taken in the polymers laboratory at the Federal University of Ceará.
Under the dried form, pumpkin can be stored longer and used in various culinary preparations, contributing with one more food option to combat hypovitaminosis A, which affects thousands of children in Brazil and in other countries of the world. Vitamin A (retinol) is also reported to have an essential role in embryogenesis: during pregnancy, it is transported by retinol binding protein from the maternal blood supply to the embryo through receptor-facilitated transport (Gilchrist et al., 2010). Pumpkin is also reported to be a low cost source of pectin (Murkovic et al., 2002).
1.2. Pectins and its isolation from plant cell wall
Pectin is a multifunctional complex polysaccharide and abundant component from cell walls of all plants (Ngouémazong et al., 2012; Willats et al., 2006). Pectic polysaccharides consist mostly of polymers rich in galacturonic acid, containing significant amounts of rhamnose, arabinose and galactose as well as 13 other different monosaccharides (Vincken et al., 2003a). The three major polysaccharides are currently defined: homogalacturonan (HG), ramnogalacturonan I (RGI) and ramnogalacturonan II (RGII) as shown in Figure 2 (Vincken et al., 2003a; Waldron et al., 2003). Willats et al., (2006) proposed a new pectin structure which may have homogalacturonan as side chains.
HG is a linear polymer consisting of 1,4-linked α-D-GalA, whilst RGI consists of the repeating disaccharide [→4)-α-D-GalA-(1→2)-α-L-Rha-(1→] to which a variety of different glycan chains (principally arabinan and galactan) are attached to the Rha residues. RGII has a backbone of HG rather than RG, with complex side chains attached to the GalA residues (Willats et al., 2006). The structures of RGI and RGII are shown in Figure 3.
The primary wall contains 80–90% polysaccharide and 10–20% protein. Cellulose, hemicellulose and pectin are the main polysaccharide components in the primary wall (Etzler & Mohnen, 2009). The main role of pectin is to give physical strength to the plant together with the other polymers. Especially HG and RGII are well known to be involved in strengthening the wall (Harholt et al., 2010). We can see in Figure 4 a general view of a plant cell wall structure showing pectin chains interlaced with other cell wall polysaccharides.
The composition, structure, and physiological properties of pectins can be influenced by extraction conditions as well as source, location and many other environmental factors. The network of pectin must be broken to occur extraction. This may involve extraction with calcium chelating agents, dilute bases or dilute acids. Alternatively, fragments of pectic polysaccharides can be released through the use of enzymatic degradation.
Figure 4 – Plant cell wall. Pectic substances are shown in purple. Figure from Molecular expressions website, 2012.
plant cell wall, is hydrolyzed into pectin (Krall & McFeeters, 1998; Pagán et al., 2001).
1.3. Pectins and its applications
Pectin is traditionally used as a gelling agent for jellies and marmalades. A pectin gel is formed when portions of HG are crosslinked to form a three dimensional crystalline network in which water and solutes are trapped. Various factors determine gelling properties such as temperature, pectin type, degree of methoxylation (DM), degree of acetylation, pH, sugar and other solutes like calcium ions, for example. Pectins have been categorized as high-methoxyl (HM) or low-methoxyl (LM) with DMs of >50% and <50% respectively. In high-ester pectins, the junction zones are formed by the cross-linking of HG by hydrogen bridges and hydrophobic forces between methoxyl groups, both promoted by high sugar concentration and low pH, whereas in low-ester pectins, junction zones are formed by calcium (or some other divalent metals) crosslinking between free carboxyl groups (Bottger, 1990; Willats et al., 2006) as can be seen in Figure 5.
Figure 5 – Junction zones of chemical interactions in pectic HG chains. Adapted from Willats et al., 2006.
Ptichkina et al., 2008). Pectins also offer health benefits to consumers. For example, they are being increasingly recognized as important precursors of substrates for gastrointestinal functions and structures. Foods rich in fiber are usually recommended for diabetics, because they are able to reduce the glycemic response to food and thus reduce the need for insulin (Guillon & Champ, 2000). Pectin is also effective on lowering the cholesterol level in blood, removing heavy metal ions from the body, stabilizing blood pressure, and restoring intestinal functions (Voragen et al., 1995). Pectin and pectic oligosaccharides have been reported to induce apoptosis in human colonic adenocarenoma cells, what suggests it could be applied in oncology prevention formulations (Olano-Martin et al., 2003).
Although the potential stock of these raw materials enables the main pectin producers (USA, Germany, Denmark) to plan an annual increase of pectin production of approximately 3.8% (Phillips, 2000), searching for new pectin-containing raw materials is an important task of science and industry (May, 1990).
In this work pectin was extracted from a pumpkin (Cucurbita moschata) regionally known as regional “jerimum de leite” and characterized in order to be used as matrix for future encapsulation studies.
2. Experimental
2.1. Extraction of pectin
2.2. Infrared Spectroscopy (IR)
The Fourier Transform IR spectrum (FT-IR) of pectin was recorded with a Shimadzu IR spectrophotometer (model 8300) in the range of 400 and 4000 cm−1 as KBr pellet.
2.3. 1H, 13C NMR Nuclear Magnetic Resonance
Spectra of 0.1% (w/v) solutions in D2O were recorded at 70 °C on a
Fourier Transform Bruker Avance DRX 500 spectrometer with an inverse multinuclear gradient probe-head equipped with z-shielded gradient coils, and with Silicon Graphics. Sodium 2,2-dimethylsilapentane-5-sulphonate (DSS) was used as the internal standard (0.00 ppm for 1H).
2.4. Gel Permeation Chromatography (GPC)
The molar mass peak (Mpk) of pectin was determined by gel permeation chromatography (GPC) using a Shimadzu instrument (Ultrahydrogel linear column, 7.8 x 300 mm), at room temperature, flow rate of 0.5 mL/min, polysaccharide concentration of 0.1% (w/v) and 0.1 mol/L NaNO3 as the
solvent. A differential refractometer was used as detector. The elution volume was corrected by the use of the internal marker ethylene glycol at 11.25 mL. Pullulan samples (Shodex Denko) of molar mass 5.9 x 10³, 1.18 x 10⁴, 4.73 x 10⁴, 2.12 x 10⁵, and 7.88 x 10⁵ g/mol were used as standards.
2.5. Elemental analysis – protein content
The elemental analysis of carbon, hydrogen and nitrogen of pumpkin pectin was performed using a microanalyzer Carlo ERBA EA 1108.
2.6. Rheological Measurements
3. Results and Discussion
3.1. Infrared Spectroscopy (FTIR)
An overview of the IR spectrum of pectin is shown in Figure 6. The "fingerprint" region of the spectrum (up to approx. 2000 cm-1) includes the region of 1200-1800 cm-1 as shown.
Figure 6 - FTIR spectrum of pectin from pumpkin.
We observe the region that characterizes the state of carboxylic groups (approx. 1750-1350 cm-1) (Filipov, 1992). The band at approx. 1743 cm-1 is indicative of the stretching group C=O of non-ionized carboxylic acid (methylated or protonated). Its ionization (formation of salt) leads to their disappearance, and the appearance of stretch modes of COO- in approx. 1600-1650 and 1400-1450cm-1, respectively (Filipov, 1992). The degree of methylation (DM) is defined as the amount of ester groups compared to the total amount of acid groups and carboxylic ester and it is observed that the high intensity of the band at 1743 cm-1 show that the pectin obtained is of high degree of methylation.
3 4 3 0 c m -1 1 6 5 0 cm -1 1 4 3 0 cm -1 1 1 1 0 cm -1 1 0 1 0 cm -1 6 3 0 cm -1 2 9 3 0 cm -1
4000 3500 3000 2500 2000 1500 1000 500
-0.2 0.0 0.2 0.4 0.6 0.8 1.0 1.2 A b s
3.2. NMR analysis: Determination of methylation (DM) by 1H
For the determination of DM, the integrals of H-5 (see Figure 7) adjacent to ester (ICOOMe) are compared with the sum of integrals of H-5 adjacent to the
ester (ICOOMe) and H-5 adjacent to the carboxylate (ICOO-).
Figure 7 - Structure of a fragment of pectin.
Due to close proximity (or overlap) of the signals for H-1 and H-5COOMe, it
is only possible to determine the full combined to H-1 and H-5COOMe (IH1 +
ICOOMe). The value of DM was calculated at 58% (Figure 8, Appendix 1).
We can also observe in the spectrum of the polysaccharide, a very large signal at 3.81 ppm related to methyl groups binding to carboxyl groups of galacturonic acid. Signals at around 2.1 ppm are related to acetyl groups and were not observed for the pectin. There are other signals related to D-galacturonic acid: H-1, 5.09 ppm; H-2, 3.76 ppm; H-3, 3.97 ppm; H-4, 4.41 ppm; H-5, 4.68 ppm (Tamaki et al., 2008).
Grasdalen (Oakenfull, 1991) pioneered the determination of DM by 1H NMR. He performed detailed analysis of the sequence of free galacturonic acid and pectin fragments of groups tri-and tetrameter. By using this simple method, it is possible to characterize pectins having a specific DM, and therefore, with
specific gelling properties that are dependent on DM (Oakenfull, 1991; Axelos & Thibault, 1991).
3.3. Characterization of pectin by 13C NMR
The spectrum of 13C nuclear magnetic resonance for the sample of pectin is shown in Figure 9 (Appendix 2). In the spectrum of the polysaccharide, a signal at about 53.5 ppm was assigned to methyl groups attached to carboxylic groups of galacturonic acid (Keenan et al., 1985) and a signal at 173 ppm was attributed to carboxylic groups linked to methyl groups (Catoire et al., 1998).
Table 1 - Assignments to the peaks of the 13C spectrum of pectic polysaccharides (Tamaki et al., 2008, Ha et al., 2005).
Polymer Carbon Shift (ppm) Shift (ppm) from literature
Galacturonan C-6 free 176 175.4 (Ha et al., 2005)
Galacturonan C-6 esther 171 171.4 (Ha et al., 2005)
Arabinan C-1 106 107.8 (Ha et al., 2005)
Galacturonan C-1 101 100.8 (Ha et al., 2005)
Arabinan C-4 84 84.7 (Ha et al., 2005)
Arabinan C-4 83 83.0 (Ha et al., 2005)
Arabinan C-2 81 81.6 (Ha et al., 2005)
Galacturonan C-4 79 81.1 (Tamaki et al., 2008)
Galactan C-4 78 78.4 (Ha et al., 2005)
Arabinan C-3 77 77.4 (Ha et al., 2005)
Galacturonan C-3 71 72.0 (Tamaki et al., 2008)
Galacturonan C-5 73 74.2 (Tamaki et al., 2008)
Galacturonan C-2 68 71.3 (Tamaki et al., 2008)
Arabinan C-5 67 67.7 (Ha et al., 2005)
Galactan C-6 62 61.5 (Ha et al., 2005)
Arabinan C-5 61 62.0 (Ha et al., 2005)
Galacturonan OCH3 53.5 53.6 (Ha et al., 2005)
3.4. Gel permeation chromatography (GPC)
A wide peak (7.0 mL) with a little shoulder (7.6 mL) is present in the chromatogram of pectin sample (Figure 10). The peak molar mass (Mpk) of the
polysaccharide was estimated using pullulan (a neutral polysaccharide) standard plot. Taking into account that the pectin is a polyelectrolyte, it is expected that it elutes at a lower volume than a neutral macromolecule with the same molar mass. This is due to chain stiffening and extent, as a consequence of electrostatic repulsion of carboxylate groups.
Figure 10 - GPC of pectin sample.
The estimated Mpk is 9.5 x 10⁵ g/mol. The molar mass of pectin is equal
or lower than that value. The molar mass of pectins ranges from 1.4 x 10⁵ to 2.3 105 g/mol (Yoo et al., 2006; Morris et al., 2008).
5.0 5.5 6.0 6.5 7.0 7.5 8.0 8.5 9.0
re
fr
a
c
ti
o
n
i
n
d
e
x
elution volume (mL)
3.5. Elemental analysis – protein content
The data of microanalysis of pectin are shown in Table 2. The amount of protein obtained was 2.7%. The calculation was performed using a conversion factor equal to 5.85 (Azero & Andrade, 2002).
Table 2 - Microanalysis data for pumpkin pectin.
The instrument automatically determines C, H, N by combustion of the sample, separation of the combustion gases and measurement by thermal conductivity detector.
3.6. Rheological properties – flow and oscillatory behavior
The flow curves of pectin solutions in the presence and absence of calcium ions are shown in Figure 11. The solution of pectin in the presence of calcium ions exhibited pseudoplastic flow behavior. For the flow curve of the pectin solution in the absence of calcium ions, significantly lower values were observed in a Newtonian flow behavior. The behavior was similar to concentrations of 1 and 3%.
% C 34,24
% N 0,46
Figure 11 - Flow curves of continuous shear of 1% pectin in presence (○) and absence (■) of 1% calcium ions at 25 °C.
This increase in viscosity values is due to the gelling of the solution. Cross-links are formed between Ca2+ and the negatively charged carboxyl groups of HG, leading to the formation of structures known as “Egg-boxes”. Figure 12 shows ‘‘Egg-boxes’’ junction zones in which non-methoxylated galacturonic acid residues blocks interact strongly with calcium ions which have specific positions in well-adapted cavities (Braccini & Pérez, 2001).
Figure 12 - Interaction between Ca2+ ions and unesterified carboxyl groups of galacturonic acid residues of HG chains. Adapted from Vincken et al. (2003b).
0 20 40 60 80 100
0 5 10 15 20 25
V
is
c
o
s
it
y
(
P
a
.s
)
Shear rate (1/s)
Pectin 1%
The flow curves of the 3% pectin solution in the presence and absence of calcium ions are shown in Figure 13. It is observed that the pectin solution in the presence of calcium ions exhibited pseudoplastic flow behavior. For the flow curve of the pectin solution in the absence of calcium ions, significantly lower values were observed in a Newtonian flow behavior as in 1 % pectin solution.
Figure 13 – Shear Flow curves for pectin solution (3%) in presence (○) and absence (■) of calcium ions (1%) at 25 °C.
This increase in viscosity values is due to the gelling of the solution. Cross-links are formed between the Ca2+ ions and the negatively charged carboxyl groups of pectin molecules, leading to the formation of “egg-box” structures.
At higher concentration of pectin in aqueous solution (5%), a pseudoplastic behavior was observed to the solution even in the absence of calcium ions (Figure 14). In presence of calcium ions the solution became a firm gel and did not flow. Similar results were determined in the study by Singthong
et al. (2005) with LM pectin extracted from the leaves of Cissampelos pareira, a
species of plant used in Chinese herbology.
0 20 40 60 80 100
0.0 0.5 1.0 1.5 2.0 2.5 3.0 3.5 4.0 v is c o s it y ( P a .s )
shear rate (1 / s) Pectin 3%
Figure 14 – Shear flow curve plot for an aqueous solution of 5% pumpkin pectin (■) at 25 °C.
It was then carried out an oscillating experiment in a frequency range of 1-10 Hz to compare the values of the modules G 'and G'' of the two solutions to 5% in the presence and absence of calcium ions (Figure 15).
In Figure 14A we can observe an increasing of modulus values over the frequency range and dominance of the G'' modulus values along the route with small oscillations around 5 and 9 Hz. This system was characterized as a fluid material. In the presence of calcium ions the behavior has been somewhat different as can be seen in Figure 14B. High values of G' was observed and this system was characterized as a very tight system, i.e., a strong gel. It was observed with the naked eye that a hardened layer of gel was formed soon after the experiment. The low values of G''/ G' also confirmed the formation of a firm gel. Fraeye et al. (2009) studied pectins from plants and fungal origins. They observed the pectin and calcium concentration influence on the formation of gels and noted that at lower pectin concentrations, it behaved as a fluid and at higher concentration, gel properties were observed as in agreement with results obtained in this work.
0 20 40 60 80 100
1.0 1.5 2.0 2.5 3.0 3.5
V
is
c
o
s
it
y
(
P
a
.s
)
Figure 15 - Elastic (G’, ■) and loss modulus (G’’, ○) for the solution of pectin 5% in the presence (B) and absence (A) of Ca2+ (1%) in frequency range of 1-10 Hz at 25 ° C.
0 2 4 6 8 10
20 30 40 50 60 70 80 90 100 110 A G ' G '' (P a ) Frequency (Hz)
0 2 4 6 8 10
0 200000 400000 600000 800000 1000000 1200000 1400000 1600000 1800000 B G ' G '' (P a ) Frequency (Hz)
Pectin 5% + Ca % G'
3.7. Rheological experiments – Effect of temperature and sucrose
Sample preparation of pectin and pectin/sucrose was performed in phosphate buffer pH = 3 and after that the solutions were stored overnight at 10 °C. It was observed visually the formation of a gelatinous solution under these conditions. The rheological study was carried out preparing a shear ramp for each sample. The test was performed at different temperatures as shown in Figure 16.
Figure 16 – Shear ramp plot for aqueous 3% pectin at pH = 3 and at different temperatures (20, ■ ; 40, ○ ; 60 °C, ▲).
It was observed in Figure 16 shows a pseudoplastic behavior for all systems, where there is a sudden decrease of the viscosity values increasing shear rate. It can also be observed in Figure 15 the effect of temperature on viscosity. Increasing on the temperature we can observe a decrease of viscosity values and being initially more pronounced as increases shear rate values. There is a tendency to constant values after 50 s-1.
In Figure 17 we can observe a somewhat different behavior on viscosity values for the pectin and sucrose solutions in the same conditions.
0 20 40 60 80 100
-2 0 2 4 6 8 10
V
is
c
o
s
it
y
(
P
a
.s
)
Figure 17 – Shear ramp for 3% pectin + 10% sucrose solution of at pH = 3 and at different temperatures (20, ■ ; 40, ○ ; 60 °C, ▲).
It was observed in Figure 17 the same shear thinning behavior shown in Figure 16, as the viscosity values decrease sharply increasing shear rate. The difference lies in the effect of temperature on the sample. It is observed that with increasing temperature from 20 to 40 º C there is a decrease in viscosity values, while a temperature increase from 40 to 60 ºC causes an increase in viscosity values. This can be explained by interactions between the pectin chains and sucrose that at high temperatures and low pH favors the formation of gel. Studies reported before explains that sucrose may provide more hydroxyl groups to stabilize the structure of junction zones and promote hydrogen bonds to immobilize free water (Fu & Rao, 2001).
In order to study the inversion in viscosity seen in Figure 17, where the values at 60 ºC were above that at 40 ºC, we performed a temperature test between 20 and 60 °C for the same samples and the same inversion in pectin/sucrose could be observed as can be seen in Figure 18.
0 20 40 60 80 100
0 2 4 6 8 10 12
V
is
co
s
it
y
(P
a
.s)
Figure 18 – Temperature ramp plot for an aqueous pectin solution (3%) in presence (■) and absence (○) of sucrose (10%) and at pH = 3.
Between 20 and 40 °C a sharp decrease in viscosity values due to the temperature effect. But around 44 °C it was observed a process of reversing with a rise in viscosity values. Evageliou et al. (2000) studied the effect of adding sucrose to pectin (DM 70%) at low pH and observed a reversal of values with increasing temperature, giving evidence for the formation of additional intermolecular associations.
It was also carried out a study of the system pectin / sucrose by oscillatory rheology at 10 rad / s, 2% strain, the angular velocity of 1 °C / min and temperature ranging from 20 to 55 º C, as shown in Figures 19.
20 25 30 35 40 45 50
0.10 0.15 0.20 0.25 0.30 0.35 0.40 0.45
V
is
c
o
s
it
y
(
P
a
.s
)
Temperature (°C)
Figure 19 - Parameters G ' (■) and G " (○) versus temperature for pectin (3%) (A) and pectin/sucrose (10%) (B) systems.
20 25 30 35 40 45 50 55 60
0 1000 2000 3000 4000 5000 6000
G
',
G
''
(P
a
)
Temperature (°C) B
20 25 30 35 40 45 50 55 60
0 10000 20000 30000 40000 50000 60000
G
',
G
''
(P
a
)
Observing the graphs in Figure 19 we see that the parameters G 'and G " of the 3% pectin (w / w) solution at pH = 3, with and without 10% sucrose (w / w) increase with temperature. In Figure 19A, G' and G" remain close until approx. 40 °C, and then we can observe a G’ predominance along temperature values. In Figure 19B that characteristic observed in graph A is larger; this means that the gel behavior of the sample outweighs the viscous since the beginning of the experiment and increases with more intensity from 30 °C.
Fu & Rao (2001) conducted rheological studies of pectin gels and sucrose in this same conditions and observed similar behavior. But at higher pectin and sucrose concentrations, it was observed a contrary behavior, i.e, where G 'decreases with increasing temperature.
4. Conclusions
IR spectroscopy and 1H NMR were effective to qualify the DM of the pectin sample. DM was 58% for the sample by 1H, and was characterized as high-methoxyl pectin. By 13C NMR spectroscopy, different groups of known polymers were identified in the chains of pectic polysaccharides obtained.
The molecular peak was determined by GPC as a value of 9.5 x 10⁵ g / mol. Shear measurements, with temperature variations for the pectin solution and pectin with sugar showed the possible formation of stronger interactions between the molecular pectin chains and sucrose around 45 °C. The rheological study of continuous shear of pectin solution showed Newtonian behavior. When in the presence of calcium ions, their behavior was pseudoplastic, showing the formation of electrostatic interactions between pectic chains and calcium ions. We could also observe interactions between pectin and sucrose at low pH = 3, observing an increasing in viscosity values along temperature increasing.
5. Acknowledgments
6. References
Adams, G. G., Imran, S., Wang, S., Mohammad, A., Kok, M. S., Gray, D. A., Channell, G. A., Harding, S. E. (2012). Extraction, isolation and characterisation of oil bodies from pumpkin seeds for therapeutic use. Food
Chemistry, in Press.
Anthon, G. E., Barrett, D. M. (2008). Combined enzymatic and colorimetric method for determining the uronic acid and methylester content of pectin: Application to tomato products. Food Chemistry, 10, 239-247.
Arima, H. K., Rodriguez-Amaya, D. B. (1990). Carotenoid composition and vitamin A value of a squash and a pumpkin from northeastern Brazil.
Archivos Latinoamericanos de Nutrición, 40, 284-292.
Axelos, M. A. V., Thibault. J. F. (1991). The chemistry of low-methoxyl pectin gelation, p. 109–118. In R. H. Walter (ed.), The chemistry and technologyof pectin. Academic Press, San Diego, Calif.
Azero, E. G., Andrade, C. T. (2002). Testing procedures for galactomannan purification. Polymer Testing, 21, 551 - 556.
Benjamin, O., Silcock, P., Leus, M., Everett, D. W. (2012). Multilayer emulsions as delivery systems for controlled release of volatile compounds using pH and salt triggers. Food Hydrocolloids, 27, 109–118.
Blumenkrantz, N., Asboe-Hansen, G. (1973). New methods for quantitative determination of uronic acid. Analytical Biochemistry, 54, 484-489.
Bottger, I. (1990). Pectin application—Some practical problems. In G. O. Phillips, D. J. Wedlock, & P. A. Williams (Eds.), Gums and stabilisers for the food industry, vol. 5 (pp. 247–256). Oxford, UK: IRL Press.
Braccini, I., & Pérez, S. (2001). Molecular basis of Ca2+-induced gelation in alginates and pectins: the egg-box model revisited. Biomacromolecules, 2, 1089–1096.
Catoire, L., Goldberg, R., Pierron, M., Morvan, C., Penhoat, C. H. (1998). An efficient procedure for studying pectin structure which combines limited depolymerization and 13C NMR. European Biophysics Journal, 27 127–136.
Evageliou, V., Richardson, R. K., Morris, E. R. (2000). Effect of pH, sugar type and thermal annealing on high-methoxy pectin gels. Carbohydrate
Polymers, 42, 245-259.
Filipov, M. P., (1992). Practical infrared spectroscopy of pectic substances,
Food Hydrocolloids, 6, 115-118.
Fraeye, I., Doungla, E., Duvetter, T., Moldenaers, P., Loey, A. V., Hendrickx, M. (2009) Influence of intrinsic and extrinsic factors on rheology of pectin– calcium gels. Food Hydrocolloids, 23, 2069–2077.
Fu, J-T., Rao, M. A., (2001). Rheology and structure development during gelation of low-methoxyl pectin gels: the effect of sucrose. Food
Hydrocolloids, 15, 93-100.
Gilchrist, H., Taranath, D. A., Gole, G. A. (2010). Ocular malformation in a newborn secondary to maternal hypovitaminosis A. Journal of AAPOS. 14, 274-276
Guillon, F., Champ, M. (2000). Structural and physical properties of dietary fibres, and consequences of processing on human physiology. Food
Research International, 33, 233-235.
Ha, M., Viëtor, R. J., Jardine, G. D., Apperley, D. C. Jarvis, M. C. (2005). Conformation and mobility of the arabinan and galactan side-chains of pectin. Phytochemistry, 66, 1817–1824.
Harholt, J., Suttangkakul, A., Scheller, H. V. (2010). Biosynthesis of Pectin.
Plant Physiology, 153, 384–395.
Keenan, M. H. J., Belton, P. S., Matthew, J. A., Howson, S. J. (1985). A 13 C-N.M.R. study of sugar-beet pectin. Carbohydrate Research, 138, 168–170. Krall, S. M., McFeeters, R. F. (1998). Pectin Hydrolysis: Effect of temperature,
degree of methylation, pH, and calcium on hydrolysis rates. Journal of
agricultural and food chemistry, 46, 1311-1315.
May, C. D. (1990). Industrial pectins: Sources, production and applications.
Carbohydrate Polymers, 12, 79–99.
Molecular Expression Website. Plant Cell Wall. (2012). Retrieved on May 8th from http://micro.magnet.fsu.edu/cells/plants/cellwall.html