Research Article
How formal education and literacy impact on the content
and structure of semantic categories
Régine Kolinsky
a,b,n, Rosemeire Selma Monteiro-Plantin
c, Elias José Mengarda
d,
Loni Grimm-Cabral
e, Leonor Scliar-Cabral
e,f, José Morais
b aFonds de la Recherche Scientifique—FNRS, BelgiumbUnité de Recherche en Neurosciences Cognitives (UNESCOG), Center for Research in Cognition&Neurosciences (CRCN), Université Libre de Bruxelles (ULB), CP 191, 50 Ave. F. Roosevelt, B-1050 Brussels Belgium
cUniversidade Federal do Ceará, Brazil dUniversidade Federal de Santa Maria, RS, Brazil eUniversidade Federal de Santa Catarina, UFSC, Brazil fConselho Nacional de Pesquisa, CNPq, Brazil
a r t i c l e
i n f o
Article history:
Received 12 November 2013 Received in revised form 31 May 2014
Accepted 22 August 2014
Keywords: Literacy effects Formal education effects Semantic categorization Semanticfluency
a b s t r a c t
We examined the hypothesis that formal education and literacy impact the richness and precision of semantic knowledge but not the organization of semantic categories and basic mechanisms of access to them.
In Experiment 1, adults of varying levels of formal education were presented with semanticfluency tests and a superordinate naming task. Experiment 2 examined the impact of reading proficiency on adults of varying degrees of literacy. They were presented with simple semantic, alternating semantic and phonemicfluency tasks, as well as with literacy-related, reasoning and memory tests.
Fluency was analyzed in terms of overall performance, sequential order and speed of responses. Despite lower performance, illiterates and adults with null or limited formal education displayed taxonomic clustering and retrieval by semantic subcategory, as did participants with higher formal education levels. Yet, formal education and literacy slightly speed up access to categories, probably providing useful cues for generating category exemplars.
&2014 Elsevier GmbH. All rights reserved.
1. Introduction
A key to concept acquisition is the ability to categorize objects, namely, to establish that a perceived entity belongs to a particular group of things that share some important characteristics. Both taxonomic and thematic relations between objects are considered as essential in this process, as both allow drawing inferences, namely, deriving information not explicitly present in an experi-ential object. By treating non-identical entities as if they were the same (e.g., both terriers and Golden Retrievers are dogs), taxonomic relations support inferential generalizations from one entity to another, non-identical, entity (e.g., if terriers are dogs and have a heart, Golden Retrievers, as they are also dogs, also have a heart). Furthermore, thanks to their hierarchical structure and to the
principle of class inclusion, taxonomic categories allow facts known about higher-level concepts to apply to lower ones (e.g., learning that animals have a heart and learning that alligators are animals allows inferring that alligators have a heart). On their side, by providing“conceptual coherence”[28], thematic relations occurring between entities independently of their intrinsic nature (e.g., functional and spatial relations) help to generate expectations about events or scenarios (see also[14,55]). For instance, although a leash is not a kind of animal, the fact that leashes are used on animals may help identifying something on a leash as being an animal[28]. According to recent evidence (e.g.,[29]), functional features might even be privileged in biological kind classification.
Much recent work focused on how expertise and culture modulate the relative use of thematic vs. taxonomic relations (e.g., [3,37]). According to Estes et al.'s review [14], although formal education appears to discourage thematic thinking (e.g.,
[30,60,61]), this relationship may vary across cultures. Western cultures emphasize taxonomies by attending to objects and attributes, whereas East Asian cultures emphasize themes by attending to relations and contexts (e.g.,[43]).
Contents lists available atScienceDirect
journal homepage:www.elsevier.com/locate/tine
Trends in Neuroscience and Education
http://dx.doi.org/10.1016/j.tine.2014.08.001
2211-9493/&2014 Elsevier GmbH. All rights reserved. n
Corresponding author at: Unité de Recherche en Neurosciences Cognitives (UNESCOG), Center for Research in Cognition & Neurosciences (CRCN), Université Libre de Bruxelles (ULB), CP 191, 50 Ave. F. Roosevelt, B-1050 Brussels Belgium. Tel.:þ32 26504230.
Less attention has been paid to the influence of formal educa-tion, including literacy, on the structure of semantic categories and on the mechanisms of access to them. This is probably due to the fact that young, preliterate and/or preschool, children already show a rich organization of semantic knowledge. Indeed, taxo-nomic capacities appear very early in development. Three-year olds understand the logic of class inclusion, for instance thatcar
andbikebelong to the superordinate vehicle[33]. Four-year olds can use both thematic (e.g.,zoo–elephant) and superordinate (e.g.,
animal—elephant) relations as recall cues very efficiently [6], and preliterate six-year olds display an auditory semantic priming effect when primes and targets are either coordinates (e.g.,arm– leg) or hierarchically related (e.g.,fruit—apple)[46]. Furthermore, infive-year olds, categorical relations lead to more false recognitions of a probe in a sentence than the part—whole relationship[32]. Notably, these children are more affected when the probe is a superordinate than when it is a subordinate. This directional effect argues against the interpretation that they simply learned cate-gory names as synonyms (e.g.,Lassie,dogandanimalas alternative names).
Nevertheless, none of these findings disproves a significant impact of formal education and literacy on semantic knowledge. In the present study, we examined the hypothesis according to which semantic representations and processing strategies are qualitatively the same whatever the formal education and literacy level, despite the fact that the richness and precision of knowledge (henceforth, content knowledge) are augmented by increased education and literacy. Under this view, learning in the classroom, and in particular science learning, as well as activities linked to literacy (reading books, magazines, etc.), would thus only impact on content knowledge but not on the structure of semantic categories, including their hierarchical organization, or on the basic mechanisms of access to these categories.
Though seemingly simple, this idea is difficult to examine. In developmental studies, literate children with higher levels of formal education are typically older than children who are preliterate and have received less formal education, leading to confound with neural maturation or other cognitive abilities developing with age (e.g., executive functions, including cognitive
flexibility[22]). Actually, estimating the effect of formal education and literacy requires comparing groups of adults of varying levels of formal education and literacy, including, ideally, adults who are completely illiterate as they have never attended school due to socioeconomic reasons.
Several studies examined such populations in semanticfluency tasks, in which participants are asked to generate words belonging to a specific taxonomic category, for instance animals. This task is widely used in cognitive psychology and neuropsychological assessment because it provides useful information about both retrieval strategies and lexico-semantic networks[42,63]. Indeed, although words are not concepts in any simple sense (e.g.,[31]), sequences of word retrieval (e.g., listing animal names) are taken as reflecting the way entities are represented in conceptual memory, including their hierarchical taxonomic organization.
Among the various measures of fluency performance, the
number of words generated obviously depends on content knowl-edge, and several studies showed indeed that people having no formal education (in all studies, illiterate unschooled adults) provide far less responses than formally educated people in semantic fluency tasks [8,10,17,23,48,50,62] (see [34] for similar results on unschooled vs. age-matched schooled children). Although both the ecological or cultural relevance of the chosen semantic criteria and the level of reference to concrete knowledge and specific situations modulate performance [17,51,57,56], an impact of formal education has been reported even in an ecologically relevant, concrete version of the task[62], when participants were
asked to name things or food items that can be bought at the supermarket. Other measures that depend on content knowledge also vary with level of education. This is the case for instance of the number of subcategories generated for animals, e.g., pets, insects, birds,fishes, reptiles, etc. [8,17]. In addition to these quantitative differences, some qualitative differences may be expected, as different levels of education are associated with different social-cultural backgrounds. This may affect typicality responses, reflected influency tasks by the ordering of members within categories, with more typical members namedfirst[21,53]. In children, it has been shown that socioeconomic status and associated specific experi-ences influence typicality responses, at least with categories that are related to exposure to formal contexts, such as animals [74]. Similarly, illiterate adults do not mention the same prototypical animal as participants with higher levels of education[8].
Whether formal education and literacy also impact on the very structure and mechanisms of access to semantic categories has seldom been explored and seems to depend on the aspects of performance examined in fluency tasks. When participants are asked to freely generate a list of words corresponding to a given taxonomic category, e.g., animals, they tend to produce these words in clusters, namely in groups of words belonging to the same subcategory, like pets, insects, birds, water animals, etc.
[7,18]. Thisclustering component involved influency reflects the search in memory for relevant subcategories. It is dissociable from another aspect of performance, calledswitching, which has been defined as the ability to search intentionally for new subcategories and switch effectively from one subcategory to another once a subcategory is exhausted[69]. This requires specific cognitive control processes indicative of flexibility and identified asshifting[39], and hence is linked to executive processes[69,70]. For formally educated individuals, switching and clustering would contribute equally to performance in semanticfluency, and would be independent of each other[67,69].
Up to now, the data on the influence of formal education and literacy on these two components of fluency performance are scarce and somewhat abstruse. Clustering may be estimated through several measures. Among them, cluster size (i.e., the number of consecutively generated words belonging to the same semantic sub-category) would measure the ability to produce related words within a given semantic subcategory [69]. This measure has been reported to be similar in illiterate and literate (schooled) adults[17,23], despite the fact that overall performance was augmented by increased education (see also[24]). Results are less clear as regards the number of clusters, which was observed to vary with formal education level in some studies [17]but not in others[8], and the number of isolated words, which in one study[17]
was reported as being higher in literates compared to illiterates. As regards the number of switches between subcategories, it seems to be lower in illiterates than in literates[8,17,24], although the effect of formal education on this measure may vary as a function of category, being for instance stronger for animals than for fruits[56]. However, the impact of formal education and literacy on executive processes, in particular on shifting, remains unclear, as it has not always been observed[40].
In addition, there is a debate on which measures are more appropriate to examine the clustering and switching components. Two main types of methodological problems have been identified. Thefirst one is that some of the measures strongly depend on total output. This is the case for instance of switching[13], traditionally calculated as the number of transitions between clusters. To avoid this problem, Tröster et al.[66]proposed to calculate the propor-tion of switches, i.e., the number of switches adjusted on total output. Yet, the significance and usefulness of this measure has been questioned (e.g.. [66,68]), including because it can lead to
this has rarely been debated, a similar problem arises with all other measures correlated with total output. In fact, for such measures, it would be more appropriate to statistically control for total output by computing partial correlations (or run covar-iance analyses)[1].
Second, as a consequence of the timed nature of thefluency task, switching and clustering are mutually exclusive[1]and hence their measures are negatively correlated with each other (e.g.,[69]). Thus, as commented on by Abwender et al.[1, p. 326–327], switching might actually“reflect nothing more than the absence of the ability to cluster (i.e., extremely restricted access to semantic subcate-gories), especially if the switch occurs between two nonclustered words”. This is a problem in several studies, including with illiterates adults [8,17], in which the number of switches was calculated based on the total number of transitions between clusters, including single words. According to Abwender et al., only
cluster switches (CS), namely the transitions between adjacent clusters defined in their study as including at least two words (and not hard switches, i.e., the transitions between clusters and single-word responses or between two single-word responses) would reflect executive processes, in particular mentalflexibility.
In addition to these methodological problems linked to the scoring procedure, other researchers have a different view on how semantic processes and executive control affect semanticfluency. For instance, Mayr and Kliegl [36] suggested that the time for every act of retrieval contains two additive components: one executive and the other semantic in nature. The executive compo-nent reflects aspects like updating the current search criterion and stopping or initiating single retrieval processes. It is assumed to be relatively constant, no matter whether it occurs within vs. between clusters, or early vs. late in the recall sequence. In contrast, the semantic component reflects the actual semantic search demands, including relatively automatic spreading activa-tion in the semantic network. By this view, between-cluster retrieval should simply require more of the same semantic processing than within-cluster retrieval.
Irrespective of which model will ultimately prove correct, a better way to examine semantic processing would thus be to consider also time measures (see also [35]). For instance, the number of switches not only depends on the difficulty with accessing a new semantic cluster, but is also reduced in case of difficulties to come up with new words within clusters: the more time spent for retrieval within a cluster, the less time remains for accessing new clusters. Hence, a group difference in number of switches could imply that what is prolonged is either the duration of each switch or the duration of each retrieval (no matter whether it occurs within or between clusters). It would thus be interesting to compare the retrieval times for the words generated within a cluster with the retrieval times between clusters. Criti-cally, in formally educated people, the former are shorter than the latter, reflecting retrieval by subcategory (e.g.,[18,22]; see reviews in [36,75]). Yet, a more pronounced switching time cost might reflect specific difficulties linked to executive processes.
In addition, computing the retrieval-position function, namely the interword retrieval time as a function of the position of a word within the recall sequence (independently of the fact that it is an intra- or inter-category response), may provide a relatively pure estimate of semantic difficulty. In particular, the slope of the search function may be an indicator of semantic processing efficiency [36], as there is a very well-known reduction in the production rate as a function of time[7](for a review, see[75]), which is observed in all education groups, even in illiterate adults [8]. According to Mayr and Kliegl [36], demands on semantic processing proper would increase as a function of recall position, whereas demands on executive processes should stay relatively constant across recall positions.
Furthermore, it may be useful to also distinguishtask-consistent
andtask-discrepantclustering. Indeed, many studies have shown that two types of clusters, phonemic and semantic, are found in semanticfluency (e.g.,[26,47]). Abwender et al. [1]argued that task-discrepant clustering (phonemic clustering on semanticfl u-ency), even if less frequent, reflects a more deliberate strategy than task-consistent clustering (semantic clustering on semantic fl u-ency), which could reflect a more passive access to words through automatic activation of nearby concepts (i.e., by spreading activa-tion). Examining both clustering types would be particularly interesting as regards the potential impact of literacy, which is known to be tightly linked to the development of the explicit representations of speech[41] that probably subtend phonemic clustering. This is suggested by the fact that the effect of education and associated literacy level on overall performance is much stronger in phonemic compared to semantic fluency [23,48], namely when participants have to produce words beginning with a given letter or phoneme (e.g.,[1,64]).
Finally, other specific components may be important for retrieval in addition to activation spreading from the cue to related items and self-generation of category cues (e.g., phonemic cues) to access new items. In particular, working memory would be important not only to access new items but also to monitor the products of retrieval (i.e., generated items) and suppress pre-viously recalled items, which is essential to prevent errors, especially repetitions[54,71]. Examining the monitoring compo-nent through the estimation of repetition errors has rarely been done in studies examining the effect of formal education. Yet, one study observed no significant difference in number of repetitions between illiterate and literate adults[17].
In the present study, we examined these various components of semanticfluency performance in two experiments that included participants with no or limited formal education. Both experi-ments were run in Brazil, in which low levels of formal education still characterize an important part of the population.1 Hence, importantly, it was only for social reasons that these participants either had never attended school or had attended school for only a few years. None of them had a history of special difficulty other than lack of access to schools or need to work early in life, and all, including illiterates, were fully socially functional and, except for some housewives, had regular employment.
In Experiment 1, we contrasted two groups of participants that differed by their level of formal education. In one of the groups, participants had no or limited formal education, namely they were either entirely unschooled (and illiterate) or minimally schooled, with up to four years of formal education (henceforth, –FE
participants); in the other, participants had between 11 and 14 years of formal education, hence all had completed the second level of secondary school (henceforth,þFEparticipants). The two
groups were presented withfive tests of semanticfluency (ani-mals, working tools, furniture, domestic utensils, and vehicles) as well as with asuperordinate namingtask that may be considered as a mirrored situation of the semanticfluency task. Indeed, in the latter, participants had to provide a superordinate name (e.g., to answerfurniture) for three orally presented coordinate words (e.g.,
sofa–table–cupboard). This allowed us to further test the hypoth-esis that people with no or limited formal education lack detailed and precise taxonomic knowledge and/or associated verbal labels. Experiment 2 was aimed at addressing an additional metho-dological difficulty, which is to isolate the specific contribution of reading proficiency to semantic knowledge and/or processes.
1For example, Yassuda et al.[76]mention a national survey reported in a
Indeed, all the studies having examined the impact of formal education and literacy in this field have contrasted illiterate, unschooled people to formally educated, literate people, thereby confounding formal education and literacy level. Yet, literacy per se may impact semantic knowledge; for instance, it has been suggested that, in children, greater semantic knowledge leads to better reading comprehension, and vice versa[4]. In Experiment 2, we examined the relation between reading proficiency and the various facets of semanticfluency on a fresh group of participants who had never or almost never attended school in childhood but presented varying degrees of rudimentary reading decoding, as most of them were attending thefirst class in a literacy program for adults. Through various literacy-related measures, these parti-cipants were carefully evaluated as regards their literacy level, and were presented with two semanticfluency tasks. Thefirst was an animalfluency task similar to the one of Experiment 1. The second was an alternating fluency task, in which participants had to produce in alternation the name of a fruit and the name of a tool. The latter task allowed further investigating the impact of literacy on the switching component offluency performance. In addition, the participants of Experiment 2 were presented with a phonemic
fluency task, in which performance is supposed to be strongly linked to literacy[23,48]. They were also presented with several tasks aimed at assessing reasoning and memory, especially work-ing memory, which has been argued to be important for verbal
fluency performance (e.g.,[54,71]).
2. Experiment 1: comparing adults of various levels of formal education
In this experiment, we presented –FE and þFE participants
with semantic fluency tests as well as with a superordinate naming task. In five semantic fluency tests, participants were asked to produce namesfirst of animals, next of working tools, next of furniture, next of domestic utensils, andfinally of vehicles. For the animal category (which elicited the greatest number of responses and demonstrated to be the category with the least membership ambiguity), in addition to the total number of words generated, we also examined the clustering and switching components.
According to our hypothesis, we expected–FE participants to differ from þFE ones for all measures that depend on content
knowledge. In thefluency task, we thus expected–FE to present a lower number of words produced per category and a lower number of subcategories compared to þFE. We also expected
the two groups to present different typicality patterns. In the superordinate naming task, we expected –FE participants to produce a lower proportion of near superordinate responses, namely of responses asbirdsto the tripletcanary–parrot–swallow, which are less generic thandistant superordinateresponses such as
animalsto the same triplet. On the contrary, we expected–FE not to differ strongly from þFE participants as regards both the
mechanisms of access to taxonomic knowledge and the hierarch-ical organization of semantic categories. In particular, we expected them to also display a hierarchical organization of semantic categories and hence semantic clusters of similar size as þFE
participants, and to present shorter interword time intervals (henceforth,interword times) for consecutive responses belonging to the same subcategory (e.g., between two exemplars of birds) than for consecutive responses belonging to different subcate-gories (e.g., between an exemplar of a bird and an exemplar of a
fish). Although this would reflect retrieval by subcategory in both groups, we expected these to differ as regards other, more strategic cues that can be used to access new exemplars, in
particular grapho-phonological cues that allow phonemic
clustering. As regards switching, predictions were less clear, as the impact of formal education and literacy on executive pro-cesses, in particular on shifting, remains uncertain and has not always been observed[40].
2.1. Method
2.1.1. Participants
The whole sample included 31 adults living in three different cities of the Southern part of Brazil (Palhoça and Florianópolis, in the State of Santa Catarina, and Maringá, in the State of Paraná) who were assigned to two groups, according to their level of formal education. All were Brazilian natives except for one who had arrived in Brazil at two years of age; all spoke only Brazilian Portuguese.
Among the 13–FE participants (7 women from 25 to 59 years; mean age 40.3 years), seven were totally illiterate and almost unschooled. None of these illiterates could name a single letter. Three had never attended school in childhood, and four had attended school only for some months and in an irregular way. The six other participants had attended elementary school in childhood for one up to four years (on average, 3 years). We will refer to them assemi-literates, as they only learned to read up to a very rudimentary level, and their decoding ability was slow and sometimes inaccurate. As a matter of fact, presented with a list of 22 pseudo-words, none of them could read accurately more than 15 (68%). These–FE participants had no or limited formal educa-tion for social reasons, with no history of special difficulty other than lack of access to schools or need to work early in life. All of them, including the fully illiterates, were fully socially functional and, except for four housewives (2 illiterates, 2 semi-literates), were working as workmen, servants, hairdresser, cook, night guard, or concierge. At the time of testing, nine participants of this group (three illiterates, all semi-literates) were beginning to attend special literacy classes for adults.
The 18þFE participants (4 women; from 24 to 60 years; mean
age: 38.5 years; no significant age difference with –FE partici-pants: Mann–WhitneyU¼106.5,p40.10) had between 11 years
and 14 years of formal education, hence had at least completed the second level of secondary school; nine had completed the third (and last) grade of undergraduate course and were attending a college at the time of testing. Except for one retired participant and one housewife, all were working in administrative jobs, or as teachers, drivers or nurses.
2.1.2. Materials, procedure and scoring
2.1.2.1. Semantic fluency. The experimenter, using a chronometer, asked participants to produce for two minutes as many words as possible, without repetition, corresponding to instances of a specific
taxonomic category that was presented orally through its
superordinate name. Participants werefirst asked to produce names of animals, next of working tools, next of furniture, next of domestic utensils, andfinally of vehicles. The participant was stopped after two minutes. The whole session was recorded for further data analysis.
Each participant's performance was classified and analyzed as follows:
Total correct output: the total number of correct words gener-ated per taxonomic category (animals, working tools, furniture, domestic utensils, vehicles), excluding errors and repetitions.
for a given item, for the 13 and 18 –FE and þFE participants,
respectively, if all the participants mentioned this item in thefirst place).
The other measures were only calculated for the animal
fluency test.
Number of subcategories: following the suggestion of other researchers (e.g., [52,69]), the semantic subcategories produced were empirically defined based on the words generated by the participants, as pets or farm mammals, wild mammals, birds, reptiles and batrachians, fishes and crustaceans, and insects, arachnids and worms.
Number of semantic clusters: to be sure that a clustering strategy was used, as suggested by Robert et al.[52]and as done in former work on participants with low levels of formal education
[8,17,23,56], we only considered clusters of three or more con-secutive words belonging to the same semantic subcategory. In doing this, we excluded names of a subcategory for which the participant had already generated a word (e.g.,birdaftercanary) and intra-cluster repetitions (e.g., the sequence jaguar–monkey– Jaguar was not considered as a cluster). However, inter-cluster repetitions were taken into account (e.g., the sequence spider– mosquito–cockroach–canary–eagle–toucan–cricket–mosquito–butterfly
would be considered as including three clusters, althoughmosquito
was repeated across two clusters).
Mean cluster size:for each identified cluster (of at least three words), we counted the number of words, excluding names of a subcategory for which the participant had already generated a word and intra- (but not inter-) cluster repetitions.
Number of isolated words: the number of words of a specific semantic subcategory, not preceded nor followed by a word from the same subcategory.
Number of category switches: the number of switches was determined by the number of times the subject moved from one semantic subcategory to another, including with single words.
Number of cluster switches: number of switches from a (at least three word) cluster to another (at least three word) cluster.
Number of repetitions: any identical or variations of a previously given (and otherwise correct) word (e.g.,gato–gatinho, meaning cat, little cat).
Number of grapho-phonological clustered responses: number of responses in which at least two successive words either began with the same phoneme(s) or letter(s), or rhymed.
Timing measures: the recordedfiles were digitalized and then analyzed for timing measures usingAudacity2.0.0 software. We
first checked whether the reduction in the production rate as a function of time was independent of formal education level (as reported by[8]). To this aim we computed the number of words produced within three time slots: less than 30 s, between 30 s and one minute, and within the last minute. We then made two analyzes on interword times, namely on the time intervals between each pair of consecutive words (in seconds and hun-dredths). For technical reasons, the timing data of thefirst answers from one þFE participant were missing.
2.1.2.2. Superordinate naming. Each of the 40 trials consisted of three orally presented coordinate words (e.g., train–plane–boat;
canary–parrot–swallow), and the participants were asked to tell what they had in common, or what they all were, providing only one name common to the three items. The considered near superordinate categories were: furniture, household-electric, means of transportation, combustibles, vegetables, alcoholic drinks, medias, smoke, TV actors, popular dances, metals, toys, colors, professions,flowers, cloth accessories, body parts, candies, relatives, snakes, birds, fishes, mammals, cities, countries, candidates for president, weapons, writers, condiments, insects,
cereals, planets, jewels, fruits, sports, games, disciplines, writing accessories.
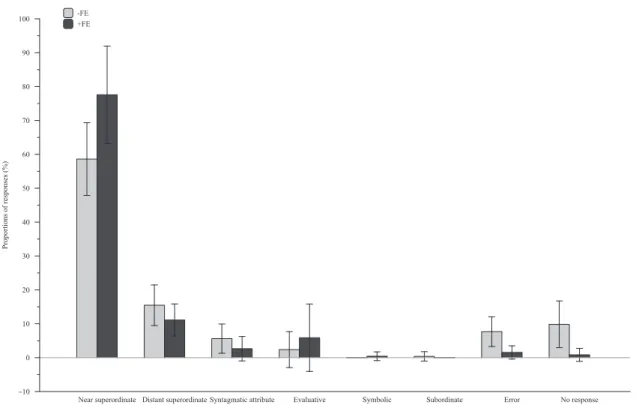
The participants' performance was tape-recorded and then analyzed byfive naïve judges. They categorized all participants' responses according to eight response categories: in addition to no response and clear error, the judges were asked to consider asnear superordinate answers like birds to the triplet canary–parrot– swallow; asdistant superordinateanswers likeanimalto the same triplet, i.e., when the participant used a more generic, higher hierarchical label; as evaluative answers like something that destroys peopleto the triplet cigarette–cigar–pipe; as syntagmatic attribute answers like useful for listening to the triplet radio– television–telephone; as subordinate answers like handle to the triplet sword–knife–pistol, as handle is a constituent part of the three referents; and assymbolicanswers likedeathto the triplet
sword–knife–pistol. A response was considered as belonging to one of these categories when the majority of the judges had classified it as such. When no majority was reached, a sixth, this time non-naïve judge (one of the co-authors) chose between the most frequent categories proposed for that response by the other judges.
2.2. Results
2.2.1. Semanticfluency
We first examined the total correct output per taxonomic category and per group. A repeated-measures analysis of variance (ANOVA) by participants run on these scores showed significant effects of category,2 F(4, 116)¼27.50,
ηp2¼0.49, and group,
F(1, 29)¼30.65,ηp2¼0.51, bothpso0.0001. As displayed inFig. 1,
animals led to more responses than all other categories, all
p'sr0.01; domestic utensils led to more responses than furniture
and vehicles, psr0.005, and working tools to more responses
than vehicles,po0.001 (all Bonferroni-corrected). The significant
group by category interaction,F(4, 116)¼3.18,po0.025,ηp2¼0.10,
reflects the fact that as responses for animals were particularly numerous in the þFE participants, groups differed somewhat
more for this category than for the others.3Still,
–FE participants offered less responses than þFE ones for all categories, all
psr0.005.4 Finally, among the –FE participants, illiterates did
not differ from semi-literates, with averages of 12.97 and 12.03 items provided, respectively.
We then compared the groups for typicality patterns. AsTable 1
illustrates, there were group-dependent patterns of typicality. For example,horseanddogwere the most typical animals for the–FE participants, who also mentionedcow in good position; in con-trast,catwas more typical for the þFE participants, who never
mentioned cow. For working tools, only the –FE participants answeredhoe, and for vehicles, only the þFE participants
men-tioned plane and boat, whereastruck and bus (work and travel vehicles that are important for people of less advantaged classes) were mentioned in good position only by the–FE participants. After thefirst three responses for each category, some participants also gave responses indicating potential overlap between cate-gories. This was the case, for example, of the attribution oftableto both furniture and utensil by the –FE participants; category
2The category effect was also significant in the non-parametric Friedman
ANOVA run on these data,χ2(4)¼66.28,po0.0001.
3Although there was no significant correlation between correct output and age (allrso0.21,p40.10), we checked that similar results were obtained when using age as covariate.
overlapping occurred also forknife,freezer,stoveandTV set, as well as fortrailerbetween working tools and vehicles.
Given that animals not only elicited the larger number of responses but were also the category that presented the least membership ambiguity and the clearest internal structure, it is only for this category that we performed further analyses.Table 2
presents the average scores, Mann–WhitneyUtests, as well as the effect sizes and 95% confidence intervals of the differences between the means.5 Signi
ficant increases with level of formal education are observed for the total correct output, number of subcategories and number of clusters, and trends toward signifi -cance are observed for number of isolated words, number of between-categories switches, number of cluster switches, and number of grapho-phonologically related words (note that none of these measures differed between illiterates and semi-literates, allps40.10). Thus,–FE participants did not only present a poorer
total correct output thanþFE participants, but also produced less
subcategories, less clustered words and less isolated words, as well as less (cluster) switches and phonologically related words. Although there was a numerical trend (and a non-negligible CL effect size, seeTable 2) for–FE participants to produce less words per cluster, groups did not differ strongly on mean cluster size (neither did illiterates vs. semiliterates, p40.10). Interestingly,
cluster size only tended to be correlated with total correct output,
r(29)¼0.32, po0.10, indicating that this measure of taxonomic
clustering is relatively independent of content knowledge.
No significant correlation between total correct output and number of repetitions was observed, either, r(29)¼0.29, p40.10. On the
contrary, there were significant correlations between total correct output and the six measures for which a group effect was observed, namely number of subcategories,r(29)¼0.68,po0.0001, of clusters,
r(29)¼0.80, p.0001, of isolated words r(29)¼0.38, po0.05, of
between-categories switches r(29)¼0.78, po0.0001, of cluster
switches, r(29)¼0.49,po0.005, and of phonologically related words,
r(29)¼0.63,po0.0001. When statistically controlling for total output
by introducing this score as covariate, no significant group difference was observed anymore on these six measures, allF'sr1.
Hence, the main difference between–FE and þFE participants
resides essentially in total output. As illustrated in Fig. 2a, this difference was particularly strong for the responses given within thefirst 30 s, which were particularly numerous in þFE
partici-pants. The ANOVA on correct output contrasting groups as a function of time slot (within the first 30 s, between 30 s and one minute, and within the last minute) showed significant effects of group, F(1, 29)¼28.81, po0.0001, ηp2¼0.50, and time slot,
F(2, 58)¼42.49,po0.0001,ηp2¼0.59, as well as a significant
interac-tion between group and time slot,F(2, 58)¼5.0,po0.01,ηp2¼0.15.6
Bonferroni-corrected contrasts showed that the –FE participants presented fewer responses than the þFE participants in all time
slots (allp'so0.05).7
-FE +FE Animals
Tools Domestic utensils Furniture Vehicles
total number of (correct) items provided within 2 min
0 5 10 15 20 25 30 35 40 45
Fig. 1.Average total correct output (i.e., number of correct items provided in two minutes) in thefive semanticfluency tests of Experiment 1, separately for each group (–FE: participants with null or limited formal education andþFE: partici-pants with higher levels of formal education). Error bars correspond to standard deviations.
Table 1
Experiment 1, semanticfluency task: items with the highest typicality score (3 or more if equality between 2) for each category and each group (–FE: participants with null or limited formal education; þFE: participants with higher levels of
formal education).
–FE þFE
Animals
Horse 0.41a 0.39
Dog 0.41a 0.41
Cow 0.26 0
Cat 0.21 0.46a
Tools
Hoe 0.33a 0
Hammer 0.23 0.30a
Knife 0.15 0.19
Saw 0 0.15
Furniture
Sofa 0.51a
0.44
Chair 0.38 0.63a
Bed 0.18 0.19
Table 0.15 0.22
Domestic utensils
Pot 0.36a
0.09
Spoon 0.26 0.11
Table 0.15 0
Glass 0 0.15a
Broom 0 0.11
Vehicles
Car 0.67a
0.35a
Bicycle 0.18 0.17
Truck 0.18 0
Motor bike 0.15 0
Bus 0.15 0
Plane 0 0.31
Boat 0 0.25
Note: Bold scores represent the three most typical items. aRepresents the most typical one.
5As recommended by Lakens[27], to estimate effect sizes we used Hedges'g, which is similar to Cohen'sd, but less biased with small samples.
6The results were similar when age was introduced as covariate. 7Consistently, Mann
The analysis ran on interword times suggest in addition that content knowledge is more rapidly exhausted in–FE than in þFE
participants. Indeed, as shown in Fig. 2b, when interword times were analyzed as a function of retrieval position (as in[36], i.e., independently of the fact that responses were intra- or inter-category), the slope of the retrieval-position function estimated for thefirst 16 positions is steeper in–FE than inþFE participants As
the 16th position corresponds to the average number of answers given by the–FE participants, whereas it is only about half of the average number of responses provided by the þFE participants,
for –FE participants search for new exemplars would become sooner more difficult and hence slower in the retrieval-position function, compared toþFE participants. The results of a reanalysis
of the data using relative scores are coherent with this interpreta-tion. In this reanalysis, we calculated for each participant indivi-dually his/her interword times for his/herfirst, second and third thirds of the responses (i.e., on thefirst three, middle three and last three items for a participant who gave only 10 answers, hence for whom nine time intervals were calculated, but on thefirst 10, middle 10 and last 10 items for a participant who provided a total of 31 responses). As Fig. 2c illustrates, no slope difference is observed anymore. This was confirmed by an ANOVA with group and retrieval position (first, middle or last third of the response positions, as defined individually) as factors: only the main effects of group, F(1, 28)¼5.77, po0.025, ηp2¼0.17, and of retrieval
position,F(2, 56)¼27.18,po0.001,ηp2¼0.49, were significant, not
the interaction between these two factors,Fo1,ηp2¼0.01.8
However, as illustrated in Figs. 2b and c, –FE participants presented somewhat longer interword times than þFE
partici-pants overall (M¼4.12 s, SD¼2.29, and M¼2.75 s, SD¼1.10,
respectively). Yet, the difference between groups was not signifi -cant, Mann–WhitneyU¼170,p40.10. This is probably due to the
fact that–FE participants also tended to stop answering slightly before the þFE participants (total average production time:
M¼1 min and 41 s, SD¼32.3 s, and M¼1 min and 52 s,
SD¼15.74, respectively). Yet, this effect was not significant, either,
Mann–WhitneyU¼103.5, p40.10. In fact, –FE participants were
quite variable, some stopping answering before 30 s, and others going until the end of the allowed time slot.
Critically, interword times were also calculated separately for intra- and inter-subcategory consecutive pairs of responses. Since according to the Wilcoxon matched pairs test there was no difference between cluster switches and hard switches,Z¼0.23,
p40.10, we contrasted all inter-categories responses to
intra-subcategory responses in an ANOVA taking group and interval type (inter- vs. intra-subcategory) as factors. There were signifi -cant main effects of group,F(1, 29)¼5.59,p¼0.025,ηp2¼0.16, and
of interval type,F(1, 29)¼52.18, po0.0001,ηp2¼0.64,with longer
interword times in–FE than þFE participants, and for inter- than
intra subcategory responses (on the average, 5.15 vs. 1.92 s, respectively9). However, as illustrated inFig. 2d, the interaction between these variables was not significant, F(1, 29)¼2.10,
p40.10,ηp2¼0.03.10
2.2.2. Superordinate naming
As displayed in Fig. 3, –FE participants presented a lower proportion of near superordinate responses thanþFE participants,
Mann–WhitneyU¼27,po0.0025,11 (with almost no difference
between illiterates and semi-literates: 58.03% vs. 59.29%, respectively).
Table 2
Experiment 1, animalfluency task: average scores per group (–FE: participants with null or limited formal education;þFE: participants with higher levels of formal education). Standard deviations and confidence intervals (CI) in brackets.
–FE þFE Mann–Whitney (U) Hedges'ga CIb CL effect sizec
Total correct output 16.69 31.94 17nn
1.90 [ 20.78, 9.72] 92%
[6.38] [8.67]
Number of subcategories 3.92 5.11 52n
1.06 [ 2.01, 0.37] 78%
[1.11] [1.08]
Number of clustersd 3 4.72 46.5n
1.15 [ 2.80, 0.65] 80%
[1.41] [1.49]
Mean cluster sized 3.68 4.36 89 0.57 [ 1.58, 0.22] 65%
[1.33] [1.02]
Number of isolated words 3.77 6.72 73.5(n) 0.74 [ 5.48, 0.42] 72%
[1.64] [4.88]
Total number of between-subcategory switches 6.77 14.06 24.5nn
1.52 [ 10.35, 4.23] 88%
[2.17] [5.82]
Number of cluster switchesd 0.77 1.5 73.5(n) 0.65 [ 1.53, 0.07] 68%
[1.01] [1.15]
Number of repetitions 1.62 2.50 87.5 0.45 [ 2.24, 0.48] 63%
[1.56] [2.15]
Number of grapho-phonological related words 2.46 4.28 71(n) 0.58 [ 3.92, 0.28] 67%
[2.11] [3.58]
aCalculated thanks to Lakens[27].
b95% confidence interval of the difference between the means [low and high]; calculated thanks to Lakens[27].
cCommon language effect size, also known as the probability of superiority[27]; it reflects the chance that for a randomly selected pair of individuals, the measure is higher forþFE than for–FE; calculated thanks to Lakens[27].
dWith clusters of at least three words of the same semantic subcategory. (n)po0.10.
n po0.025. nn
po0.01.
8The results were similar when age was introduced as covariate. In addition, the difference between groups was not significant in the Mann–WhitneyUtest ran on the difference between thefirst and last third of retrieval positions,U¼101, p40.10, which corresponds to the group by retrieval position interaction in the ANOVA.
9This difference was also significant according to the Wilcoxon matched pairs
test,Z¼4.89,po0.0001.
10The results were similar when age was introduced as covariate. In addition, the difference between groups was not significant in the Mann–WhitneyUtest ran on the difference between inter- and intra-category times,U¼152,p40.10, which corresponds to the group by interval type interaction in the ANOVA.
11A parametric analysis with age as covariate led to a similar result, with a
-FE +FE
Number of correct responses
0 2 4 6 8 10 12 14 16 18 20 22 24
> 1 min
-FE +FE
0.53921 + 0.37838x (-0.11911) + 0.15394x
interword time (s)
0 1 2 3 4 5 6 7 8 9 10 11 12
retrieval position
2 4 6 8 10 12 14 16
Retrieval position -FE
+FE
interword time (s)
1 0 1 2 3 4 5 6 7 8 9 10 11 12 13 14
Last third
-FE +FE
interword time (s)
0 1 2 3 4 5 6 7 8 9 10
First third Middle third intra-subcategory inter-subcategory
< 30 s 30 s - 1 min
Qualitative analysis of the–FE participants' wrong answers or absence of response showed that they did not know the near superordinate name or concept. For example, none of the–FE but 89% of theþFE participants were able to say thatcopper,iron, and
zincare metals. This was probably due, in most–FE participants, to either a lack of knowledge of the namemetalor to difficulties in rapidly accessing to it. In contrast, the fact that, for example, only half of the þFE participants (no illiterate and 17% of the
semi-literates) were able to say that bat, dolphin and whale are mammals was more likely due to either a difficulty of access to the mammal category given the low typicality of those instances, or to a taxonomic confounding of any of these concepts with the bird orfish categories (e.g., commenting on thedolphinandwhale
stimuli, an illiterate said that they wereocean fishes, of course). Lack of knowledge of the instances rather than of the category may have been at the origin of the fact that only 57% of the illiterates, 67% of the semi-literates, but 89% of the þFE
partici-pants were able to say that Goiânia,Palmasand Natal are three Brazilian cities.
We next calculated the correlations between the proportion of subordinate responses in the superordinate naming task and each of the measures we had calculated in the animal fluency test. Notably, no correlation was significant (allp's40.10), except with
total correct output,r(29)¼0.43,po0.025. Also, interestingly, the
correlation with correct output in the other fluency tests was significant for furniture and vehicles,r(29)¼0.54 and 0.52,
respec-tively, both p'so0.01, but only tended towards significance for
domestic utensils,r(29)¼0.31,po0.10, and was not significant for
working toolsr(29)¼0.28,p40.10.
2.3. Discussion
The results of the present experiment confirm the hypothesis that formal education mainly impacts on content knowledge. In the fluency task,–FE participants produced less correct total output, less subcategories, less clustered words and less isolated words, as well as less (cluster) switches and phonologically related
words than þFE participants. Consistently, in the superordinate
naming task,–FE participants presented less near superordinate responses than þFE participants, which reveals lack of detailed
and precise content knowledge, in particular at the lexical level. Furthermore, the typicality patterns observed in the various
fluency tests also differed between –FE and þFE participants,
reflecting different experiences. This is consistent with the obser-vations made by Brucki and Rocha[8], who also reported that the illiterate unschooled people they examined did not mention the same prototypical animal as the other groups. In particular, as in the present animalfluency test, they frequently mentioned the horse, while the most educated participants of their study men-tioned frequently the cat.
Yet, in the animalfluency test the two groups of participants did not differ on cluster size, and the group differences observed on the six measures other than total output were canceled once correcting for individual differences in total correct output through covariate analyzes. In addition, in animal fluency, although–FE participants tended to be slower to provide their answers, with somewhat longer interword times thanþFE
parti-cipants, they were so overall, for both intra- and inter-category responses. This suggests that for–FE participants both the dura-tion of each switch and the duradura-tion of each retrieval were prolonged. Importantly, they presented shorter intra- than inter-subcategory responses, as did theþFE participants. This confirms
retrieval by subcategory in both groups. Thus, independently of content knowledge, neither taxonomic clustering, nor the basic mechanisms of access to subcategories seem to depend on formal education level. In addition, although the analysis on interword time intervals as a function of retrieval position suggests a more rapid exhaustion of content knowledge in–FE compared to þFE
participants, no special intrinsic difficulty of –FE participants in accessing semantic information is observed when retrieval posi-tions are defined relatively, as a function of total correct output.
Nevertheless, which factor of formal education is responsible for the effects observed on content knowledge remains unclear from the present data. Indeed, in the present experiment literacy
-FE +FE
Proportions of responses (%)
10 0 10 20 30 40 50 60 70 80 90 100
Near superordinate Distant superordinate Syntagmatic attribute Evaluative Symbolic Subordinate Error No response
was confounded with formal education, in terms of schooling years. In addition, although no clear difference between illiterates and semi-literates was observed, we must acknowledge that these subgroups only included seven and six participants, respectively. Hence, no definite conclusion can be drawn as regards the possible specific impact of literacy on the various measures of fluency. Experiment 2 was aimed at examining this question more thoroughly.
3. Experiment 2: Semanticfluency and literacy
To examine specifically the relation between reading profi -ciency and semanticfluency, here we examined participants who were all almost unschooled but quite heterogeneous as regards their literacy level, which was carefully evaluated through various reading-related measures. More precisely, we examined 28 unschooled adults displaying varying degrees of rudimentary reading decoding, most of them attending the first class of a literacy program for adults.
They were presented with two different tests of semantic
fluency. The first was an animal fluency task similar to that of Experiment 1. The second was an alternatingfluency task in which participants had to produce in alternation the name of a fruit and the name of a tool. Thus, the latter task imposes comparable
demands upon semantic memory as a simple semantic fluency
task (for both, participants are requested tofind words belonging to a specified semantic category), and is equally constrained by speed (here, one minute for each test), but requires constant switching between concepts, which probably involves greater executive demands compared to conventionalfluency tasks (e.g.,
[12,19,20,36,67]). It thus allowed us to further investigate the impact of literacy on the switching component offluency perfor-mance. Furthermore, we used as a control two tests of phonemic
fluency, in which participants were required to give words begin-ning with a given letter or phoneme. Indeed, the effect of education on overall performance is much stronger in phonemic compared to semanticfluency [23,48], probably because phone-mic fluency involves phonological awareness, which is strongly linked to reading ability[41].
In addition to thesefluency tasks, reading-related abilities were evaluated through identification of letter and graphemes, reading tests (word and pseudoword reading, plus written text compre-hension), and metaphonological tests that required manipulating either syllables (inversion and deletion tests) or phonemes (inver-sion and deletion tests, plus production of acronyms). Using the
Standard Progressive Matrices(PM38[49]), participants were also evaluated as regards their analogical reasoning capacity. Finally, as working memory seems important for verbalfluency performance due to the need to self-generate category cues and monitor the products of retrieval[54,71], we also presented them with two memory tests. The critical one was listening span, a working memory test in which participants have to listen to a series of sentences and retain thefinal word of each sentence for spoken recall at the end of the series while simultaneously judging each sentence as true or false [65]. An additional test of word span
controlled for phonological memory.
3.1. Method
3.1.1. Participants
Among the 28 participants, 22 were attending thefirst class of a literacy course for adults in the quarter of Capoeiras, Florianó-polis, Santa Catarina, Brazil. The other six were living in the same area. They were aged from 17 to 77 years (average: 37.5 years; 15 women). Most of them (15) had never attended school; some had
attended school for some months (5 participants) or even a year (6 participants) or more (18 months: 2 participants), but in an irregular way (average: 4.7 months). They were rewarded for participation by receiving school material.
All participants were screened for reading-related knowledge through the following 10 tests [59]: letter identification (23 letters), grapheme identification (21 graphemes such as ã, im,
lha), word reading (20 trials, all with simple frequent words such as chuva – meaning “rain”, festa – meaning “feast”, tigela –
meaning“bowl”), pseudoword reading (20 trials, all derived from the words presented in the former test, e.g.,cuda,vesta, andfigeta), reading comprehension (11 questions about a short, 89 words long text, calledO tatu encabulado, meaning“The embarrassed arma-dillo”), oral syllable deletion (16 CVCV trials), oral syllable reversal (10 CVCV trials), phoneme deletion (26 trials: 16 CVC and 10 CCV), phoneme reversal (20 trials: 5 CV, 5 VC, 10 VCV)–note that most stimuli and responses were pseudowords in the latter four tests–
and auditory acronyms (16 trials, e.g., charmosa ilha– meaning
“charming island”). A total literacy score was calculated as the average of performance on these 10 tests. As can be seen in
Table 3, although reading-related performance was poor in most participants, it was also highly variable.
Participants also completed the five series (60 items) of the PM38 [49]. Scores on the PM38 were generally low and with a considerable dispersion. This is not surprising, as a recent Brazilian study showed large national discrepancies, with limited education level and low socioeconomic status deeply affecting PM38 perfor-mance [15]. In addition, scores as low as 12.5 are commonly observed in illiterate and/or unschooled participants[73].
Participants were also presented with two memory tests. In the word span test, they had to repeat sequences of increasing length, each sequence including two tofive monosyllabic frequent Portu-guese words (chão, pé, mar, céu, gol, meaning “ground”, “foot”,
“sea”,“sky”,“goal”). Seven different sequences were presented for each sequence length. In the listening span task, participants had to listen to a series of sentences, retaining thefinal word of each sentence for spoken recall at the end of the series, while simulta-neously judging each sentence as true or false. Here, to control for word familiarity, all sentences ended with a word denoting a numeral. After an initial example including two sentences (Meia dúzia são seis; Os dias da semana são sete, meaning“Half a dozen is six; the days of the week are seven”; expected answer:seis–sete,
“six-seven”), series of three to five sentences were presented. Seven different trials (series of sentences) were presented for each
Table 3
Experiment 2: mean age and schooling level of the participants. Correct scores (in %) observed in the reading-related tests and performance in the PM38. SD¼standard deviations. Min and Max: minimum and maximum observed scores, respectively.
Mean SD Min Max
Age (yrs) 37.54 14.37 17 77
Schooling (months) 4.73 6.1 0 18
Letter knowledge (%) 77.34 28.75 4 100
Grapheme knowledge (%) 46.34 30.02 0 100
Word reading (%) 45.63 37.44 0 100
Pseudo-word reading (%) 32.14 30.14 0 90
Written text comprehension (%) 42.37 38.77 0 100
Phoneme deletion (%) 33.38 38.68 0 100
Phoneme reversal (%) 14.91 22.57 0 70
Acronyms (%) 11.83 26.43 0 88
Syllable deletion (%) 53.46 28.65 0 100
Syllable reversal (%) 31.79 34.86 0 100
Total literacy score (%) 38.92 26.86 2.93 89 Standard progressive matrices (PM38) 16.54 4.56 9 29
Listening span 3.09 0.78 2 4.5
length. For both tests, participants were presented with sequences of increasing length, proceeding to the next length only if they had answered correctly to at least four of the seven trials. For each test, the span was estimated on each participant as being the length for which the participant presented at least four correct answers; this score was then corrected as a function of the number of correct trials obtained for the next length (with 0.25, 0.50 and 0.75 scores for 1, 2 or 3 correctly answered trials, respectively). Average results are presented inTable 3.
3.1.2. Fluency tasks: materials, procedure and scoring
In the phonemic fluency task, participants were asked to produce for one minute as many words as possible starting with either /a/ or /p/. In the animal fluency task, participants were asked to produce for one minute as many animal names as possible, without repetition. In the alternating semantic fluency task, they had to produce for one minute alternatively the name of a fruit and of a tool, also without repetition. For all tests, the experimenter used a chronometer and stopped the participant after one minute, tape-recording the session for further data analysis. For the animalfluency task, the scoring was the same as in Experiment 1, except that no digitalized version of the tape-recorded data could be provided. Timing parameters were thus estimated on the digital recordings, using a chronometer. The same holds true for the alternatingfluency task. For the latter, we also estimated alternation errors, for instance answering with two tool names in a row.
All participants werefirst presented with the phonemicfluency tests (first with /a/ then with /p/), next with animalfluency, and
finally with alternating fluency. The reading-related tests were presented before the fluency tasks, the PM38 afterwards. All tests were parts of a larger battery of 56 tests that were presented to participants in eight to 10 sessions over a period of six months[38].
3.2. Results
Table 4presents the average values of the various measures of
fluency performance in the three fluency tasks, as well as the correlations between these scores and age, schooling (in months), literacy (total literacy score), and performance in the PM38 and memory tests. For the scores that significantly correlate with literacy, Table 4also presents the partial correlations that were computed when a measure tended to correlate with total output, PM38, working memory, or word span (this was done whenr(28)
Z0.25).12
As shown in Table 4, the average total correct output was higher in the animalfluency task than in the other two tasks, with the lowest performance observed in the phonemic fluency task (on the average, 4.82 and 6.14 total correct output for /a/ and /p/, respectively). Consistently, the ANOVA run on these scores showed a highly significant effect of task,13 F(2, 54)
¼42.47, po0.0001,
ηp2¼0.61 with better performance in the animal than in both the
alternate,F(1, 54)¼9.55,po0.005, and phonemicfluency tasks,
F(1, 54)¼82.16, po0.0001, and in the alternate than in the
phonemicfluency task,F(1, 54)¼35.7,po0.0001. Yet, total correct
output was strongly correlated between these three tasks (between animal fluency and alternating fluency: r(26)¼0.62,
po0.0005; between animal and phonemic fluency:r(26)¼0.70,
po0.0001; between phonemic and alternating fluency: r(26)¼
0.48po0.01.
As illustrated inTable 4, there was no significant correlation at all between the various fluency scores and age or number of months during which the participants attended school in child-hood, probably because many of them (54%) never attended school. Total correct output did correlate with literacy in all three tasks, and remained significantly correlated with literacy after removing the effect of either working memory or PM38 in both animal and phonemicfluency, but not in alternating fluency, in which the correlation vanished after removing the effect of work-ing memory. As can be seen inTable 4, all the correlations of the otherfluency measures with literacy vanished after removing the effect of either working memory or PM38.
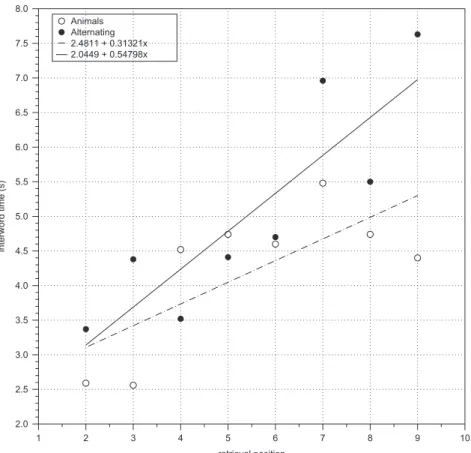
As in Experiment 1, we examined interword times in two ways. First, we analyzed them as a function of retrieval position, contrasting the animal to the alternatingfluency tasks. As shown in Fig. 4, when intervals were computed over the first nine positions (which corresponds to the average total correct output in alternatingfluency), the slope of the retrieval-position function is somewhat steeper in the alternating than in the animalfluency task. This confirms the idea that alternating fluency is more difficult than animalfluency, probably because it involves higher executive functioning (and in particular working memory) demands (e.g.,[12,19,20,36,77]).
Second, as in Experiment 1 we also examined whether inter-word times were shorter when these belonged to the same semantic subcategory than when they belonged to different subcategories. As there was no strong difference in interword times between cluster switches and hard switches (with averages of 5.91 and 6.29 s, respectively), and as eight participants did not present any cluster switch, we contrasted all inter-subcategories responses to intra-subcategory responses (see Table 4). The Wilcoxon matched pairs test confirmed that interword times were significantly longer for inter- than intra subcategory responses,
Z¼2.25,po0.025.
In addition, it is worth noting that the interword times in alternatingfluency, which by definition were inter-category, are almost identical to, and in any case not longer than, the inter-category interword times of the animalfluency task (seeTable 4). Yet, these measures did not correlate with each other,r(26)¼0.22,
p40.10 (neither did the interword times of alternating fluency
with the intra-category interword times of animalfluency,r(26)¼
0.10,p40.10).
3.3. Discussion
The present experiment clearly shows that literacy, even of a rudimentary level, contributes to acquire content knowledge: in animal fluency, the total number of generated words strongly correlated with literacy level, and this correlation cannot be explained by either working memory or general intelligence, as estimated through the PM38. The same holds true for total output in phonemic fluency, but not for total output in alternating
fluency. Indeed, although total output in the alternating fluency task was marginally correlated with literacy, this correlation was not significant any longer after partialing out the effect of working memory. Together with the fact that the number of (cluster) switches did not correlate with literacy in animal fluency, this suggests that the switching component of semanticfluency, be it spontaneous as in the simple animalfluency task, or imposed as in the alternatingfluency task, does not strongly depend on literacy. Similarly, the fact that the correlations of the other fluency measures with literacy vanished after removing the effect of either working memory or PM38 suggests that literacy per se affects only content knowledge, more particularly total correct output. In
12Note that the partial correlations that remove the effect of total output, PM38, working memory, or word span also take into account the correlation between literacy and total output, PM38,r(26)¼0.54,po0.01, working memory, r(26)¼0.58,po0.01, or word span,r(26)¼0.14,p40.10, respectively.
13The task effect was also significant in the non-parametric Friedman ANOVA
Experiment 2: average scores in the animal and alternating semanticfluency tasks, as well as in phonemicfluency. SD: standard deviations. WM: working memory.
Fluency task Mean SD Correlations
Literacytotal
output
Schooling PM38 Total output
Age WM Word
span
Littotal
output
Literacyschooling LiteracyPM38 LiteracyWM LiteracyWord
span
Animal
Total correct output 11.04 3.95 0.57nnn
0.14 0.39n
– 0.05 0.48nn
0.15 – – 0.46n
0.46n
–
Number of subcategories 3.07 0.86 0.19 0.21 0.09 0.49nnn
0.04 0.29 0.12 – – – – –
Number of clustersa 1.75 1.04 0.39n
0 0.26 0.74nnnn
0.10 0.27 0.15 0.06 – 0.31 0.30 –
Mean cluster sizea 3.55 1.55 0.40n
0.29 0.36(n) 0.26 0.02 0.09 0.18 0.32(n) 0.35(n) 0.26
– –
Number of isolated words 2.29 2.48 0.07 0.20 0.02 0.26 0.04 0.20 0.05 – – – – –
Total number of between-subcategory switches
4.54 2.6 0.19 0.16 0.08 0.51nnn
0.14 0.39n
0.04 – – – – –
Number of cluster switchesa 0.29 0.54 0.03 0.02 0.10 0.24 0.11 0.06 0.01 – – – – –
Number of repetitions 0.54 0.69 0.12 0.04 0.12 0.20 0.06 0.15 0.10 – – – – –
Number of grapho-phonological related words
0.89 0.83 0.37n
0.19 0.52nnn 0.64nnnn
0.05 0.41n
0.25 0.01 0.44nn
0.12 0.18 0.35(n)
Cluster switches interword time 5.91 5.34 0.33(n) 0.24 0.25 0.50nnn
0.09 0.40n
0.14 0.06 0.42n
0.24 0.13 –
All inter-category interword time 6.29 3.64 0.28 0.08 0.14 0.38n
0.26 0.19 0.03 – – – – –
Intra-category interword time 4.43 3.05 0.38n
0.04 0.30 0.54nnn
0.04 0.49nnn
0.05 0.10 – 0.27 0.14 –
Normalized switching time costb 18.95 32.20 0.08 0.07 0.08 0.20 0.12 0.34(n) 0.05 – – – – –
Alternating
Total correct output 9.14 3.46 0.37n
0.10 0.07 – 0.08 0.62nnnn
0.46nn
– – – 0.02 0.35(n)
Number of repetitions 0.43 0.79 0.04 0.11 0.02 0.04 0.30 0.05 0.02 – – – – –
Number of alternation errors 0.57 1.20 0.16 0.08 0.30 0.51nnn
0.02 0.08 0.02 – – – – –
Number of grapho-phonological related words
1.14 1.24 0.02 0.13 0.06 0.13 0.19 0.17 0.21 – – – – –
Interword time 6.08 3.80 0.27 0.15 0.16 0.56nnn
0.23 0.53nnn
0.18 – – – – –
Phonemic
Total correct output (averaged for /a/ and /p/) 5.48 3.46 0.87nnnn
0.07 0.49nnn
– 0.07 0.61nnnn
0.15 – – 0.83
nnnn
0.80nnnn
–
aWith clusters of at least three words of the same semantic subcategory.
bThe difference between inter and intra-categoryinterword times, normalized as a function of overall speed. (n)pr0.10.
n pr0.05. nn
pr0.025. nnn
pr0.01. nnnn
pr0.001.
R.
K
olinsky
et
al.
/
Trends
in
Neur
oscience
and
Education
3
(20
14)
1
06
–
121
11