FT-IR, Thermal and Optical Studies of Gel Grown Cobalt Tartrate Crystals
S.J. Nandre1,*, S.J. Shitole2,†, R.R. Ahire3
1 Departmentof Physics, Uttamrao Patil College, Dahivel, Tal. Sakri, Dhule, 424304 India 2 Department of Physics, Z. B. Patil College, Dhule, 424002 India
3 Department of Physics, S. G. Patil College, Sakri, Dhule, 424304 India
(Received 06 August 2013; published online 31 January 2014)
The growth of cobalt tartrate crystals was achieved in silica gel by single diffusion method. Optimum conditions were established for the growth of good quality crystals. Fourier transform infrared (FT-IR) spectroscopic study indicates the presence of water molecules and suggests that tartrate ions are doubly ionized. The thermal behavior of the material was studied using thermogravimetry (TG) and differential thermal analysis (DTA). The results show that the material is thermally stable up to30 C, beyond which it decomposes through many stages till the formation of cobalt oxide at 995 C. The non linear optical behav-ior of these crystals is reported and explained.
Keywords: Gel grown cobalt tartrate crystals, FT-IR, TGA / DTA, UV spectroscopy.
PACS numbers: 81.10.Dn, 81.10.Aj
*sjnandre@gmail.com
†sjshitole@hotmail.com
1. INTRODUCTION
Tartaric acid is a common byproduct of the wine in-dustry may serve as a base for the two hydroxyl as well as two carbonyl groups and in this compound permits ready incorporation of phosphorus containing moieties. For most applications, these materials are used for their dielectric, ferroelectric and piezoelectric or non linear optical properties [1-3].These characteristics of tartrate compounds are utilized for their use in trans-ducers, linear and non linear mechanical devices. Sev-eral researchers have grown materials of great interest from both solid state sciences as well as technological point of view in single crystal and polycrystalline form by gel technique [4], and modified such materials by suitable substitution to determine the effect of modifi-cation of composition on their characteristics [5-8].In the recent years the technology and science of crystal growth has advanced rapidly for the development of new nonlinear optical materials. The desire to utilize the properties of these materials in applications such as telecommunications, optical data storage and optical information processing has created a need for new ma-terials with very large second order susceptibilities [9-12].Most commercial materials are inorganic especially for high power use [13].Inorganic materials were main-ly grown by solution growth techniques. One of the pos-sibilities to grow single crystals of sparingly insoluble inorganic substance is the use of gel method [14-17].
The present work describes the growth of cobalt tartrate crystals grown in silica gel. These crystals are identified and characterized by FT-IR, thermogravime-try (TGA) and differential thermal analysis and UV absorption spectroscopy.
2. MATERALS AND METHODS
Spherulitic crystals of cobalt tartrate were grown by single diffusion method. The details of various experi-ments of growth of these crystals have been published
elsewhere. The experiments pertaining to the growth of cobalt tartrate crystals were conducted in borosilicate glass tube of 2.5 cm diameter and 20 cm length. Gel was prepared by mixing sodium metal silicate solution of specific gravity 1.04 gm / cm3 with the desired con-centration of tartaric acid (0.5-1.5 M) which acted as lower reactant. The solution was continuously stirred to avoid local ion concentration which may cause prem-ature local gelling and make the final solution inhomo-geneous. The pH of the medium was adjusted between values of 3-5. The solution with the desired value of pH was then transferred to several glass tubes and left for gelling. After confirming the gel setting, an aqueous solution of cobalt chloride (0.2-1.5 M) was carefully poured along the walls of the tube with the help of pi-pette over the set gel, in order to avoid any gel break-age. The cobalt ions diffuse through the narrow pores of the gel to react with the tartrate ions (C4H6O6-2) pre-sent in the gel as lower reactant giving rise to the for-mation of cobalt tartrate crystals.
The following reaction is expected to take place in the gel medium.
CoCl2 + C4H6O6 CoC4H6O6 + 2HCl
Based on the various conducted experiments leading to pH of gel, gel density, concentration of upper reactant, concentration of lower reactant, gel aging etc, the best controlling parameters which lead to growth of good cobalt tartrate crystals are given in table 1 which shows the optimum condition to grow the good tartrate crystals.
In present work, figure1 shows tartrate crystals in test tubes, figure 2 shows optical photo graph of cobalt tartrate crystals under variation of upper reactant conc. 0. 5 M. Figure 3 illustrates different morphologies of pure cobalt tartrate crystals.
Table 1 – Optimum condition for growth of cobalt tartrate crystals
No Various process
parameters
Optimum conditions
1 Density of sodium meta
silicate 1.04 gm/cm
3
2 Concentration of CoCl2 0.5 M
3 Concentration of C4H6O6 0.9 M
4 pH of Mixture 4.2
5 Temperature Room
temperature 6 Gel setting time 48 hrs
7 Gel aging time 36 hrs
8 Period of crystal growth 2 weeks
Fig. 1 – Cobalt tartrate crystals in test tubes
Fig. 2 – Cobalt tartrate crystals under variation of upper reac-tant conc. is 0.5 M
Fig. 3 – Different morphologies of pure cobalt tartrate crystals
3. RESULTS AND DISCUSSION
Cobalt tartrate crystals were characterized by FT-IR, thermal analysis, and UV spectroscopy.
3.1 Fourier Transform Infrared (FTIR) Spectral Analysis
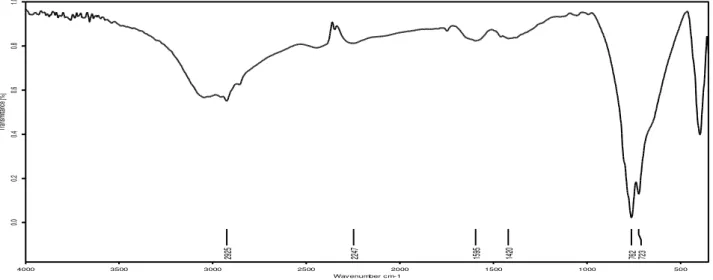
In organic chemistry, an IR spectrum is used for qualitative and quantitative analysis. The FT-IR spec-trum of cobalt tartrate was recorded in KBr phase in frequency region 400-4000 cm– 1 using SHIMADZU spectrometer. Figure 4, shows FT-IR spec-trum of cobalt tartrate. The recorded FT-IR spectra were compared with the standard spectra of functional groups [18]. The broad band due to stretching vibra-tions of hydroxyl, water and C-H groups is observed. FT-IR spectral and vibrational assignments of cobalt tartrate are shown in following table 2.
Table 2 –FT-IR spectral and vibrational assignment of cobalt tartrate crystals
M medium, W weak, S strong, B broad, Sh sharp.
No Wave number
cm-1 Intensity Assignments
1 3640-3610 S, Sh O-H Stretch
2 3100-3000 S C-H Stretch
3 3000-2850 M C-H Stretch
4 2830-2695 M C-H Stretch
5 2260-2100 W C C Stretch
6 1650-1580 M N-H bend
7 1470-1450 M C-H bend
29
25
22
47
15
95
14
20
76
2
72
3
500 1000
1500 2000
2500 3000
3500 4000
Wavenumber cm-1
0.0
0.2
0.4
0.6
0.8
1.0
Tr
ans
mi
ttanc
e [
%
]
Fig. 4 –FT-IR spectrum of cobalt tartrate crystal
3.2 Thermal Analysis
Thermal studies give useful information regarding the thermal stability and composition of the sample under investigation. Recorded curves were first ana-lyzed for obtaining the percentage mass loss at differ-ent temperatures and hence about the thermal stability and dissociation of the compound [19-20].
The TG / DTA curve of cobalt tartrate is obtained at the temperature range 30-1010 C. As indicated, the ma-terial remains stable up to the temperature 30 C and starts decomposing about at 35 C and the process contin-ues up to 995 C, after which it is reduced to oxide. Fig-ure 5 represents the TGA curve and figFig-ure 6 represents the DTA curve.
TGA
The TGA curve for cobalt tartrate crystal is shown in figure 5. The percentages of the weight loss on the different stages of decomposition of cobalt tartrate are presented in table 3.
0 200 400 600 800 1000
20 30 40 50 60 70 80 90 100 110
W
e
ig
h
t
%
Temparture in degree celcius
TGA Cobalt tartrate
Fig. 5 – TGA curve of cobalt tartrate crystal
There is a good agreement between the observed and calculated weight losses. Cobalt tartrate is water coordinated compound. Therefore there is a possibility that this crystal may lose some of its water molecules
while heating. TGA of cobalt tartrate showed clearly four stages of decomposition as expected: 1) Dehydra-tion; 2) Conversion of cobalt tartrate to cobalt oxalate; 3) Conversion of cobalt oxalate to cobalt carbonate; 4) Conversion of cobalt carbonate to oxides of cobalt.
Table 3 – TGA data
The observations of Rochelle salt and rare earth tar-trates are known from the literature. The first stage of decomposition (30-115 C) results due to the elimination of water molecules. The calculated and observed mass losses corresponding to this are 21.50 % and 21.7 % of the total mass taken respectively. The second stage is between 100-135 C and corresponds to the loss of oxy-gen and results in the formation of cobalt oxalate. Then the compound is stable at temperature135- 340 C, the thermograph is parallel to temperature axis. But in the range of temperatures 340-410 C it loses % weight about 53 %, and the formed product is cobalt carbonate.
Then the compound slowly decomposes at the tem-perature range 480-995 C and % weight loss is 6 %, forming oxides of cobalt. TGA data is shown in table 3.
DTA
The DTA curve for cobalt tartrate gel grown crystals is shown in figure 6 and the DTA data collected from this curve is tabulated in table 4.
In DTA curve we observed three endothermic peaks at 120 C, 390 C, and 410 C. The endothermic peak at 120 C, 390 C and 410 C are due to the decomposition of hydrated cobalt tartrate into anhydrous cobalt tartrate. On the first stage of decomposition, the peak at 120 C is attributed to the loss of first water molecules and is im-mediately followed by another endothermic peak at 390 C which corresponds to loss of water molecules again.
No. Tempera-ture range
Observed % weight loss
Calculated % weight loss
0 200 400 600 800 1000 -80
-70 -60 -50 -40 -30 -20 -10 0 10
M
icro
v
o
lt
En
d
o
D
o
w
n
Temperature in degree celcius
DTA of Cobalt tartrate
Fig. 6 –DTA curve of cobalt tartrate crystal
Table 4 – DTA data
The endothermic peak at 475 C is due to decomposi-tion of anhydrous cobalt tartrate. This endothermic peaks observed in the DTA curve corresponds to the total weight loss of water molecule in the TG curve.
4. UV ABSORPTION SPECTROSCOPY
The absorption spectra of cobalt tartrate crystals were recorded using a SHIMADZU UV-2450 UV-Vis spectro-photometer over the wavelength range 200-650 nm. Fig-ure 6 shows UV absorption spectra of cobalt tartrate crys-tals. From the spectrum, it has been inferred that cobalt tartrate crystals have sufficient transmission in the entire visible and IR region. The absorption coefficient is high at lower wavelength and wide transparency from 430 nm suggesting their suitability for second and third harmonic generations of the radiation [21-23].
The band gap energy of cobalt tartrate crystals with the obtained wavelength is calculated using the follow-ing simple conversion equation.
Band gap energy (eV) 1240 / wave length (nm). Band gap energy is represented in table 5.
Table 5 –Band gap energy of cobalt tartrate crystal
Crystal (nm) Band gap Energy (eV) Cobalt tartrate 300 4.13
200 300 400 500 600
0.2 0.4 0.6 0.8 1.0 1.2 1.4 1.6
Ab
so
rp
ti
o
n
Wavelength in nm
Fig. 6 – UV of cobalt tartrate crystals
5. CONCLUSIONS
i) Single crystal of cobalt tartrate was grown by the gel growth technique.
ii) Cobalt tartrate crystal has different morpholo-gies. Some of the crystals are opaque and few good quality crystals were obtained.
iii) The FT-IR spectrum confirms the formation of cobalt tartrate crystals.
iv) The result of thermal analysis suggests that the gel grown cobalt tartrate is thermally unstable even at low temperature. Decomposition starts at about 30 C and process continue up to 995 C, after which it reduc-es to oxide. Finally, cobalt tartrate decomposreduc-es to co-balt oxide.
v) It has been inferred that cobalt tartrate crystal has sufficient transmission in the entire visible and IR region.
ACKNOWLEDGEMENTS
The authors are grateful to Principal Dr. P.H. Pawar, Z.B. Patil College, Dhule for providing laboratory facili-ties. Our special thanks are to R. K. Jha, NCL, Pune for providing laboratory facilities for TGA/DTA study. The authors are grateful to Dr. L. A. Patil, Head, Department of Physics, Pratap College, Amalner, for providing labora-tory facilities for UV characterization. One of the authors (SJN) is thankful to Dr. B. D. Borse, Principal, Uttamrao Patil College, Dahivel for his inspiring suggestions.
REFERENCES
1. E. Toress, A.C. Yanes, T. Lopez, J. Stockel, J.F. Peraza, J. Cryst. Growth156, 421 (1995).
2. E. Toress, T. Lopez, J. Peraza, J. Stockel, A.C. Yanes, C. Gonzalez-Silgo, C. Ruiz-Pereza, P.A. Lorenzo-Luis,
Struc. J. Appl. Phys.84, 5729 ( 1998).
3. E. Toress, T. Lopez, J. Stockel, X. Sola, M. Garcia-Valle’s, E. Rodriguez-Castellon, C. Gonzalez-Silgo, J. Solid State Chem.163, 491 (2002).
4. S. Shajan, C. Mahadevan, Bull. Mater. Sci.27, 327 (2004). 5. I. Quasim, A. Firdous, B. Want, S.K. Khosa, P.N. Kotru,
J. Cryst. Growth.310, 5357 (2008).
6. A. Firdous, I. Quasim, M.M. Amhad, P.N. Kotru, J. Cryst. Growth 311, 3855 (2009).
7. Suresh Kumar, M.H. Rahim Kutty, M.R. Sudarsana Ku-mar, K. Jitendra Babu, Bull. Mater. Sci.30, 349 (2007). 8. Seth Marder, W. Joseph Perry, P.W. Schwefer, Science
245, 626 (1989).
9. Milton Boaz, S. Jerome Das, J. Cryst. Growth. 279, 383 (2005).
No Peak Temperature in C
Nature of reaction
1 120 Endothermic
2 390 Endothermic
3 410 Endothermic
10. Milton Boaz, J. Mary Linet, Babu Varghese, M. Palani-chamy, S. Jerome Das, J. Cryst. Growth.280, 448 (2005). 11. Milton Boaz, P. Santhana Raman, S. Xavier Jesu Raja,
S. Jerome Das, Mater. Chem. Phys. 93, 187 (2005). 12. N. Prasad, D.J. Williams, Introduction to Linear Effects in
Molecules and Polymers (New York: Wiley: 1991). 13. K. Henisch, Crystal in Gels and Liesegang Rings
(Cam-bridge: Cambridge University Press: 1988).
14. T. Wilke, P. Kristallizuchtung, Verlag Harri Deutsch, Frankfurt / Main, 933 (1988).
15. K. Mayer, D. Woermann, J. Cryst. Growth 169,317 (1996). 16. S. Bhavsar, K.B. Saraf, Cryst. Res. Technol.37, 51 (2002). 17. Valsamma Samuel, N.V. Unnikrishnan, M.A. Ittayachen,
J. Therm. Anal. Calorim. 96, 917 (2009).
18. Nakamoto, Infrared Spectra of Inorganic and Co-ordination Compounds (New York: John Wiley and sons Inc: 2nd edn: 1970).
19. S.J. Shitole, K.B. Saraf, Bull. Mater. Sci.24 (5), 461 (2001). 20. M. Patil, D.K. Sawant, D.S. Bhavsar, J.H. Patil,
K.D. Girase, J. Therm. Anal. Calorim.107, 1031 (2012). 21. Nisha Santha Kumaria, S. Kalainathan, Cryst. Res.
Tech-nol. 43, 276 (2008).
22. Kalaisevi, R. Mohan Kumar, R. Jayavel, Cryst. Res.
Tech-nol.43, 851 (2008).