*e-mail: sureshsagadevan@gmail.com
1. Introduction
The growth of single crystals has been studied for hundreds of years in order to produce materials of aesthetic value such as gemstones. Many also believed that gemstones had medical or mystical virtues, as well, which further added to their
value. More recently, crystals of scientiic or technological
importance such as semiconductors or laser materials have received the greatest attention and have formed the basis of new industries. Today, single crystals and epitaxial layers are the heart of computers, communication systems and medical devices1. Enormous effort has been put on the growth and perfection of crystals of different materials with regard to the application. Organic crystals have received very little attention for industrial applications, because of the poor mechanical property and chemical instability. Organic NLO materials are attracting a great deal of attention, as they have large optical susceptibilities, inherent ultra fast response times and high optical thresholds for laser power compared with inorganic materials2. The rapid development of optical communication systems has led to a demand for nonlinear optical materials of high structural and optical quality. Also,
the development of highly eficient nonlinear optical materials
for opto-electronic throughput and optical data storage has been the subject of intense research activity the world, over the past two decades3,4. Some organic compounds exhibit high nonlinear optical response and in many cases, orders of magnitude larger than widely known inorganic materials.
In recent years there has been increased need of organic materials for nonlinear optical (NLO) applications because of their usage in devices such as second harmonic generators, electro-optic modulators, frequency conversion, etc.5
The development in the growth of highly eficient NLO
crystals for visible and ultraviolet regions is important for both Laser spectroscopy and laser processing6. They have
wide applications in the ield of telecommunication and optical
information storage devices7. In view of this, it is desirable to search for new NLO crystals, which possess shorter cut
off wavelength, suficiently large nonlinear coeficient,
transparency in UV region and high damage threshold. Organic crystals have parameters competitive with widely used crystals of KDP type7. The present investigation deal with the growth of glycine zinc sulfate single crystal was grown by slow evaporation technique. The grown crystals were characterized by single crystal and powder X-ray diffraction analysis, UV analysis, microhardness, dielectric, SHG, photoconductivity measurements and etching studies. The results of these studies have been discussed in this paper in detail.
2. Growth of Glycine Zinc Sulfate
Glycine zinc sulfate was synthesized by dissolving glycine and zinc sulfate in equimolar ratio (1:1) in double distilled water. The solution was stirred continuously using a magnetic
stirrer. The obtained saturated solution was further puriied
Investigation on Physical Properties of Semiorganic Nonlinear Optical
Glycine Zinc Sulfate Single Crystal
Natarajan Nithyaa, Raman Mahalakshmib, Suresh Sagadevanc*
aDepartment of Physics, Sree Sastha College of Engineering,
Chembarambakkam, Chennai, 600 123, India
bDepartment of Physics, GKM College of Engineering and Technology, Chennai, 600 063, India
cDepartment of Physics, Sree Sastha Institute of Engineering and Technology,
Chembarambakkam, Chennai, 600 123, India
Received: March 11, 2015; Revised: May 18, 2015
Nonlinear optical single crystals of Glycine Zinc Sulfate (GZS) were grown by slow evaporation technique. Single crystal X-ray diffraction analysis revealed the crystal system and lattice parameter values. Powder X-ray diffraction analyses have been carried out and the diffraction patterns have been indexed. The optical properties of the crystals were determined using UV-Visible spectroscopy. Optical
constants such as band gap, refractive index, extinction coeficient and electric susceptibility were
determined from UV-Visible spectroscopy. The refractive index was determined using Brewster’s angle method. Hardness of the GZS crystal was estimated by Vicker’s hardness studies. Second Harmonic Generation (SHG) of GZS crystal was investigated by Kurtz powder technique. The dielectric constant and dielectric loss measurements were carried out for different temperatures and frequencies. The
photoconductivity studies conirm that the grown crystal has negative photoconductivity nature. In order
to investigate the growth mechanism and surface features, etching studies are carried out for the crystal.
and allowed to evaporate at higher temperature. Synthesized
material was puriied by repeated recrystallization process.
Tiny seed crystals with good transparency were obtained due to spontaneous nucleation. Among them, a defect free seed crystal was selected and suspended in the mother solution, which was allowed to evaporate at room temperature. Large size single crystals were obtained due to the collection of monomers at the seed crystal sites from the mother solution, after the nucleation and growth processes were completed. GZS crystal of dimension about 8 × 5 × 8 mm3 was harvested in a growth period of twenty four days by slow evaporation of the solvent. The photograph of the grown GZS crystal is shown in Figure 1.
3. Characterization Techniques
The grown crystal was characterized by the following techniques
3.1. Single crystal X-ray diffraction
Single crystal X-ray diffraction analysis for the grown crystals has been carried out to identify the cell parameters using an ENRAF NONIUS CAD 4 automatic X-ray diffractometer. X-ray powder diffraction is a non-destructive technique widely applied for the characterization of crystalline materials. Since the crystal was transparent, the single crystallinity was studied with Leica polarizing microscope. Single crystal of suitable size was cut and mounted on the
X-ray goniometer. The crystal is mounted on a thin glass iber
that is attached to a brass pin and mounted on a goniometer head. Adjustment of the goniometer head in the X, Y and Z orthogonal directions allows centering of the crystal in the X-ray beam. The unit cell dimensions (a, b, c, α, β, γ)
can be determined from the accurately measured 2θ values.
3.2. UV - Visible spectroscopy
Ultraviolet-visible spectroscopy (UV/ VIS) is also known as electronic spectroscopy. Ultraviolet (200-400 nm) and visible (400-800 nm) absorption spectroscopy is the measurement of the attenuation of a beam of light after it
passes through a sample or after relection from a sample
surface. Sample was typically placed in a transparent cell, known as a cuvette. The crystal holders (cuvettes) are the
rectangular shaped quartz or glass cells of about 10 mm path length. The transmitted light radiation is received at the photomultiplier tube alternately from the reference and the sample beams. A photoelectric signal timing system is synchronized with the alternate pulses which permits the comparison of signals from the two beams. The difference between the two signals is recorded with the help of a motor driven pen or is interfaced with a PC-XT and stored there for easy reference. Samples in solid form, powder, pellets are dissolved in suitable solvents to form the contents of the sample cell and the solvents are taken in the reference cell. In the present work, the UV-Visible transmission spectrum was recorded using PERKIN ELMER LAMDA Instrument.
3.3. Refractive index measurement
The refractive index of the crystals can be determined by Brewster’s angle method using He-Ne laser of wavelength
632.8 nm. A polished lattened single crystal of is mounted
on a rotating mount at an angle varying from 0 to 90 degrees. The angular readings on the rotary stage was observed, when the crystal is perfectly perpendicular to the intracavity beam. The crystal is rotated until the laser oscillates and the angle has been set for maximum power output. Brewster’s
angle (θp) for the crystal is measured. The refractive index
is calculated using the equation, n = tan θp, where θp is the polarizing angle.
3.4. NLO Test – Kurtz powder SHG method
In order to conirm the NLO property, the grown specimen
was subjected to Kurtz powder test using a Q-switched, mode locked Nd:YAG laser of 106.4 nm and pulse width of 8 ns (spot radius of 1 mm) on the powder of crystal. The input laser beam was directed on the as grown crystal powder to get maximum powder SHG. The emitted light passed through
an IR ilter was measured by means of a photo multiplier
tube and oscilloscope assembly. The green light intensity was registered by a photomultiplier tube and converted into an electrical signal. This signal was displayed on the oscilloscope screen. The crystal was replaced by potassium dihydrogen orthophosphate (KDP) and the signal was displayed in the oscilloscope screen.
3.5. Microhardness test
Microhardness measurement is a general microprobe technique for assessing the bond strength, apart being a measure of bulk strength. The crystal slices are well polished
with a thickness variation less than 10 μm to avoid the surface defects, which inluence the hardness value strongly.
The microhardness characterization is extremely important as far as the fabrication of devices is concerned. Hardness of a material is the measure of resistance when it offers to local deformation. Indentations were made on (1 0 1) plane of
GZS crystal using Shimadzu HMV-2000 itted with Vickers
pyramidal indenter. The load P is varied between 20-100 g and the time of indentation is kept constant as 15 seconds for all trials. The diagonal lengths of indentation are measured.
3.6. Dielectric studies
appropriate thickness. Suitably cut and polished GZS crystals (with known dimensions) are subjected to dielectric studies using HIOKI 3532-50 HITESTER LCR meter with a conventional four terminal sample holder. The crystal was prepared and mounted between the copper electrodes. In order to ensure good ohmic contact the sides of the crystal was coated with silver. The experiment was carried out for frequencies varying from 50 Hz to 5 MHz and for different temperatures.
3.7. Photoconductivity studies
The GZS crystal is well-polished and surfaces are cleaned with acetone. This is attached to a microscope slide and two
electrodes of thin copper wire (0.14 cm diameter) are ixed
onto the specimen at some distance apart using silver paint. A DC power supply, a Keithley 485 picoammeter and the prepared crystal are connected in series. The crystal was covered with a black cloth and the dark current (Id) of the crystal was recorded with respect to the different applied voltage. Then crystal was illuminated by the radiation from 100 W halogen lamp containing iodine vapour and tungsten
ilament and the corresponding photocurrent (Ip) is recorded
for the same values of the applied voltage.
3.8. Etching studies
Etching studies have been carried out to understand the growth mechanism and to assess the perfection of the grown crystals. Chemical etching is the oldest, easiest and most widely used method to evaluate the quality of the crystal. Etching is selective dissolution of the crystal which is used to reveal the crystal symmetry and lattice defects. The establishment of the relation between etches pits and the dislocation array present in imperfect crystals by employing the etching technique has turned out to be a powerful tool for the preparation and characterization of single crystals for electronic and optical devices. In the present work, the etching studies were carried out using Carl Zeiss optical microscope (Model Imager AIM).
4. Results and Discussion
4.1. Single-crystal X-Ray diffraction
The lattice parameters were calculated by using least-squares
reinement and are found to be: a = 8.52 Å, b=8.64 Å, c = 12.50 Å. The GZS crystal belongs to orthorhombic system
with non-centosymmetric space group Pca21. These values are in close agreement with the reported values8.
4.2. Powder X-Ray diffraction
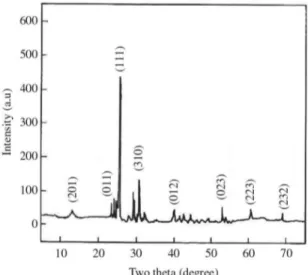
X-ray powder diffraction was used to conirm single
crystal XRD results. The efforts were made to record the powder XRD pattern of the GZS crystal and index them. The indexed powder XRD pattern of the grown GZS crystal is shown in Figure 2. Powder XRD pattern was recorded by scanning the crystal over the range 10-70° at a scan speed of
0.02°/min.The appearance of sharp and strong peaks conirms
good crystallinity of the grown crystal. From the data, the
lattice parameters were calculated as a =8.52 Å, b=8.64 Å, c=12.50 Å. The results agree well with single crystal XRD
results and also with the available literature values8.
4.3. UV-Vis-NIR spectral analysis
The optical transmission spectrum of GZS single crystal was recorded in the wavelength region 200-1000 nm and it is shown in Figure 3. For optical fabrications, the crystal should be highly transparent in the considered region of wavelength9,10. The favorable transmittance of the crystal in the entire visible region suggests its suitability for second harmonic generation11. The UV absorption edge for the grown crystal was observed to be around 230 nm. The lower cut off wavelength is found to be 230 nm for GZS which is in fairly good agreement with reported value12. The dependence
of optical absorption coeficient on photon energy helps to
study the band structure and type of transition of electrons13.
The optical absorption coeficient (α) was calculated from
transmittance using the following relation9
1 1
α =
Ln
d T (1)
where T is the transmittance and d is the thickness of the crystal. As a direct band gap material14, the crystal under
study has an absorption coeficient (α) obeying the following relation for high photon energies (hν)[10]
Figure 2. Powder X-ray diffraction pattern for GZS crystal.
1/ 2 ( ν − )
α =A h Eg
hv (2)
where Eg is the optical band gap of the crystal and A is a
constant. A plot of variation of (αhν)2 versus hν is shown in Figure 4. Eg is evaluated using the extrapolation of the linear part14. Using Tauc’s plot, the energy gap (E
g) was calculated as 5.40 eV and the large band gap clearly indicates the wide transparency of the crystal. These values are found to agree with the reported values of L-Valine Zinc Hydrochloride single crystal15. This high band gap value indicates that the grown crystal possesses dielectric behaviour to induce polarization when powerful radiation is incident on the material.
4.3.1. Determination of optical constants
Two of the most important optical properties; refractive
index and the extinction coeficient are generally called
optical constants. The amount of light that transmits through
crystal depends on the amount of the relection and absorption
that takes place along the light path. The optical constants such as the refractive index (n), the real dielectric constant
(εr) and the imaginary part of dielectric constant (εi) were
determined. The extinction coeficient (K) can be obtained
from the following Equation 11,
4
λα =
π
K (3)
The extinction coeficient (K) was found to be 4.15 × 10⁻⁶ at
λ =1000 nm. The transmittance (T) is given by13
(
)
( )
(
)
2
2
1 exp
1 exp 2
− −α
=
− − α
R t
T
R t (4)
Relectance (R) in terms of absorption coeficient can
be obtained from the above equation15. Hence,
1 1 exp( exp( ) 1 exp( )
± − −α + α
=
+ −α
t t
R
t (5)
Refractive index (n) can be determined from relectance
data using the following equation,
2
( 1) 3 10 3
2( 1)
+ ± + −
= − R R− R
n
R (6)
The refractive index (n) was found to be 1.587 at
λ = 1000 nm. From the optical constants, electric susceptibility (χc) can be calculated according to the following relation
16
2 2 r 0 4
ε = ε + πχ = −C n k (7)
Hence,
2 2 0 4
− − ε
χ =C π
n k
(8)
where ε0 is the permittivity of free space. The value of
electric susceptibility (χc) is 0.147 at λ=1000 nm. The real
part dielectric constant (εr) and imaginary part dielectric
constant (εi) can be calculated from the following relations 15
2 2
ε = −r n k (9)
2
ε =i nk (10)
The value of real dielectric (εr) and imaginary constant
(εi) at λ =1000 nm were estimated at 1.523 and 7.802 × 10 -5,
respectively. The moderate values of refractive index and optical band gap suggest that the material has the required transmission range for NLO application. The lower value of dielectric constant and the positive value of the material are capable of producing induced polarization due to intense incident light radiation.
4.4. Refractive index measurements
Finely polished crystals of the GZS were used for refractive index measurements. This crystal was cleaved and is placed on a rotating mount at an angle varying from 0 to 90 degrees. He-Ne laser of wavelength 632.8 nm was
used as the source. Brewster’s angle (θp) for GZS was
measured to be 57.85 degrees. The refractive index has been calculated using the equation n = tan θp, where θp is the polarizing angle and it is found to be 1.591[17].
4.5. NLO Test – Kurtz powder SHG method
The most widely used technique for conirming the SHG eficiency of NLO materials to identify the materials with
non-centrosymmetric crystal structures is the Kurtz Powder technique18. Fine powders of GZS crystals were exposed under 1064 nm laser beam from a pulsed Nd:YAG laser having a repetition rate of 10 Hz and pulse width of 8 ns to test the
second harmonic generation (SHG) eficiency. The SHG eficiency of the GZS crystal was evaluated by taking the
microcrystalline powder of KDP as the reference material. The output light was passed through a monochromator which
detected green light at 532 nm. This conirms the NLO behaviour of the material.The relative conversion eficiency
reference to KDP crystals. It is observed that the conversion
eficiency of GZS is 1.2 times that of KDP crystal.
4.6. Microhardness studies
Hardness is an important mechanical property. The mechanical characterization of the GZS crystals was carried out by Vickers hardness test at room temperature.
Crystals free from cracks with lat and smooth faces were
chosen for the static indentation tests. The microhardness measurements were carried out with a load range from 20 to 100 g. Indentations were made on (1 0 1) plane of GZS crystal. The Vickers microhardness number was calculated using the relation,
2 v 1.8544 2 /
=
P
H kg mm
d (11)
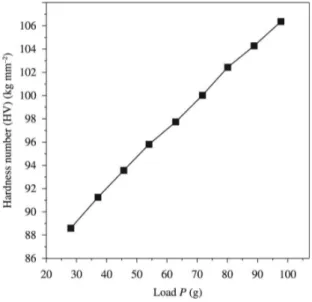
where P is the indenter load and d is the diagonal length of the impression. The Figure 5 shows the variation of P with Vickers hardness number (Hv) for GZS single crystal. It is evident from the plot that Vickers microhardness number increases with increasing applied load. According to Meyer’s law, the relation connecting the applied load is given by
1
= n
P k d (12)
log P=log k+n log d (13)
where n is the Meyer index or work hardening exponent and k1, is the constant for a given material. The above relation indicates that ‘Hv’ should increase with load P if n > 2 and decrease with load P when n < 2. We have determined ‘n’ from slope of the plot that is shown in Figure 6. The value of ‘n’ for GZS was found to be 2.35. Low value of work
hardening coeficient ‘n’ illustrates fewer defects in the as
grown crystal. The large value of n indicates large effect of dislocations. According to Onitsch19, n should lie between 1 and 1.6 for harder materials and above 1.6 for softer materials. From the hardness study, the grown GZS crystal is found to be relatively soft material20.
4.7. Dielectric studies
Dielectric properties are related with the electric ield
distribution within solid materials. Dielectric studies of the grown GZS crystal has been carried out at various frequencies and temperatures. The behaviour of the crystal under electric
ield has close relationship with the laser light irradiation
and hence the power dissipation factor can be studied from the dielectric studies. The plots of dielectric constant and dielectric loss with frequency for various temperatures are shown in Figures 7 and 8. The dielectric constant is high in the lower frequency region and variation of dielectric constant with log f decreases with an increase in frequency. The very high value of dielectric constant at low frequencies may be due to the presence of all the four components namely, space charge, orientational, electronic and ionic polarizations. The high value of dielectric constant at low frequency may be due to presence of all polarizations and its low value at
higher frequencies may be due to the signiicant loss of all
polarizations gradually21. In accordance with Miller rule, the lower value of dielectric constant is a suitable parameter
for the enhancement of SHG eficiency. The variation of
dielectric constant with temperature is generally attributed to
Figure 5. Variation of Hv with load P.
Figure 6. Plot of log d Vs log p.
the crystal expansion, the electronic and ionic polarizations and the presence of impurities and crystal defects.
The dielectric loss was also studied as a function of frequency for different temperatures and is shown in Figure 8. The low dielectric loss at high frequencies for the given crystal indicates very high purity of the material. This parameter is of vital importance for nonlinear optical materials in their applications. These curves suggest that the dielectric loss is strongly dependent on the frequency
of the applied ield. The higher values of dielectric loss at
low frequencies originate from space charge polarization mechanism and the characteristic of low dielectric loss at high frequencies reveals that the grown crystal possesses relatively high optical quality with low defect density. The behaviour of low dielectric loss with high frequency for the crystal suggests that the crystal possess enhanced optical quality with lesser defects and this parameter plays a vital role for the fabrication of nonlinear optical devices22,23.
4.8. Photoconductivity studies
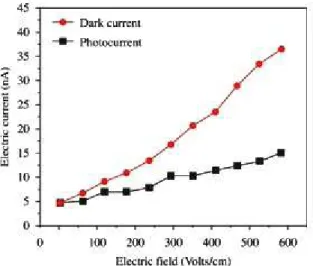
The ield dependent photoconductivity of the crystal was
shown in Figure 9. From the igure, photocurrent is found to be less than that of the dark current for all ranges of applied
ield enunciates negative photoconductivity. The negative
photoconductivity in this case may be due to the reduction in the number of charge carriers or their lifetime in the presence of radiation. Decrease in lifetime with illumination, could be due to the trapping process and increase in carrier velocity. In Stockmann’s model, a two level scheme is proposed to explain negative photoconductivity24. The upper energy level is situated between the Fermi level and the conduction band, whereas the other one is located in the neighborhood of the valence band. The lower level has high capture cross-section for electrons from the conduction band and holes from the valence band. As a result, sooner the crystal is kept under exposed light, the recombination of electrons and holes take place, resulting in decrease in the number of mobile charge carriers, giving rise to negative photoconductivity. It is seen from the plots that both Id and Ip of the crystal increase
linearly with applied ield. It is observed from the plot that
the dark current is always higher than the photocurrent,
thus conirming the negative photoconductivity nature of
the GZS single crystal25.
4.9. Etching studies
Etching is a technique which is used to reveal the defects in crystals like dislocations, growth bands, twin boundaries, point defects etc. Normally when the crystal is dissolved in the
solvent, well deined etch pits are formed. The formation of
the etch pits is assumed to be the reverse of growth process23. The surface of the crystals was polished very well before the etching process. The etching studies were carried out on the GZS crystals in order to reveal the dislocations in the crystal. In the present work, water was used as etchant. The photograph was taken with a maximum etching time of 60 s and is presented in Figure 10. It is observed that etch pits are formed to the etching time of 60 seconds. Further increasing the etching time, the pattern remains the same but the numbers of etch pits decrease. While increasing the
etching time observed etch patterns are of well deined shape.
Figure 8. Variation of dielectric loss with log frequency.
Figure 9. Field dependent photoconductivity of grown single crystal.
Figure 10. Etch patterns observed on (1 0 1) plane of GZS.
Etch patterns were photographed under an optical microscope
in the relected light and the observed well deined parallel
5. Conclusion
Bulk sized good quality crystals of Glycine Zinc Sulfate (GZS) were grown by slow evaporation technique.
Orthorhombic structure of the grown crystal was conirmed
by single crystal X-ray diffraction analysis. Powder X-ray
diffraction studies conirmed the crystallinity and structure
of the grown crystals. The UV-Visible transmission spectrum shows excellent transmission in the entire visible region.
The band gap, refractive index, extinction coeficient and
electrical susceptibility were calculated to analyze the optical
property. Second Harmonic Generation (SHG) eficiency of the
GZS is greater than KDP. The microhardness studies indicate that the Vickers hardness number of the crystal increases with the increase in applied load. The dielectric constant and dielectric loss measurements were carried out at different temperatures and frequencies. The photoconductivity studies
conirm that this material has negative photoconductivity
nature. The etching studies were carried to study the formation of etch pits in water solvent. This material exhibits NLO behaviour remarkably due to its better optical and dielectric properties.
References
1. Scheel HJ and Fukuda T, editors. Crystal growth technology. England: John Wiley & Sons; 2003. http://dx.doi.org/10.1002/0470871687.
2. Marder SR, Sohn JE and Stucky GD, editors. Materials for
nonlinear optics. Washington: American Chemical Society;
1991. http://dx.doi.org/10.1021/bk-1991-0455.
3. Aka G, Mougel F, Auge F, Kahn-Harari A, Vivien D, Benitez JM, et al. Overview of the laser and non-linear optical properties of calcium-gadolinium-oxo-borate Ca4GdO(BO3)3. Journal of
Alloys and Compounds. 2000; 303-304:401-408. http://dx.doi.
org/10.1016/S0925-8388(00)00648-4.
4. Pal T, Kar T, Boceli G and Rigi L. Morphology, crystal structure and thermal and spectral studies of semiorganic nonlinear optical crystal LAHClBr. Crystal Growth & Design. 2004; 4(4):743-747. http://dx.doi.org/10.1021/cg0341757. 5. Vijayan N, Ramesh Babu R, Gopalakrishnan R, Dhanuskodi S
and Ramasamy P. Growth of semicarbazone of benzophenone single crystals. Journal of Crystal Growth. 2002; 236(1-3):407-412. http://dx.doi.org/10.1016/S0022-0248(01)02207-2.
6. Rajendran KV, Jayaraman D, Jayavel R and Ramasamy P. Effect of pH on the growth and characterization of L-HFB single crystal. Journal of Crystal Growth. 2003; 254(3-4):461-468. http://dx.doi.org/10.1016/S0022-0248(03)01097-2.
7. Chenthamarai S, Jayaraman D, Ushasree PM, Meera K, Subramanian C and Ramasamy P. Experimental determination of induction period and interfacial energies of pure and nitro doped 4-hydroxyacetophenone single crystals. Materials
Chemistry and Physics. 2000; 64(3):179-183. http://dx.doi.
org/10.1016/S0254-0584(99)00229-1.
8. Fleck M and Bohatý L. Three novel non-centrosymmetric compounds of glycine: glycine lithium sulfate, glycine nickel dichloride dihydrate and glycine zinc sulfate trihydrate. Acta Crystallographica. Section C, Crystal Structure Communications. 2004; 60(Pt 6):m291-m295. http://dx.doi.org/10.1107/ S0108270104009825. PMid:15178854.
9. Suresh S. Growth, optical and electrical studies of the nonlinear optical crystal: glycine thiourea. Optik - International Journal
for Light and Electron Optics. 2014; 125(3):950-953. http://
dx.doi.org/10.1016/j.ijleo.2013.07.131.
10. Suresh S. Studies on the optical and dielectric properties of a zinc thiourea chloride NLO single crystal. Optik - International Journal for Light and Electron Optics. 2014; 125(3):1223-1226. http://dx.doi.org/10.1016/j.ijleo.2013.07.154.
11. Suresh S and Arivuoli D. Growth, theoretical, optical and dielectric properties of L tartaric acid NLO single crystals.
Journal of Optoelectronics and Biomedical Materials.2011;
3:63-68.
12. Lenin M, Balamurugan N and Ramasamy P. Growth and characterization of sulphamic acid single crystals grown by
Sanakaranarayanan-Ramasamy (SR) method. Crystal Research
and Technology. 2007; 42(1):39-43. http://dx.doi.org/10.1002/
crat.200610767.
13. Pandurangan K and Suresh S. Synthesis, growth, and characterization of bisglycine hydrobromide single crystal. Journal of Materials. 2014; 2014:1-7.http://dx.doi.org/10.1155/2014/362678.
14. Koteeswari P, Suresh S and Mani P. Crystal growth, optical and dielectric properties of L-histidine hydrochloride monohydrate nonlinear optical single crystal. Journal of Minerals and Materials
Characterization and Engineering. 2012; 11(08):813-816.
http://dx.doi.org/10.4236/jmmce.2012.118071.
15. Sagadevan S. Investigation on the optical properties of Nonlinear Optical (NLO) single crystal: L-valine zinc hydrochloride.
American Journal of Optics and Photonics. 2014; 2(3):24-27.
http://dx.doi.org/10.11648/j.ajop.20140203.11.
16. Sagadevan S. Growth, optical, mechanical and electrical studies of nonlinear optical single crystal: potassium para-nitrophenolate dihydrate. Science Postprint. 2014; 1(1):2014. http://dx.doi. org/10.14340/spp.2014.07A0001.
17. Sagadevan S and Murugasen P. Studies on optical, mechanical and electrical properties of organic nonlinear optical p-Toluidine p-Toluenesulfonate single crystal. Journal of Crystallization
Process and Technology. 2014; 4(2):99-110. http://dx.doi.
org/10.4236/jcpt.2014.42013.
18. Kurtz SK and Perry TT. A powder technique for the evaluation of nonlinear optical materials. Journal of Applied Physics. 1968; 39(8):3798. http://dx.doi.org/10.1063/1.1656857.
19. Onitsch EM. The present status of testing the hardness of materials. Microscope. 1950; 95:12.
20. Suresh S, Ramanand A, Mani P and Murthyanand K. Growth, structural, optical, mechanical and dielectric properties of glycine sodium nitrate (GSN) single crystal. Journal of Optoelectronics
and Biomedical Materials. 2010; 1(3):129-139.
21. Smyth CP. Dielectric behaviour and structure. New York: McGraw-Hill; 1965. p 132.
22. Balarew C and Duhlev R. Application of the hard and soft acids and bases concept to explain ligand coordination in double salt structures. Journal of Solid State Chemistry. 1984; 55(1):1-6. http://dx.doi.org/10.1016/0022-4596(84)90240-8.
23. Sagadevan S. Studies on optical, mechanical, dielectric properties of bisthiourea nickel bromide NLO single crystal. Optik -
International Journal for Light and Electron Optics. 2014;
125(22):6746-6750. http://dx.doi.org/10.1016/j.ijleo.2014.08.059.
24. Joshi VN. Photoconductivity. New York: Marcel Dekker; 1990.
25. Sagadevan S. Investigations on electrical properties of glycine magnesium chloride single crystal. International Journal of