Studies on Growth, Spectral, Thermal, Mechanical and Optical Properties of
4-Bromoanilinium 4-Methylbenzenesulfonate Crystal: A Third Order Nonlinear Optical
Material
Pillukuruchi Kailasam Sivakumara,b, Saravana Kumarb, Rangasamy Mohan Kumara, Ramajayam
Kanagaduraia, Suresh Sagadevanc*
aDepartment of Physics, Presidency College, Chennai, 600 005, India
bDepartment of Physics, Misrimal Navajee Munoth Jain Engineering College, Chennai, 600 097, India cDepartment of Physics, AMET University, Chennai, 603 112, India
Received: January 24, 2016; Revised: May 25, 2016; Accepted: June 25, 2016
4-Bromoanilinium 4-methylbenzenesulfonate (4BPTS) single crystal was successfully grown from ethanol by slow evaporation method at room temperature. The structure of grown crystal was conirmed by single crystal X–ray difraction studies. The presence of functional groups of grown crystal was conirmed by the Fourier transform infrared spectroscopy (FTIR) spectral analysis. UV– Visible absorption study was performed on the grown crystal to determine the cut-of wavelength. The thermal stability of the grown crystal was investigated from the Thermogravimetric analysis (TGA)/ Diferential thermal analysis (DTA) analysis. The mechanical behaviour of grown crystal was studied by using Vicker’s microhardness test. The third order non-linear optical properties of 4BPTS were investigated by Z-scan technique with He–Ne laser radiation and the corresponding non-linear refractive index and absorption coeicients were also calculated.
Keywords: Single crystal, XRD, Thermal, Micorhardness and Z-scan Technique
1. Introduction
In the present day technologically changing society, non-linear optical (NLO) materials are generally useful in the area of optical data storage, lasers, optical signal processing, second harmonic generation etc. Even though varieties of NLO materials exist, their applications are limited due to physical and chemical properties1. NLO applications
require good quality single crystals which have large NLO coeicient coupled with improved physical parameters. One potentially attractive system, where there is a potential for realizing very large second order non-linear coeicient is based on organic crystals. Organic materials have been receiving much consideration because the NLO responses in this broad class of materials is microscopic in origin, ofering a chance to use theoretical modeling coupled with synthetic lexibility to design and produce novel materials2,3. Further
studies on organic NLO materials have accordingly produced very good materials with highly attractive characteristics. Organic crystals have been widely studied owing to their non-linear optical coeicients being often larger than that of inorganic materials. In addition to large NLO coeicient, an organic NLO crystal should be transparent in the UV region4,5. NLO applications require materials with very
large macroscopic second order susceptibilities which are usually constituted from molecules with large molecular irst hyperpolarizability and oriented in a non-centrosymmetric arrangement6. The majority of the commercial materials for
second order applications are inorganics, particularly for high power use. Organic materials are apparent as being
structurally more diverse and therefore are believed to have more long term promise than inorganics. In the present work, we have investigations on the 4-Bromoanilinium 4-methylbenzenesulfonate (4BPTS) crystals that were grown by slow evaporation technique. The grown crystals were subjected to various characterization methods such as XRD studies, FTIR studies, UV-Visible measurements, TGA/DTA, microhardness and Z-scan technique.
2. Synthesis and crystal growth
growth processes. 4BPTS crystal of dimension about 18× 9 × 9 mm3 was harvested in a growth period of twenty four
days by slow evaporation of the solvent. The photograph of the grown 4BPTS crystal is shown in Figure 1.
Figure 1: Photograph of as grown 4BPTS single crystal.
3. Results and Discussion
3.1. X-ray difraction studies
The unit cell parameters of 4BPTS crystal were found from the single crystal X-ray difraction analysis using a Bruker kappa APEX II single crystal X -ray difractometer with MoKα (λ = 0.71073 Å) radiation. The calculated lattice parameters were a=5.80 Å, b=7.61 Å, c=15.95 Å, α =94.76○,
β=96.04○, γ=92.80○, Volume (V) = 695 Å3. The grown crystal
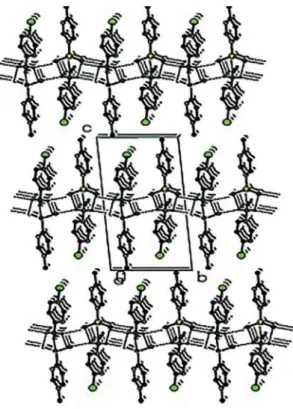
belonged to Triclinic crystal system with space group P. The molecular structure and crystal packing of the 4BPTS were shown in Figures 2 and 3.
Figure 2: The molecular structure of the 4BPTS.
Figure 3: The crystal packing of the 4BPTS.
3.2. Optical Studies
The linear optical absorption property was studied using Perkin Elmer Lambda 35 UV–Vis spectrophotometer. The absorption spectrum recorded for the 4BPTS crystal in the region 400 nm - 900 nm is shown in Figure 4. UV– Vis– NIR spectrum gives information about the structure of the
Figure 4: UV-visible absorption spectrum of 4BPTS crystal.
3.3. FTIR analysis
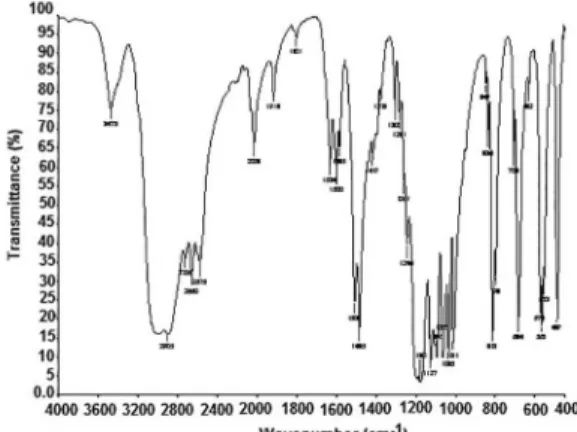
It was learnt that the presence of N–H in various molecules could be correlated with a constant occurrence of absorption bands whose positions were slightly altered from one compound to another; this was because the atomic group vibrated independently of the other groups in the molecule and had its own frequency. The FTIR spectrum of the grown 4BPTS crystal is shown in Figure 5. The N-H stretching vibrations gave rise to a weak band at 3500-3300cm-1. In
the experimental FT-IR spectrum of 4BPTS a weak band was observed at 3473cm-1. The C-H stretching vibrations
of aromatic and hetero aromatic structures occurred8,9 in the
region 3100-2900 cm-1 for asymmetric stretching modes of
vibrations. This permitted the ready identiication of the structure. A strong band was observed at 2905 cm-1 in FT-IR
that could be assigned to C–H stretching respectively. The bands due to C–H in-plane bending vibrations were observed in the region 1000–1300 cm-1. For this compound, the C–H
in-plane bending vibrations were observed at 1127 and 1180 cm-1 in FT-IR spectrum. The C-C stretching modes of the
phenyl group were expected in the range from 1650-1200 cm-1. The actual position of these modes was determined not
mainly by the nature of the substituents but by the form of substitution around the ring10. In the present study, the bands
at 1485 and 1508 cm-1 in the FT-IR spectrum were assigned
to C-C stretching vibration for our 4BTS molecule. Most aromatic Bromo compounds absorb strongly in the region 680–515 cm-1 due to C-Br stretching vibrations. The C-Br
stretching vibration was assigned to the strong mode 566 cm-1 in the infrared spectra. The identiication of C–N and
C N vibrations were a very diicult task, since the mixing of several modes was possible in the region. Silverstein et al.,11 assigned C–N stretching absorption to the region
1266–1382cm−1 for aromatic amines. In the present work,
the bands observed at 1281, 1306, and 1376cm−1 in the FT-IR spectrum were assigned to C–N stretching vibrations.
the temperature range of 100 – 700°C as shown in Figure 6. The TGA curve gives useful information regarding the thermal stability and the composition of the sample under investigation. From the TGA results slight weight loss was observed in the temperature range 100 °C -141°C and it was due to evaporation of moisture as well as water evaporation. The second drastic weight loss was observed in between 141°C – 343°C that was due to boiling as well as slight evaporation of 4BPTS. From the DTA results 219.44°C the endothermic peak was observed, which was due to the melting of 4BPTS.
Figure 5: FTIR spectrum of 4BPTS crystal.
3.4. hermal Studies
The thermal behaviour of the crystal was determined by thermo gravimetric analysis and diferential thermal analysis using an SDTQ6000V8.2 Built 100 Thermal Analyzer at a heating rate of 10C/min in the nitrogen atmosphere in
Figure 6: FTIR spectrum of 4BPTS crystal.
3.5. Vicker’s microhardness test
The structure and the composition of the crystalline solids were inviolably related to the mechanical hardness. Microhardness testing is one of the best methods of understanding the mechanical properties of materials. The microhardness of the grown crystals was measured using a diamond indenter. The well polished crystals were mounted on the platform of the microhardness tester and the load of diferent magnitudes say, 10, 20 gms were applied over a ixed interval of time. The indentation time was ixed as 5 s. When the load was increased to 100 g cracks developed on the smooth surface of the crystal due to the release of internal stress generated during indentation. The Vicker’s microhardness number was calculated using the relation
.
( /
)
( )
H
d
P
kg mm
1 8554
1
V 2
2
=
where P is the applied load in kg and d is the average diagonal length in mm. A graph plotted between hardness number (Hv) and applied load (P) is shown in Figure 7. The igure shows the variation of load (P) with Vicker’s hardness number (Hv) for 4BPTS and it was found that Vicker’s hardness number increased with the applied load. The initial increase in microhardness (Hv) with increasing load is in agreement with the reverse indentation size efect (RISE).
3.6. Z – Scan Studies
Figure 7: Microhardness number VS Load P.
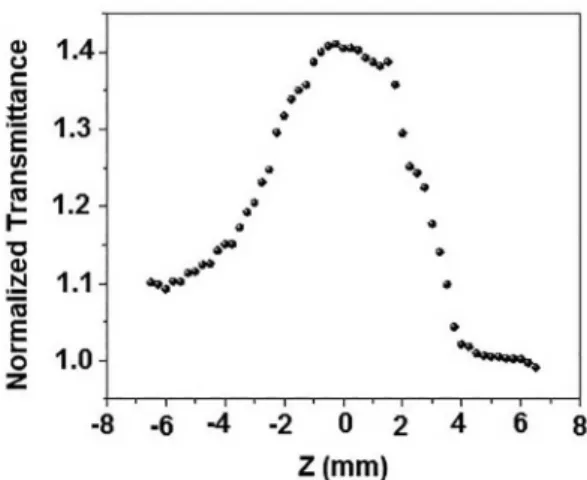
refraction for optical materials. The magnitude and the sign of the non-linear refractive index (n2) and the non-linear absorption coeicient (β) of the crystals were calculated from the Z-scan data12. By placing the sample in diferent positions
with respect to the focus of the beam, the corresponding normalized transmission to the crystal was measured. Because of the light induced non-linearity, the sample’s transmission might increase or decrease, depending on its Z-position with respect to the focal plane. The non-linear absorption coeicient and non-linear optical refraction for the sample were estimated from normalized transmission of corresponding Z-position. The optically polished 1 mm thick crystal sample was ixed in the travel range of 12 mm. The laser light 632.8 nm with power of 20 mW beam from He-Ne laser was used. The input energy and the energy transmitted by the sample were measured using a power meter. The peak followed by a valley of normalized transmittance is the signature for non-linearity of the material13,14. The Z-scan
curves in closed and open aperture modes are illustrated in Figures 8 and 9 respectively. The sample can act as a thin lens of variable focal length, as the sample brought closer to the focus, the irradiance of Gaussian beam increases or decreases depending upon the material absorption and refractive index. From open aperture method, the nonlinear absorption coeicient can be easily calculated from maximum or minimum transmittance curves. It was observed that, the sample transmittance increases while increasing the input intensity of laser beam, which demonstrates the absence of reverse saturation absorption with enhanced strong saturation absorption in 4BPTS crystal. From the closed aperture curve, the prefocal valley to post focal peak coniguration clearly suggests that the title crystal has a positive sign of third order nonlinear refractive index and this behaviour attributed to self focusing efect. This may caused by reduced transmittance and large beam divergence through the far ield aperture, which is an essential property for optical switching applications.
The diference between the peak and valley transmission (DTp-v) is written in terms of the on axis phase shift at the focus as,
.
|
| ( )
T
0 406 1
S
.2
p v
0 25 0
{
D
-=
]
-
g
D
Figure 8: Z-scan open curvature of the 4BPTS.
Figure 9: Z-scan close curvature of the 4BPTS.
where DF0 is the on-axis phase shift at the focus, S is
the linear transmittance aperture and it was calculated using the relation,
( )
exp
S
1
2
r
3
a a 2
2
~
= -
c
-
m
where ra is the radius of aperture and wa is the beam radius at the aperture. The non-linear refractive index (n2) was calculated using closed aperture Z-scan data and it is given by
( )
n
kI L
eff4
20 0
{
D
=
where k is the wavenumber (k = 2π/λ), I0 is the intensity
of the laser beam at the focus (Z = 0) and Lef = {[1- exp (-αL)]/α}is the efective thickness of the sample, α is the linear absorption and L is the thickness of the sample. From the open aperture curve, the non-linear absorption coeicient (β) was estimated from the following relation
( )
I L
T
2 2
5
eff 0
where DT is the peak value at the measured open aperture. The real and the imaginary parts of the third-order non-linear optical susceptibility (c3) were calculated using
the following equations
/
( )
Re
( )3esu
10
C n n
cm w
6
4
0 2 02 2 2
|
=
f
r
-]
g
]
g
^
h
and
/
( )
Im
esu
C n
cm w
4
10
7
( )3
2 2
0 2 02
|
=
f
r
mb
-]
g
^
h
^
h
where ε0 is the vacuum permittivity and C is the velocity
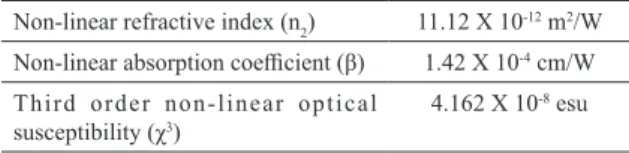
of light in vacuum. The Z-scan measurements revealed that 4BPTS exhibited good third-order non-linear optical properties such as linear refractive index and non-linear absorption coeicient given in Table 1. The values obtained are in good agreement with the earlier reports of piperazinium 4-nitrophenolate monohydrate (PNP): A third order nonlinear optical material15.
Table 1: Results of the z-scan technique.
Non-linear refractive index (n2) 11.12 X 10 -12 m2/W Non-linear absorption coeicient (β) 1.42 X 10⁻⁴ cm/W
T h i r d o r d e r n o n - l i n e a r o p t i c a l susceptibility (χ3)
4.162 X 10⁻⁸ esu
4. Conclusion
Third order non-linear optical 4BPTS single crystals were grown by slow evaporation method. The crystal system and cell parameters were evaluated from single crystal X-ray difraction analysis. The grown crystal belonged to triclinic crystal system with space group P. The necessary functional groups to form the 4BPTS compound were identiied using FT-IR spectral studies. Thermal behaviour of the grown crystal was analysed using TG/DTA. From the DTA results 219.44°C the endothermic peak was observed, which was due to the melting of 4BPTS. The optical absorption spectrum helped to determine the cut-of wavelength and it was found to be 439 nm. From the microhardness measurements, it was observed that the hardness increased with increase of load until saturation occurred. The NLO test was carried out by Z-scan technique and it airmed that 4BPTS exhibited the non-linear optical properties.
6. References
1. Aggarwal MD, Stephens J, Batra AK, Lal RB. Bulk crystal growth and characterization of semiorganic nonlinear optical materials. Journal of Optoelectronics and Advanced Materials. 2003;5(3):555-562.
2. Mohammed AV, Arulappan JAP, Ganesan ST, Suresh S. Analysis on the Growth and Characterization of a Non-linear Optical Single Crystal: L-Cystine Dihydrobromide. Materials Research. 2015;18(4):828-832.
3. Suresh S. Growth, optical, mechanical, dielectric and theoretical properties of picolinium maleate NLO single crystal. Optik - International Journal for Light and Electron Optics. 2014;125(12):2826-2829.
4. Suresh S. Synthesis, growth and characterization of L-threonine zinc acetate (LTZA) NLO single crystal. Optik - International Journal for Light and Electron Optics. 2014;125(16):4547-4551.
5. Nithya N, Mahalakshmi R, Suresh S. Investigation on Physical Properties of Semiorganic Nonlinear Optical Glycine Zinc Sulfate Single Crystal. Materials Research. 2015;18(3):581-587.
6. Azeezaa V, Arulappan JAP, Sunitha TG, Koteeswari P, Suresh S. Growth and characterization of nonlinear optical single crystal: l-cysteine hydrochloride monohydrate (LCB). Acta Physica Polonica A. 2015;123(3):423-430.
7. Suresh S. Optical and electrical studies of non-linear optical crystal: Potassium boro-oxalate. Optik - International Journal for Light and Electron Optics. 2016;127(14):5613-5621. 8. Gunasekaran S, Ponnambalam U, Muthu S, Ponnusamy S.
Vibrational and normal coordinates analysis of Pyrazinamide. Asian Journal of Chemistry. 2004;16(3-4):1513-1518. 9. Fulara J, Nowak MJ, Lapinski L, Leś L, Adamowicz L.
Theoretical and matrix-isolation experimental study of the infrared spectra of 5-azauracil and 6-azauracil. Spectrochimica Acta Part A: Molecular Spectroscopy. 1991;47(5):595-613. 10. Bellamy LJ. The infrared spectra of complex molecule. 3ed.
New York: John Wiley & Sons; 1975. 433p.
11. Silverstein RM, Bassler GC, Morrill TC. Spectrometric Identification of Organic Compounds. New York: John Wiley & Sons; 1981.
12. DeSalvo R, Sheik-Bahae M, Said AA, Hagan DJ, Van Stryland EW. Z-scan measurements of the anisotropy of nonlinear refraction and absorption in crystals. Optics Letters. 1993;18(3):194-196.
13. Subashini A, Kumaravel R, Leela S, Evans HS, Sastikumar D, Ramamurthi K. Synthesis, growth and characterization of 4-bromo-4’chloro benzylidene aniline--a third order non linear optical material. Spectrochimica Acta Part A: Molecular Spectroscopy. 2011;78(3):935-941.
14. Sabari Girisun TC, Dhanuskodi S, Mangalaraj D, Phillip J. Synthesis, growth and characterization of bisthiourea zinc bromide for optical limiting applications. Current Applied Physics. 2011;11(3):838-843.