BEHAVIOUR FOR PREMIUM PRICE EVALUATION
Associate professor Dr. Eng. Evgeny KRYUKOVTransport and Telecommunication Institute, Riga, Latvia Email: [email protected] Dr. Eng. Vladislav MALGIN
Riga, Latvia Email: [email protected] Mag. MBA Irina MALGINA Riga, Latvia Email: [email protected]
Abstract:
The paper deals with an example of the manifestation of the hysteresis in consumers’ behaviour for the Latvian company operating on the market closest to oligopoly and having a local brand name. Based on the quota sample of 332 company stores consumers, their loyalty, willingness to pay for domestic cosmetic products and the propensity to buy habitual products were evaluated. In the survey the unfolding bracketing procedure is used. It is shown that the relationship between the number of loyal consumers and the product price depends on the price increase or decrease and has the form of a hysteresis loop. The width of the hysteresis loop depends on the pricing of a competing company. The range of the premium prices bringing a positive economic impact is determined. The obtained results confirm a considerable influence of the hysteresis effect on consumers’ sensitivity to price changes. The findings can be useful for managers in evaluating a possible revenue growth connected with the premium pricing strategy.
Keywords:willingness to pay, premium pricing, hysteresis, consumers’ behaviour
1. Introduction
For successful sales in the market it is essential to take an advantage of the brand or individual features of products that attract the consumers’ attention. The brand of a company is its asset, which includes the presence of loyal consumers and associations increasing the value of the offered product, such as a prestigious trademark, the place of production, ecological compatibility, etc in the eyes of consumers (Aaker, 1996; Davis, 2002). The loyalty of a consumer to the company possessing a brand enables it to yield additional profit through sales at higher prices, i.e. by introducing a price premium (Sethuraman, 2000; Bondesson, 2012).
Aprice premium determines the size of an addition to the price in relation to the competitive price which consumers are willing to pay for the product of the preferred brand. The product covered by the recognizable brand is more attractive for the consumer, even compared with a
similar product having a lower price (Netemeyer, Krishnan et al, 2004). The presence of the brand is directly related to the willingness of loyal customers to pay a premium price for a product (Aaker, 1996; Netemeyer, Krishnan et al, 2004; Anselmsson, 2007). Therefore, companies managers in their practical activity find it necessary to determine a premium price on a product for a more efficient use of the brand advantages.
Given below are some studies, which, being aimed at forecasting consumers’ response to a price increase, relate the obtained estimation of consumers’ willingness to pay a premium price for specific products.
elasticity of demand and an optimal price premium for accommodation, allowing to increase the revenue of the hotel were determined.
In (Donovan and Nicholls, 2003) a possible price premium for products made from local timber was determined. It is shown that the place of production is a competitive advantage provided the products are sold in Alaska. A survey conducted in the United States has revealed the consumers’ willingness to pay a price premium for local agricultural products in order to support local farmers (Howard and Allen, 2008).
Consumers are observed to have a growing interest in the environmentally responsible business, which may be taken into account while pricing green products
.
For example, in Alaska, consumers are willing to pay a price premium for the products manufactured from standing dead trees of yellow cedar to save the living trees (Donovan, 2004).The majority of consumers in the USA are willing to pay a price premium for clothes made from new types of cotton cultivated within the frames of the national toxic pesticide-free programme aimed at reducing the negative impact environment (Jung and Norum, 2011). Consumers in Northern Italy are also willing to pay a price premium for pesticide-free fresh fruit (Boccaletti and Nardella, 2000).
A consumers’ self-esteem growth, as by buying a particular product, for example, s/he supports certain layers of society or protects environment, should be taken into account. Consumers’ satisfaction with the product moderates a negative reaction to price increase (Homburg, Hoyer et al, 2005). Social environment makes a significant impact on consumers’ willingness to pay a price premium (Mittal and Kamakura, 2001; Oliver, 1999), so do the conditions of a purchase creating an additional emotional pressure (Jensen and Drozdenko, 2008). Therefore, to predict the response to price change not only economic, but also psychological peculiarities of consumers’ behavior should be taken into account.
The aforementioned studies consider the response only to possible price increase. In our view, in real commercial activity the evaluation of consumers’ responsiveness not only to price increase, but also to its subsequent decrease has a considerable value for practitioners. It should be noted that fixing a premium price is a short-term strategy, as a rule. To evaluate the response to price change as to a dynamic process it is advisable to use the hysteretic model of a consumers’ behavior.
2. Hysteretic models of a consumers’ behavior
TThe presence of psychological
limitations in switching from one brand to another is noted by many researchers, for example (Klemperer, 1995; Lambin, 2000). People prefer products from familiar brands that they have used before. Even the fact of the first use of the product of one brand increases its preference among other products.In their studies Simon, 1997; Galloway, 1999; Scheffer, Westley et al, 2003 note the delay in the responsiveness (inertia) to the product characteristics change, its price, in particular, typical for both individual consumers and consumer communities united by common goals, views, place of residence etc.
The substantiation for using hysteretic models to simulate consumers’ non-linear response is given in the studies by Flay, 1978; Oliva, Oliver et al, 1992; Göcke, 2002; Moraru, Juganaru, 2013. Analyzing the dynamics of economic systems it is necessary to take into account their ability to "remember" the previous state, i.e. the hysteresis effect (Cross, Grinfeld et al, 2009).
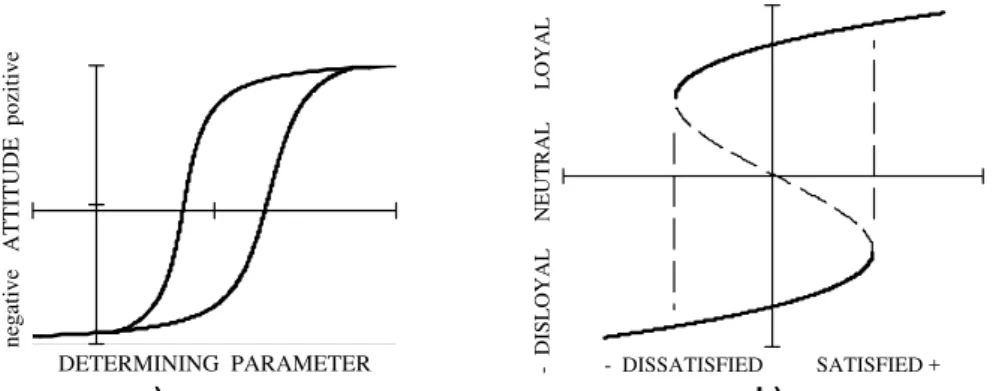
the greatest value for the given segment of consumers, providing very useful results for practical application (Galloway, 1999). To generate a positive or stable- negative attitude to the product, the value of the determining parameter needs to overcome a certain
threshold. The variation of the parameter in the range between the thresholds is not noticed clearly by a consumer keeping his/her previous attitude to this product. The dependence has the form of the hysteresis loop, and is shown on Figure 1,a.
DETERMINING PARAMETER
negative ATTITUDE pozitive
- DISL - DISSATISFIED SATISFIED +
OYAL
NE
UT
RAL
L
OYAL
a) b)
Figure 1. The relationship between determining the parameter of a product and a consumers’ attitude a); the relationship between a consumers’ loyalty and
his post-purchases cumulative satisfaction b). Source: Adapted from Galloway, 1999 and Oliva, Oliver et al, 1992
The catastrophe theory suggests several models including bimodality, and the effect of hysteresis to describe the human behavior involving sudden "catastrophic" changes (Flay, 1978; Oliva, Oliver et al, 1992; Ogden, 1995). In the simplest case a consumers’ loyalty is a function of one parameter – consumers’ cumulative satisfaction. A non-linear relationship between them corresponds to the fold catastrophe and has two thresholds, Figure1,b. When the long-term cumulative satisfaction exceeds a certain threshold, consumers’ loyalty rapidly increases, but below the other threshold loyalty decreases. Between these thresholds, the change of satisfaction has little influence on loyalty, which retains its previous value. Thus, the consumer has a "memory", which is natural for humans.
To simulate the behavior of consumers, who stop buying a product
a) b) Figure 2. The nonideal relay, as the simplest hysteretic transducer for a
consumers’ behavior modeling a); the modeling of a consumers’ community response by parallel connection of nonideal relays b).
The effects of social influence on consumers faced with a choice: to buy/not to buy were explored in (Gordon, Nadal et al, 2005). Depending on the path of price adjustments by the monopolist, computer simulations show hysteretic effects of consumers’ behaviour. The results of computer simulation of oligopolistic market are presented in (Kindinova and Kuznetsova, 2009). The calculated relationships between the demands of product and its price, for different „word of mouth” transfer rates have the form of hysteresis loops.
So, the studies of many authors, some of which are mentioned above, show that the use of the hysteretic model is a well-grounded conclusion and it provides more realistic results.
3. Research object
In spite of the economics globalization, local brands sometimes successfully compete in local markets with world-renowned ones. A somewhat increased price is not critical for consumers’ purchase decision making as to the products of leading brands. More important is the desire to buy a product of specifically this brand, especially if it has a cult status in the given area.In this case company managers have an opportunity of the effective use of the brand advantages by setting a premium price for the product on demand.
This article presents the well-known Latvian company cosmetic products
consumers’ survey results. This company does not only make cosmetic broad-consumption products, but also has an extensive network of their branded stores on the Baltic market. The presence of several competing companies offering similar products in the region, suggests market conditions closest to oligopoly. The creating of a new series of cosmetic products, where various organic ingredients are widely used, has raised a great interest among consumers and resulted in the sales growth. It should be noted that the products manufactured by the company are classified as goods for daily use. This fact increases the importance of customer’s loyalty to the brand because it implies regular purchases of products.
4. Research design
In accordance with the study objectives, a questionnaire for buyers under survey was designed. The questions to respondents were grouped into the following four sections:
- the evaluation of customers’ loyalty to the given company;
- willingness to pay a premium price for the cosmetic products of company;
- a respondents' attitude to statements connected with the presence of hysteresis with respect to familiar products purchases;
- evaluation of the difference in prices, enhancing the interest in purchasing similar products of another company.
For the practical use of the information obtained in the survey the level of the respondents’ loyalty as a whole is important. The results obtained by (Davis, 2002) show that consumers with a high degree of brand loyalty, bring most of the company's revenue. The purchasing activity of the most loyal customers significantly exceeds the activity of other consumer groups and gives a possibility of charging a price premium.
To evaluate consumers’ loyalty the methodology proposed in (Reicheld, 2003) was used. The respondents were asked the following question: "Coud you, please, rate according to the scale from 0 to 10 how likely you are to recommend this product to your friends and colleagues?". According to the answers, all the respondents are divided into three groups. The first group with the rating of 10 or 9 are the company "promoters" who enthusiastically recommend the company product to their friends and acquaintances. The second group with the rating of 8 or 7 may be referred to as "neutrals". The third group with the rating of 6 or less, belong to „critics”, respectively. The net degree of consumers’ loalty termed as Net Promoter Score (NPS) is calculated as the difference between the percentage
correspondance between "promoters" and "critics." According to (Reicheld, 2003) loyalty is a consumers’ ability to risk their own reputation by recommending this or that brand to their friends and acquaintances. Net Promoter Score is clear, and it has a practical applicability at all levels from top managers to sales agents.
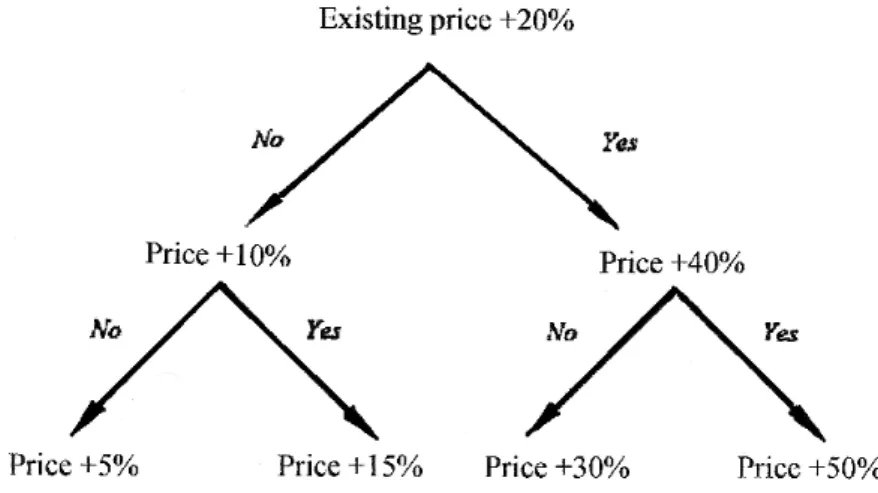
purchase. Thus, the sequence that includes no more than three questions gives us an evaluation of their willingness
to pay for the cosmetic products of the given company.
Figure 3. The sequence of questions based on the unfolding bracketing procedure.
Since the average cost of purchases ranged from 10 to 25 euros (see Table 1), we assumed that one step of additives of 5% or 10% is sufficient. In our view, for an ordinary customer it would be difficult to evaluate his choice when the price changes within less than one euro. Moreover, it was assumed that consumers’ income does not play an essential role in their purchasing this type of goods. Therefore, the question on income, often causing confusion among respondents, was not asked.
Further, the respondent was asked a cluster of four questions aimed at enabling him/her to express his/her agreement on the statements connected with the presence of the hysteresis effect with respect to habitual producs purchases of the preferred brand. The respondents were asked to evaluate their attitude to the offered statements (see Table 2). The five-point Likert scale was used.
The aforementioned maximal surcharge that the respondents have expressed their willingness to pay, evaluates the upper switching
threshold
β
j in the hysteretic model of aconsumers’ behavior (Figure 2.a) in relation to the product of this company.
5. Research results
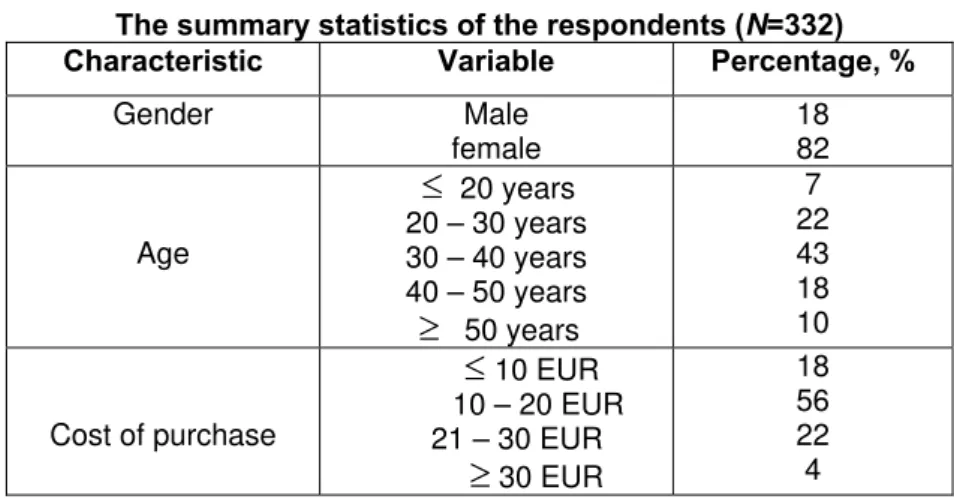
The survey was conducted among consumers in the company stores at the moment of the purchase payment. To obtain a representative sample of respondents the quotas made up on the company recommendations about the tentative gender and age composition of their consumers were used. Throughout the survey the responses from 350
respondents were obtained. The responses received from 18 respondents were incomplete, and the information received from them was not used. The general demographic characteristics of the 332 respondents, corresponding to the predetermined quotas, as well as the distribution of the cost purchases made by them are shown in Table 1.
Table1 The summary statistics of the respondents (N=332)
Characteristic Variable Percentage, %
Gender Male
female
18 82
Age
≤
20 years 20 – 30 years 30 – 40 years 40 – 50 years≥
50 years7 22 43 18 10
Cost of purchase
≤
10 EUR 10 – 20 EUR21 – 30 EUR
≥
30 EUR18 56 22 4
The results of consumers’ loyalty evaluation according to the Reicheld’s (Reicheld, 2003) method are shown in Table 2. It follows from the survey results that a considerable number of the respondents are loyal to the company's brand. The NPS index value is +30.3, which characterises a company with a stable growth.
Table 3 shows the data on the maximum value of a price premium that
the respondents have expressed their willingness to pay for the picked cosmetic products. About half of the respondents were willing to pay the sum from 20% to 30% more than the existing price for the picked products. In our opinion, the willingness to pay this high enough premium can be explained by the relatively low cost of the products of this category.
Table 2. The respondents’ loyalty evaluation by the Reicheld’s method
Promoters Neutrals Detractors Index NPS
Table 3. Willingness to pay (WTP) expressed by the respondents for
the company cosmetics Respondents’
percentage
WTP
3.9% None
1.2% +5 %
2.4% +10 %
3.3% +15 %
10.6% +20 %
8.7% +25 %
32.0% +30%
27.1% +40%
6.6% +50%
4.2%
≥
60%Table 4. Respondents’ sensitivity to increase the company
cosmetics prices Premium
price
Respondents’ percentage
Midpoint elasticity
None 100% -
+5 % 96.1% -0.82
+10 % 94.9% -0.55
+15 % 92.5% -0.56
+20 % 89.2% -0.63
+25 % 78.6% -1.08
+30% 69.9% -1.36
+40% 37.9% -2.70
+50% 10.8% -
+
60% 4.2% -
Stating the maximum value of the price premium for the picked cosmetic products during the survey, the respondents imply that at the further price increase they will stop buying cosmetic goods from this company and switch to the consumption of similar products from a competing company. Consequently, the willingness to pay a maximum price premium expressed by a respondent yields an evaluation of the upper switching threshold
β
j in the hystereticmodel of his/her behavior. The more product prices are increased, the more consumers „are excluded” from the process of repeat purchases of the given company products, „switching” to competitors' products. The results given in Table 4 present the number of consumers which will remain loyal and will continue to buy cosmetic products of this company with the respective price increase. This data were used to reveal the dependence displaying the
consumers’ sensitivity to the price increase on the company cosmetic product presented as curve 1 in Figure 5.
1 1.05 1.1 1.15 1.2 1.25 1.3 0.2
0.4 0.6 0.8 1 1.2 1.4
RELATIVE GROWTH OF PRICE
MIDP
OINT ELAS
TIC
ITY
0.95 1 1.05 1.1 1.15 1.2 1.25 1.3 0.2
0.4 0.6 0.8 1 1.2 1.4
RELATIVE GROWTH OF PRICE
EVALUATION OF RELATIVE REVENUE
а) b)
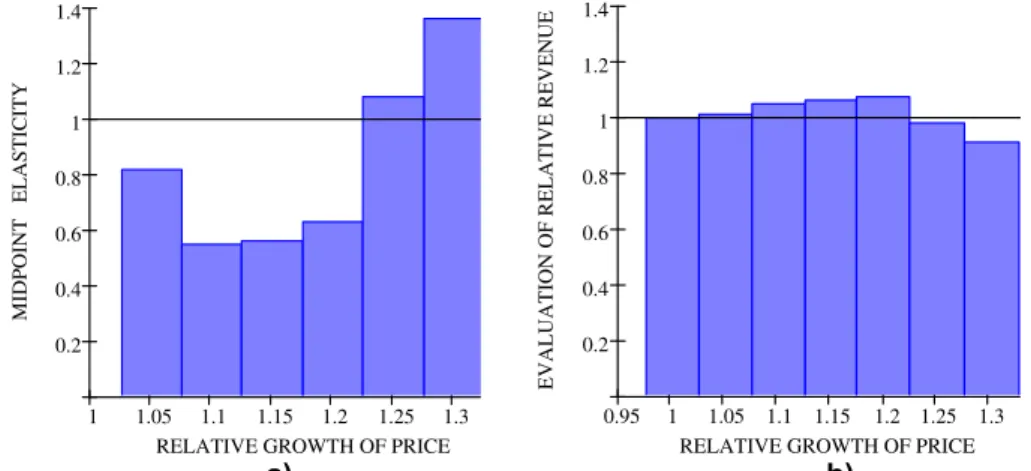
Figure 4. The dependence of elasticity a) and revenue b) from the price growth.
Table 5. The mean rates of the respondents’ perceptions concerning hysteresis in their behaviour. Cronbach’s alpha
α
= 0.81.Statements Mean
Standard
deviation
It makes sense to buy this purchased brand instead of
another brand, even if they are the same; 4.27 0.81 I have experience using this brand and I would still use it
again even if occasionally the product seems not good enough
3.73 0.94
Even if another brand has the same features as this purchased brand, I would prefer to buy the customary brand.
3.10 0.79
I prefer the customary brand, but I can switch to another
brand but there should be a good reason for this 4.13 0.71
Scale: 1=strongly disagree, 2=disagree, 3=neutral, 4=agree, 5=strongly agree.
To confirm the assumption of the respondents’ predisposition to familiar brand products purchases and the necessity of the „compelling” reasons for switching to products of another brand, they were asked to rate their personal consent with the statements given in Table 5. The respondents’ consent with the statements given in the survey assumes the presence of hysteresis in their behavior as consumers. The evaluation was performed against the five-point Likert scale. Proceeding from the responses the mean and the standard deviation value for the respondents’ ratio to each statement were calculated. The obtained results allow us to state the respondents’ consent with the given
statements and confirm the possibility of modelling their behaviour using the hysteretic model. The Cronbach alpha coefficient value
α
= 0.81 allows to consider the respondents’ internal rates within this construct rather consistent.of the group of respondents (21.4% out of the total number in accordance with Table 3), who have expressed a willingness to pay a price premium not higher than 20%. This group was emphasised due to their higher sensitivity to price increase. It is most likely that, in case of a possible price increase, it will be the consumers from this group who will be the first „to switch” to a competing company products purchases.
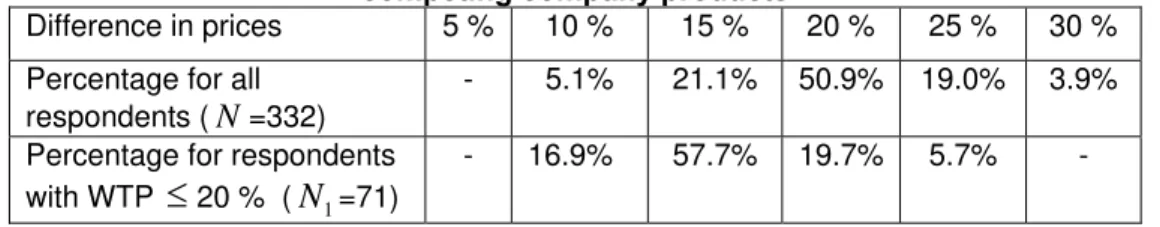
The value of the difference in price that consumers have marked as a possible excuse the for refusal to purchase customary products and switch to a competing company products purchase obtained as a result of the
survey is used in this article only for the
evaluation of the lower threshold
α
j in thehysteretic model, Figure 2, a. The obtained values of the difference in price are included as a component into a broader concept of psychological cost of switching (Klemperer, 1995). A detailed analysis of the possible reasons for consumers’ switching from purchasing products of one brand to another, as well as the parameters determining this process and including the concept of the switching cost is given, for example, in the studies by Klemperer and Lambin (Klemperer, 1995; Lambin, 2000).
Table 6. The difference in price, which is a stimulus for the purchase of a competing company products
Difference in prices 5 % 10 % 15 % 20 % 25 % 30 %
Percentage for all respondents (
N
=332)- 5.1% 21.1% 50.9% 19.0% 3.9%
Percentage for respondents with WTP
≤
20 % (N
1=71)- 16.9% 57.7% 19.7% 5.7% -
6. Evaluation of the consumers’ response based on the hysteretic model
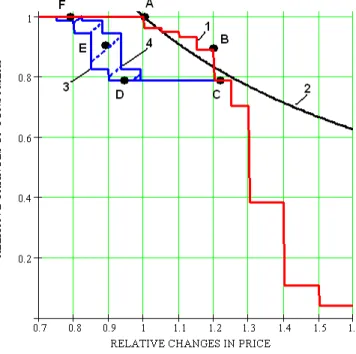
Let us consider the influence of hysteresis in consumers’ behavior on the example of the market, having the structure of duopoly (a particular case of oligopoly). When there are two competing producers on the market, their actions significantly influence each other. Let us assume that the initial prices for the products of both competing companies were similar (Figure 5, point A). Supposing the company for which the survey had been conducted increased the prices of its products by 23% (point C). In this case, 21.4% of the consumers who have expressed the willingness to pay no more than 20% (see in Table 3) will start buying the products of a competing company at a price that has not changed. Let us assume that the first company sets an aim to return them only by price decrease without using other marketing practices. To achieve this, in accordance
Figure 5. The consumers’ sensitivity to price increase (curve 1) and subsequent decrease (curves 3 and 4). The shaded area depicts the influence of competing
company price changes for the duopoly market.
The dependence depicted by curve 1 in Figure 5, demonstrates the consumers’ sensitivity only to price increase. Restoring the consumers’ number, as a response to price decrease, will be taking place at a much slower rate. The decrease in the number of consumers at the price increase occurs as shown along the lines A-B-C. The
increase in the number of consumers during the subsequent price decrease occurs along the lines D-E-F. Moreover,
its position is more precisely determined by the price of a similar product of a competing company.
The area, in which a positive economic effect from the price increase is possible, lies above curve 2 in Figure 5. The maximum increase in the gross revenue is achieved by increasing the price by 20%, Figure 4, b. But, the further price increase leads to a significant decrease in the number of consumers keeping to purchase the company products. The data on the respondents’
willingness to pay a price premium are based on their personal idea and may somewhat change depending on their personal preferences or the social environment influence. Restoring the number of consumers because of the presence of hysteresis in their behavior requires considerable efforts.Therefore, it seems reasonable to recommend the value of the premium price of not more than 15%, notwithstanding the fact that it reduces a positive effect from its introduction.
Undoubtedly, the consumers’ reaction on the market depends on many factors and is expressed in a more complex form. However, it seems very important that the data obtained confirm its hysteretic character. This fact should be considered in solving practical problems of marketing.
7. Conclusion
products consumers’ survey results. The aim of the survey was to evaluate their response to a possible price increase. The willingness to pay a price premium for widely used branded cosmetic products is determined, which allowed to obtain the value of the dependence of the loyal consumers’ number decrease at the price increase. For a particular case (the duopoly market) the restoration of the consumers’ number at the subsequent price decrease was considered. On the whole, the obtained dependence has the form of the hysteresis loop. It is shown that the width of the hysteresis loop is influenced by the pricing policy of the competing company. A high level of the company brand loyalty (index NPS = +30.3), adds credibility to the evaluation of consumers’ sensitivity to price changes obtained as a result of the survey.
For practitioners it is necessary to take into account the hysteresis in consumer behavior when evaluating a possible revenue growth related to the use of premium pricing strategy. The premium price increase to the degree that significantly reduces the number of loyal consumers should be avoided because it will require a considerable effort to return them. It is expedient to accompany the price increase by additional marketing actions with the purpose to moderate consumers’ negative emotions.
It should be noted that consumers’ willingness to pay and the hysteresis model parameters evaluation reflect the respondents’ opinions only by the moment of the survey. Such evaluations are not permanent and are subject to change. Any person has a free will and emotions that may vary both for personal reasons and under the influence of social environment. However, the cumulative reaction of consumer community varies more slowly. This fact allows to use the data of such surveys in marketing to determine short-term strategies. Making regular surveys allows tracking possible changes in consumers’ loyalty to a company products and take them into account in the marketing policy.
The research of processes in current business environment leads to the necessity to take into account a non-linear type of interaction between market participants to implement a more realistic simulation of dynamic processes. The relations between a supplier and a consumer may vary in the course of time both in the direction of development and the reduction of cooperation due to different factors. Therefore, in our opinion, the effect of hysteresis taking into consideration consumers’ real behaviour should find its reflection in the majority of traditional marketing dependencies.
REFERENCES
Aaker, D.A. (1996), Building Strong Brands. New York: Free Press, NY, 380 p.
Anselmsson, J., Johansson, U., Persson, N. (2007), “Understanding price premium for grocery products: a conceptual model of customer-based brand equity,” Journal of
Product & Brand Management, 16 (6), 401–414.
Bondesson, N. (2012), “Brand Image Antecedents of Loyalty and Price Premium in Business Markets”, Business and Management Research, 1 (1), 32-47.
Boccaletti, S., Nardella, M. (2000), “Consumer willingness to pay for pesticide-free fresh fruit and vegetables in Italy”, International Food and Agribusiness Management
Review, 3, 297–310.
Davis, S. (2002), "Brand Asset Management: how businesses can profit from the power of brand", Journal of Consumer Marketing,19 (4), 351–358.
Donovan, G.H., Nicholls, D.L. (2003), Estimating consumer willingness to pay a price
premium for Alaska secondary wood products, Research Paper PNWRP-553.
Portland, OR: U.S. Department of Agriculture, Forest Service, Pacific Northwest Research Station.
Donovan, G.H. (2004), “Consumer willingness to pay a price premium for standing-dead Alaska yellow-cedar”, Forest Products Journal, 54 (5), 38-42.
Flay, B.R. (1978), “Catastrophe theory in social psychology: Some applications to attitudes and social behavior”, Behavioral Science, 23 (4), 335–350.
Galloway, L. (1999), „Hysteresis: a model of consumer behaviour?”, Managing Service
Quality, 9 (5), 360- 370.
Gordon, M.B., Nadal, J.P., Phan, D. and Vannimenus, J. (2005), “Seller's dilemma due to social interactions between customers”, Physica A, 356(2-4), 628-640.
Göcke, M. (2002), “Various Concepts of Hysteresis Applied in Economics“, Journal of
Economic Surveys, 16(2), 167-188.
Homburg, C., Hoyer, W.D. and Koschate, N. (2005), „Customers’ Reactions to Price Increases: Do Customer Satisfaction and Perceived Motive Fairness Matter?”
Journal of the Academy of Marketing Science, 33(1), 36- 49.
Howard, P.H., Allen, P. (2008), “Consumer willingness to pay for domestic ‘fair trade’”,
Renewable Agriculture and Food Systems, 23(3), 235–242.
Jensen, M., Drozdenko, R. (2008), "The changing price of brand loyalty under perceived time pressure", Journal of Product & Brand Management, 17 (2). 115 – 120.
Jung, E., Norum, P.S. (2011), "Willingness to pay for socially responsible products: case of cotton apparel", Journal of Consumer Marketing, 28(5), 344 – 353.
Kindinova, V.V., Kuznetsova, E.V. (2009), “System Dynamics in the Problems of Imitation Modelling of Duopoly Market” (In Russian), Moscow: Vestnik MAI, 16 (7), 96–103.
Klemperer, P. (1995), „Competition when Consumers have Switching Costs: An Overview with Applications to Industrial Organization, Macroeconomics, and International Trade”, Review of Economic Studies, 62, 515-539.
Lambin J.J. (2000), Market-driven management. Strategic and Operational Marketing, London: Palmgrave, MacMillan Press.
Lipovetsky S., Magnan S., Zanetti-Polzi, A. (2011), “Pricing Models in Marketing Research”, Intelligent Information Management, 3 (5), 167-174.
Mittal, V., Kamakura, W. (2001), “Satisfaction, Repurchase Intent, and Repurchase Behavior: Investigating the Moderating Effect of Customer Characteristics”,
Journal of Marketing Research, 38 (1), 131-143.
Moraru, A. D., Juganaru, I.-D. (2013), “Consumer Behavioural: Does History Matter?”,
Revista Economica, 65 (1), 121 -128.
Ogden, H.J., Turner, R.E. (1995), “Hysteresis in Buyer Attitude toward Repeated Transactions”, Journal of Consumer Satisfaction, Dissatisfaction and Complaining
Behavior, 8, 78-84.
Oliva, T. A., Oliver, R. L. and MacMillan, I. C. (1992), „A Catastrophe Model for Developing Service Satisfaction Strategies”, Journal of Marketing, 56 (3), 13-83.
Oliver, R. L. (1999), “Whence Consumer Loyalty?” Journal of Marketing, 69, 33-44.
Paulin, G. (2003), “Introducing Brackets: Quality in the Consumer Expenditure Interview Survey”, Consumer Expenditure Survey Anthology, 21-24.
Reicheld, F.F. (2003), “The one number you need to grow”, Harward Business Review, December, 46-54.
Scheffer, M., Westley, F., Brock, W. (2003), “Slow Response of Societies to New Problems: Causes and Costs”, Ecosystems, 6 (5), 493-502.
Sethuraman, Raj (2000), “What Makes Consumers Pay More for National Brands Than for Store Brands: Image or Quality?” Report No. 00-110, Marketing Science Institute Paper Series, Cambridge, MA.
Simon, H. (1997), „Hysteresis in Marketing – A New Phenomenon?”, Sloan
Management Review , 38 (3), 60.
Svensson, P., Rodwell, L., Attrill, M. J. (2008), “Hotel managed marine reserves: A willingness to pay survey”, Ocean & Coastal Management, 51 (12), 854–861.
Twomey, C. (2008), „Hysteresis in consumer markets with focus on the mobile communications market”, Journal of Physics: Conference Series, International
workshop on multi-rate processes and hysteresis, 138, 012027.