A Work Project, presented as part of the requirements for the Award of a Masters Degree
in Finance from the Faculdade de Economia da Universidade Nova de Lisboa.
Bank-firm relationships and financial crisis
Pedro Afonso Gomes António N68
A Project carried out on the finance course, with the supervision of:
Professor Miguel Ferreira
Bank-firm relationships and financial crises
Abstract
This Working project examines if the shock of financial events, during the recent
financial crisis, impacted differently on bank-dependent firms and firms with access to the
public debt market. I devote a special attention to the Lehman Brothers bankruptcy event
and its effect on U.S. and European firms. Given the global integration of the financial
sector, I investigate the propagation of financial shocks from one economy to another. I
also study the impact of Central Banks monetary policy decisions and the biggest bailout
of $ 700 billion to the U.S. financial sector on bank-dependent firms.
1. Introduction
–
General overview
The financial system is the heart of an economy, so it is important to understand the
credit relationships through different economic agents. The credit is extended among firms
(trade credit), from banks to firms (loans), and among banks (interbank credit). Given
these financial linkages, if firms in the bottom level (retailers) or upper level (providers of
primary goods) go bankrupt, or if a bank goes bankrupt or even if the entire banking
system collapses, we can observe a chain of sequential failures (domino effect) and in a
extreme case an avalanche of bankruptcies (Battistona, Gattib, Gallegatic, Greenwaldd,
Stiglitzd 2007).
I developed this paper with special interest on the last two credit channels using the
actual financial crises, I tested if a shock from a bank, through the banking system, affects
with the same intensity bank-dependent firms and firms that have access to the public debt
market. This paper also tests how sensible economies are to the shocks transmission from
one economy to another.
I do not intend to explain the cause of the recent crisis, denominated subprime
mortgage crisis, neither the moral hazard friction descendant from the financial
instruments from which banks got such losses, the so called toxic assets. Neither will I
discuss the extraordinary tools used by Central Banks, specially the FED, to solve the
crisis, e.g. the introduction of a special lending facility to other institutions out of the
conventional banking system.
The way I conducted this paper is to sort firms into two groups, bank-dependent
firms and rated firms and to compare if their performance is economically and statistically
different in the period, for different events.
First, I began by examining the event known to have triggered the crises, the fall of
Lehman Brothers on September 15, 2008, on two economies, U.S. and Europe.
Then, I extend my study to earnings announcement of 28 banks, half belonging to
each economy. The criterion of selection was the rank of
“W
ritedowns & Credit Loss
”
and
problematic banks that were merged, acquired or bankrupted during the crisis period. This
empirical analysis has two special interests: which banks affected the financial system and
consequently if these shocks affected bank-dependent firms and rated firms differently in
their own economy? And if these shocks had a contagious effect on overseas markets?
Finally, I am interested in the market reactions to the biggest bailout of $700 billion
to the US financial system and if the monetary policy decisions of Central Banks had
effect on these two groups of firms.
The paper is organized as follows. In the next section, I present related research.
Section 3 describes the data and the methodology. Section 4 presents the empirical results.
Section 5 presents the conclusions of the paper.
2. Related research
All the Work Project is constructed on the Event-study Analysis. This approach is
known to be used for the first time in 1933 by Dolley, when he examined the behavior of
firms´ stock prices around the day of the split. More recently, since the 1980s, event study
methodology has been used more often and became an important part of financial
literature. In the vast finance field, we can find several examples using this approach,
studying mergers and acquisitions, earnings announcement, issues of new securities,
event study comes from the fact that the magnitude of the abnormal provides us with a
quantity measure of the unanticipated impact of a
specific event on the wealth of firm’s
claimholders.
Kho, and Stulz (1999) examined the contagion and impact of Asian crisis across four
Western countries (US, UK, France, Germany) and six Asian countries (Japan, Korea,
Indonesia, Thailand, Malaysia, Philippines). They concluded that Western banks were not
significantly affected and their performance did not outperform their respective market
and IMF programs had no positive effect on reducing systemic risk.
Kho, Dong Lee and Stulz (2000), extended the research to other emerging market
(Brazil, Mexico, Russia and Korea) and include an analysis on LTCM crisis. They
concluded that the market distinguished well banks with exposure to a crisis country from
the others and that only banks participated in the LTCM rescue were affected with no
significant contagion to the banking sector.
Chava and Purnanandam (2009), is the paper that relates the most to my work,
because it focus mainly on a contraction on the supply function of credit, trying to isolate
this shock by comparing the performance of bank-dependent and rated firms. They study
the exogenous shock to the U.S. banking system during the Russian crisis of fall 1998 and
they concluded that bank-dependent firms lost higher market value as compared to firms
with access to public debt market, facing value-relevant frictions in raising external
capital.
Based on Brandt, Kishore, Santa-Clara and Venkatachalam (2008) study we learned
that during the day of a company´s earnings release, companies disclose additional
relevant information besides earnings, such as sales, margins, investment, and other
forward-looking information, that will be incorporated into stock prices at that time. Using
a dummy variable, I will try to capture if the market reaction to that specific earnings
announcement event (where all the above information is released) affects the two groups
differently.
There are many methods to conduct an event-study but the ones that I chose are
those based on the papers of Kho and Stulz (1999), Kho, Dong Lee and Stulz (2000) and
Chava and Purnanandam (2009).
3. Data and methodology
The data I used spans 2
nd
January 2007 to 31
st
May 2009 and all data was extracted
from Bloomberg terminal.
The U.S. market index is represented by 475 firms of the S&P500 (due to the lack of
data on all 500 companies), with a market cap of $ 12.213.477.580
(€
9.287.815.650),
where 73 are financial firms with a market cap of $ 2.474.796.260
(€
1.881.974.342) in
December 29, 2006.
The European market index is constructed using the main 12 European markets,
which are CAC40 (France), AEX25 (Netherland), Bel20 (Belgium), DAX40 (German),
IBEX35 (Spain), FTSE100 (United Kingdom), SMI20 (Swiss), Omx30 (Sweden), KFX20
(Denmark), HEX25 (Finland), OBX (Norway) and PSI20 (Portugal). The European
market comprises a total of 392, but only 371 are included (also due to the lack of data on
all companies)
with a market cap of € 7.187.
057.709, where 81 are financial firms with a
market cap of € 1.892.647.
050 in December 29, 2006. Only days where 95% of the totals
Rated and bank-dependent portfolios are computed using only non-financial
companies. Rated companies are all that have rating within 01.01.2007 and 01.08.2008,
using a Bloomberg ticket RATC and selecting by range of dates.
The days of earnings announcement and monetary policy decisions are taken from
their own web sites. The period of study goes from the third quarter of 2007 to the first
quarter of 2009. Although, the US and European Market only trade simultaneously during,
at most, 2 hours, an event taking place on the day t in the U.S. might only be incorporated
in stock prices in Europe on day t+1. Another reason to account for this delay is that the
contemporaneous correlation between U.S and European market is about 61% and the
correlation that the U.S market leads the European Market is about 32%.
The World rank of “Writedowns & Credit Loss vs. Capital R
aise
d” extracted from
Bloomberg, using the ticket WDCI, is present in appendix A. In appendix C, I show the
chronology of events.
The value-
weighted indices were constructed using the companies’ market caps as
weights taken at 29
th
December 2006. In European countries where Euro is not the
currency, all weights were converted to Euros.
There are different ways to conduct an event study, among them I chose two
methods both in short-horizon, with daily data, and both methods are estimated using
ordinary least squared regressions. The event of interest might take place in an individual
day, different days or during an event window, which is a cluster around a particular date
t=0.
First method, based on Chava and Purnanandam (2009), is a cross-section
aggregation that seeks to test the abnormality of returns around the specific event. In my
case, the event of interest is the fall of Lehman Brothers in September 15, 2008.
Firstly, I regressed each firm
’s
daily returns on the respective continental
value-weighted market index using the sample from January 3, 2007 to July 18, 2008, 40 trading
days prior the event:
Rit
= α + β*R
mt
+ ε
t (1)
Then, I get the abnormal returns from the following function, for the days around the
event:
ε
it = Rit
–
E[Rit | Xt] (2)
W
here ε
it, Rit and E(Rit) are the abnormal, actual and normal returns, respectively,
for time period t. Xt is the conditioning information for the normal performance model,
which in this case, the market model.
In order to measure the cumulative abnormal return explained by supply of
bank-loans shock, I estimate the following cross-sectional regression model:
ε
it
=
β
0
+
β
1
∗ γ
i
+
θ
k
K
k=1
𝑚
𝑡
=
𝑛
∗ 𝑋
𝑖
+
𝜐
𝑖
(3)
Where
γ
i is the dummy variable taking a value of 1 if the firm is bank-dependent and
0 otherwise. Xi is a set of control variables that allow me to control for size, risk growth
opportunities, and default risk effects on stock returns. (n and m define the event window;
K is the number of control variables). Detail about the control variables that are present in
Now I get the market model adjusted stock return for which firm, during the event of
interest. This regression allows me to compare if there is any different abnormal return
between bank-dependent and rated firms.
The second method, based on Kho and Stulz (1999) and Kho, Dong Lee and Stulz
(2000), is a time
–
series aggregation that allows me to measure directly the abnormal
return of each the event day. First, I sorted portfolios of bank-dependent firms and Rated
firms separately, and then I took the difference between these two portfolios (Rpt) and
estimate the following regression model:
𝑅
𝑝𝑡
=
𝛼
+
𝛽 ∗ 𝑅
𝑚𝑡
+
𝐽
𝑗
=1
𝐷
𝑗
∗ 𝛿
𝑗𝑡
+
𝜖
𝑡
(4)
α, β, δ
jt and
𝜖
𝑡
are the constant, market beta, dummy variable taking a value of 1 for
each j-th event day. My goal is to search for which events affected differently these two
types of firms, assuming that market impounds all the new information in stock prices
immediately, according to market efficiency theory.
I conducted the exercise for equally-weighted and value-weighted portfolios to see if
big and small firms are affected by the same events and with the same intensity. I
constructed financial portfolios for the two economies and regressed them using also
equation (4), to see if the effect of these events were affected through the shock on the
entire financial system. I constructed equally-weighted to account for systemic risk that
should affect all banks and value-weighted portfolios, where large banks dominate, to
account for the effects on the most significant part of the financial system.
Both methods test if there is a significant difference in abnormal returns due to a
firm being bank-
dependent or rated, coefficient β
1 in the first method and coefficients
D
j
in the second method. I performed the t-test to validate the above hypothesis, where in H0
the relevant coefficient is equal to zero, and H1 otherwise. I am assuming that abnormal
returns are normally distributed and independent in cross-section or time-series, relying on
the asymptotic property of the central limit theorem.
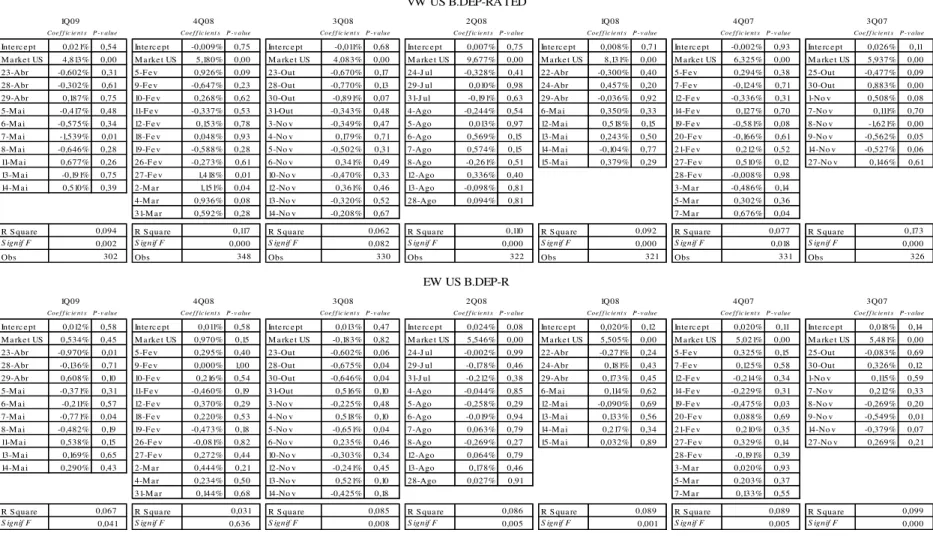
4. Empirical results
4.1 Lehman Brothers
’
bankruptcy event
Here I present the results of the effect of Lehman Brothers
’
bankruptcy
announcement on the two groups described above. Using the first method, I conducted a
study of different event windows to see if bank-dependent firms performed differently
from rated firms around the event on the U.S and European economies.
4.1.1 The impact of Lehman Brothers bankruptcy event on U.S. economy
In table 1, I provide the regressions
’
results for three models. All models include
eight industry fixed effect using B
loomberg’
s excel code
“
industry_sector
”. Model 1
,
besides industry fixed effects, only includes a dummy variable of bank dependence, where
bank-dependent firms is equal to one and equal to zero on rated firms. During the periods
2 days before and the following 3 and 5 days, bank dependent firms earned significant
lower returns than rated firms, with -0,591%, -1,35%, and -1,349% respectively. In the
day of the event, bank-dependent performed slightly better than the rated firms with a
positive difference in returns of 0,488%. In Model 2, I included several additional
variables to account for firms specific characteristic, controlling for revenue, price to book
ratio, and leverage. I verified that the difference in returns from these two groups
impressively increases during the periods of 3 and 5 days after the event for 1,483% and
-1,799% respectively. I also show that firms with prior year high revenues had worse
results. The 7 days around the event, 3 days prior, the day of the event and 3 days after, is
also very significant with a -1,904% lower returns for bank-dependent firms.
In Model 3 I added the ratio ebitda to sales, the prior year´s stock return
(momentum), and the z-score to account for firm´s default risk. Accounting for these
additional control variables makes the difference between the two groups more
pronounced, with the 7 days around the event, the 3 and 5 days after the event reaching the
-2,202%, -1,860% and -1,954%.
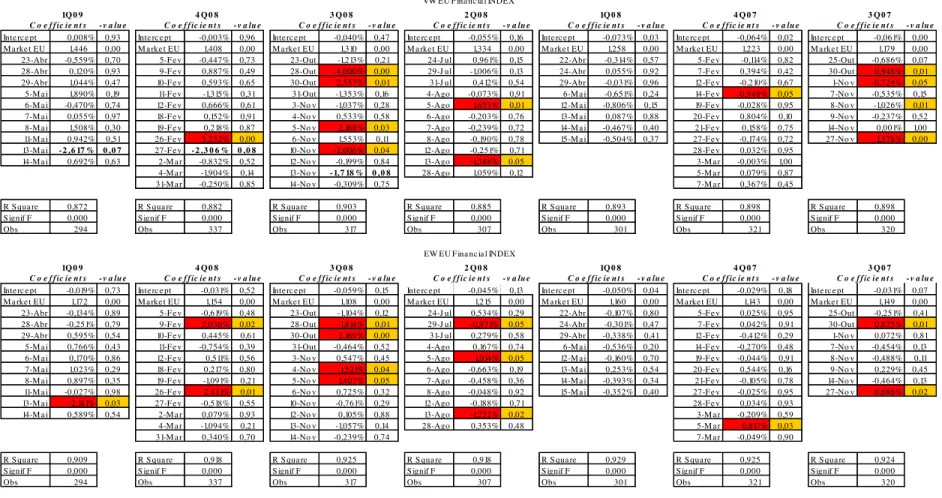
4.1.2 The impact of Lehman Brothers bankruptcy event on European economy
Using the same three models, I am interested to see if this U.S. event had a
significant impact on these two groups of European firms. I present the results in table 2.
Model 1 surprisingly shows that after the event of Lehman brothers the bank-dependent
firms performed better than rated firms, but the results are not significant at a conventional
level. An interesting observation is that the 5, 4 and 3 days prior the event, the returns on
these two groups was highly significantly different with bank-dependent presenting lower
results than rated firms, -1,837%, -1,984% and -1,345% respectively. Controlling for other
variables, model 2 shows that during the 3 days around the event the bank-dependent firms
earned 1,632% higher results than rated firms and that during the 5 and 4 days prior the
event the bank-dependent performed worse with -1,374% and -1,287% respectively. For
these three windows, firms with prior year high revenues earned better results. In model 3,
I get the same high significance for the three windows announcements, where
dependent performed better for the 3 days around the event and lower results for the 5 and
4 days prior the event, with 1,798%, -1,347% and -1,215% respectively. The ratio ebitda
to sales, which is the control variable with the highest explanatory value, is the main driver
for European firms stock market performance, with 5,513%, 3,641% and 5,143% for the
windows mentioned earlier .
Another interesting thing is that there is no relevant event
prior to Lehman’s
bankruptcy that I could be point out as being the driver of such significant difference. It
seems implausible to think that the event of Lehman was anticipated by the European
market, but in my view the
“
good
”
performance of Bank dependent firms, comparing to
rated firms, after the event is a market reaction to their prior lower performance.
4.2 Earnings Announcement events
The second method allows me to account for several events during a span period, in
this case the earnings announcement events. Given that the U.S firms present the earnings
information in a period before the European firms, I only regressed U.S. events until
European firms release their information, this allows me to isolate the U.S. market beta of
future influence. I conducted the study by regress the difference between bank-dependent
and rated firms portfolios for each quarter.
My goal with this study is to see which events had affected differently the two
portfolios formed on bank-dependent and rated firms on their own region and which
events affected the market overseas.
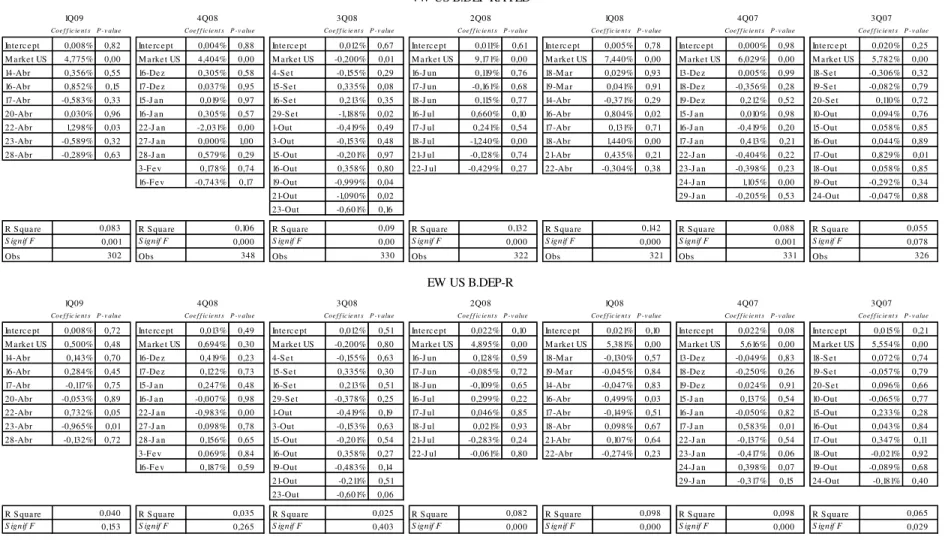
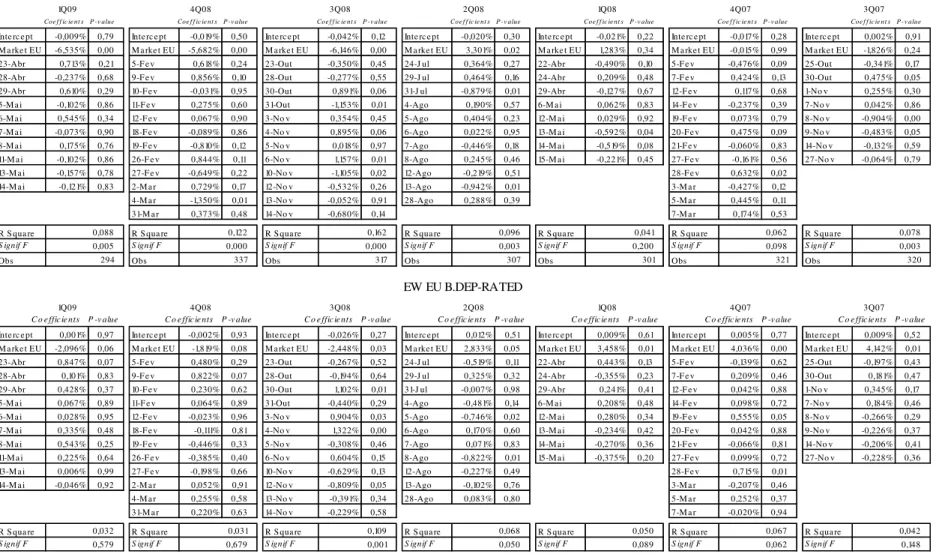
In table 3 and 4 I present the results for the impact of U.S. banks earnings
present the results for the impact of European banks earnings announcement events on
Europe and U.S. firms respectively, for both value-weighted and equally-weighted
constructed portfolios.
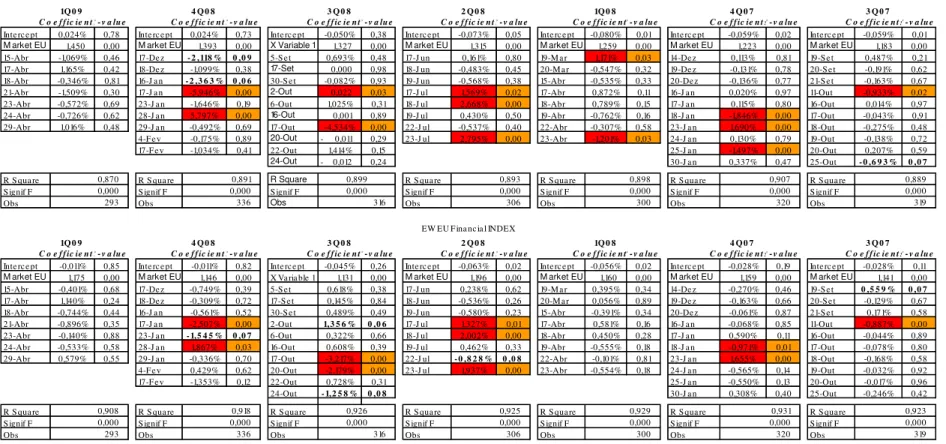
During these seven quarters I counted 6 events that affected both U.S. and European
bank-dependent firms and rated firms differently with highly significance. Three of them
account for U.S. banks earnings announcements, which are: (i) the day of earnings of
Wachovia Co on October 19, third quarters 2008, where bank-dependent earned -0,999%
and -1,663% lower return than rated firms, in U.S. and Europe respectively; (ii) the day of
earnings of E*Trade Financial and Fifth Third Bancorp on October 21, third quarters
2008, where bank-dependent earned -1,09% lower and 1,087% higher return than rated
firms, in U.S. and Europe respectively; and finally (iii) the day of earnings of Well Fargo
and Morgan Stanley on April 22, first quarter 2009, where bank-dependent earned 1,298%
and 1,25% higher than rated firms. The other three events that propagated to other
continental regions were the events of earnings announcement of European Banks, such
as: (i) the day of earnings of UBS AG on October 30, 2007 where bank-dependent earned
0,475% and 0,883% higher return than rated firms, in Europe and U.S. respectively; (ii)
the day of earnings of BNP Paribas on November 8, 2007 where bankdependent earned
-0,904% and -1,621% lower return than rated firms, in Europe and U.S. respectively; and
(iii) the day of earnings of KBC Groep and AGEAS (Ex-Fortis) on November 9, 2007
where bank-dependent earned -0,483% and -0,562% lower return than rated firms, all in
the third quarter of 2007. There are four other events that affected the two groups in both
regions but with a p-value between 0,10 and 0,05.
In each continental region, I counted only 8 daily events that had affected big and
small companies simultaneously, where the difference between big bank-dependent firms
and big rated firms account for twice the variation of difference of the small ones, in 6 of
these 8 events.
I am also interested to know which events affected these two groups differently
through a propagated shock on the entire banking system. Among the many events that
affected the entire banking system during this crisis, I only found two events that affected
simultaneously financial indices and the two groups differently in both continental
regions. One is the Wachovia Co earnings announcement referred above where the
valueweighted financial indices account for a negative abnormal return of 3,944% and
-4,457%, for U.S and Europe respectively, and where the equally-weighted financial
indices account for a negative abnormal return of -4,083% and -3,169%, for U.S and
Europe respectively. The other event day is the Deutsche Bank AG on October 30, third
quarter 2008 where the two economies had opposite impacts. Bank-dependent earned
0,891% higher and -0,891% lower returns than rated firms, for Europe and U.S. firms
respectively, with a p-value of 0,06 and 0,07, and equally-weighted financial indices
account for 2,557% and -2,978% abnormal return for Europe and U.S respectively, and
where the equally-weighted financial indices account for 2,169% and -2,683% abnormal
return of Europe and U.S respectively.
4.3 Central Banks and the Bailout
To find out if the
Central banks’ monetary policy d
ecisions affect differently these
method, to see if isolated announcements had any different impact on these two groups.
European firms seemed to have been affected differently by cuts in the reference interest
rate equal or above 50 percentage points by the three Central Banks. In the U.S., only
small firms were affected by the three Central Banks announcements, even though with no
significant difference on these two groups for events of -0,75 p.p. by ECB and -1,00 p.p.
by BoE.
The approval of the $ 700 billion bailout to the U.S. financial system by the U.S.
Senate and by the U.S. House of Representatives had no effect on the two groups in both
regions. However, on a prior event, on September 29, 2008, when the U.S. House of
Representatives first rejected the bailout, big U.S. bank-dependent firms were affected
differently, with -1,188% lower return than rated firms, and European firms were also
affected, but on the following day, with -0.854%.
5. Conclusion
During the recent financial crisis, the market seemed capable to distinguish between
bank-dependent and rated firms after news concerning the financial system emerged.
The Lehman Brothers bankruptcy event seems to have affected U.S .bank-dependent
firms’ returns more than rated firms’ returns in the windows 3 and 5 days after it has
occurred, but European firms seem to have lost the connection with U.S. economy during
this event. From Earnings announcements I show that some events have been transmitted
to overseas markets. Central bank monetary policy decision and the biggest bailout in
History seemed to have had an immediate negligible impact on the bank-dependent firms
and firms with access to the public debt market.
References
Battistona, Stefano, Domenico Delli Gattib; Mauro Gallegatic, Bruce Greenwaldd, Joseph
E. Stiglitzd, 2007, Credit chains and bankruptcy propagation in production networks,
Journal of Economic Dynamics & Control 31 (2007) 2061
–
2084.
Brandt, Michael W., Runeet Kishore, Pedro Santa-Clara, Mohan Venkatachalam, 2008,
“Earnings annou
nce
ments are full of surprises”, Working Paper
Series.
Campbell, John Y., Andrew W. Lo, A. Craig MacKinlay, (1997), The Econometrics of
Financial Market, Princeton University Press, Princeton, New Jersey
–
Chapter 4 -
Event-Study Analysis.
Chava, Sudheer and Amiyatosh Purnanandam, 2009, The Effect of Banking Crisis on
Bank-Dependent Borrowers, Working Paper Series.
Ferguson, Niall, 2008, The Ascent of Money A Financial History of the World, Edited by
Penguin Books Uk-id.
Kho, Bong-Chan and, René M. Stulz, 1999, Banks, the IMF, and the Asian Crisis, Pacific
Basin Finance Journal, 2000, v8(2,May), 177-216.
Kho, Bong-Chan, Dong Lee, and Rene M. Stulz, 2000, US Banks, Crises and Bailouts:
From Mexico to LTCM, American Economic Review, 90(2), 28-31.
Kothari, S.P., and Warner, Jerold B., 2006, Econometrics of Event Studies, Handbook of
Corporate Finance: Empirical Corporate Finance, Elsevier/North-Holland, edited by
Espen Eckbo , Chapter 1, Econometrics of Event Studies.
Krugman, Paul, 2009, The return of depression economics and the crisis of 2008,
Appendix A:
List of U.S. and European banks
based on the “
Writedowns and Credit
Loss
” table from Bloomberg.
Appendix B:
Variable Definitions
Bankdep: D
ummy variable that takes the value of one for firms without credit rating and
zero for firms with credit rating;
log(sales):
is the natural logarithm of
companies’
sales taken from the previous year;
Mtb:
is the ratio of the market value of assets to total assets from the previous year.
Leverage
: is the ratio of total debt to total assets from the previous year.
ebitda/sales:
is the ratio of EBITDA to the sales from the previous year.
pastret: is the past one-year stock return.
z-score:
is a measure of how closely a firm resembles other firms that have filed for
bankruptcy.
Wo rldwide 1739,4 268 177,8 226,6 222,1 59,7 A mericas 1150,3 205,6 112,5 135,1 128,3 42,9
Euro pe 546,1 56,5 61,5 79,7 82,2 15,5
A sia 43 5,9 3,8 11,8 11,6 1,3
U.S. 1 Citigro up Inc. 123,9 12,8 12,2 19,6 18,2 5,6 U.S. 2 Wacho via Co rpo ratio n (Wells Fargo ) 101,8 29,4 13,1 4,5 3,3 1,7 U.S. 3 B ank o f A merica (M errill Lynch) 89,2 6,7 5,5 6,3 7,6 2,1 U.S. 4 JP M o rgan Chase (B ear Stearns) 62,8 8,1 4 5,9 2,8 2,5
Euro pe 5 UB S A G 57,3 4,8 6 19,5 14,6 4,7
U.S. 6 M errill Lynch & Co . 55,9 12 8,9 7,6 18 9,4 Euro pe 7 HSB C Ho lding P lc 50,6 4,8 10,8 2,6 7,6 0,9 Euro pe 8 Ro yal B ank o f Sco tland 48,1 0,3 10,1 2,9
U.S. 10 Wells Fargo (Wacho via) 43 5,5 4,5 2,2 2,6 Euro pe 11 B arclays P lc (Lehman B ro thers) 36,9 4,5 1,5 3,6 Euro pe 12 HB OS P lc (Llo yds B ank) 26,9 3,8 0,3 4,3 1,1
U.S. 14 M o rgan Stanley 23,4 1,3 1,8 2,3 9,4 0,9
Euro pe 15 Deutsche B ank A G 21,9 3 3,2 3,7 0,1 3
Euro pe 16 Credit Suisse Gro up... 20,4 3,1 5,7 4,3 2,1 Euro pe 17 So ciete Generale 19,2 2 1,5 1,6 3,6 0,3
Euro pe 18 B NP P aribas 19,1 2,9 1,1 1,1 1,4 0,6
Euro pe 19 ING Gro ep N.V. 18,8 3,8 0,9 5,1 0,3 U.S. 21 Lehman B ro thers Ho ld 16,2 7 5,3 2,4 0,8 0,7 Euro pe 22 B anco Santander 15,1 1,2 0,9 0,6 0,8 0,7
U.S. 23 P NC Financial Services 14,3 1,7 0,5 1,2 0,2
Euro pe 25 KB C Gro ep 10,2 2,6 0,4 0,2 0,2 0,1
U.S. 26 SunTrust B ank 9,7 0,8 1,2 2,3 0,8 0,1
U.S. 29 Go ldman Sachs 9,2 1,1 0,8 2 -0,5 1,5
Euro pe 30 A GEA S (EX-FORTIS) 9 0,9 3 5,1
Euro pe 32 Credit A grico le S.A . 8,8 0,9 1,4 1,3 3,4 0,6 U.S. 34 Fifth Third B anco rp 8 0,9 0,6 0,4 0,7 0,1
U.S. 43 E*TRA DE Financial 5,9 0,7 0,3 0,2 2,8
U.S. 59 B ear Stearns 3,2 0,6 1,9 0,7
To tal Sample 928,8 121,2 100,7 107,7 117,6 38,3
1Q 0 8 4 Q 0 7 3 Q 0 7 Z o ne G lo ba l
R a nk N a m e T o t a l 3 Q 0 8 2 Q 0 8
Appendix C:
Chronology of important events. (In bracket are the companies that were totally or
partially acquired or merged by the prevailing name or firm)
18-09-2007 Le hm a n B ro the rs F ED (-0,50) 19-09-2007 M o rga n S ta nle y
20-09-2007 Go ldm a n S a c hs 04-10-2007 EC B (0,00) 10-10-2007 B e a r S te a rns 15-10-2007 C itigro up Inc . 16-10-2007 We lls F a rgo (Wa c ho via )
17-10-2007 J P M o rga n C ha s e (B e a r S te a rns ) E*TR ADE F ina nc ia l 18-10-2007 B a nk o f Am e ric a (M e rrill Lync h) S unTrus t B a nk 19-10-2007 Wa c ho via C o (We lls F a rgo ) F ifth Third B a nc o rp 24-10-2007 M e rrill Lync h & C o .
25-10-2007 B a nc o S a nta nde r 30-10-2007 UB S AG 31-10-2007 F ED (-0,25) 01-11-2007 C re dit S uis s e Gro up
07-11-2007 ING Gro e p N.V. S o c ie te Ge ne ra le
08-11-2007 B NP P a riba s EC B (0,00) B o E (0,00)
09-11-2007 KB C Gro e p AGEAS (EX-F OR TIS ) 14-11-2007 HS B C Ho lding P lc C re dit Agric o le S .A. 27-11-2007 B a rc la ys P lc (Le hm a n B ro the rs )
06-12-2007 EC B (0,00) B o E (-0,25)
11-12-2007 F ED (-0,25)
13-12-2007 Le hm a n B ro the rs 18-12-2007 Go ldm a n S a c hs 19-12-2007 M o rga n S ta nle y 10-01-2008 B o E (0,00) 15-01-2008 C itigro up Inc .
16-01-2008 We lls F a rgo (Wa c ho via ) J P M o rga n C ha s e (B e a r S te a rns ) 17-01-2008 M e rrill Lync h & C o . P NC F ina nc ia l S e rvic e s
22-01-2008 F ifth Third B a nc o rp B a nk o f Am e ric a (M e rrill Lync h) Wa c ho via C o (We lls F a rgo ) F ED (-0,75) 23-01-2008 S unTrus t B a nk
24-01-2008 E*TR ADE F ina nc ia l 29-01-2008 B e a r S te a rns 30-01-2008 F ED (-0,50) 05-02-2008 De uts c he B a nk AG
07-02-2008 B a nc o S a nta nde r EC B (0,00) B o E (-0,25) 12-02-2008 C re dit S uis s e Gro up
14-02-2008 UB S AG KB C Gro e p
19-02-2008 B a rc la ys P lc (Le hm a n B ro the rs )
20-02-2008 ING Gro e p N.V. B NP P a riba s 21-02-2008 S o c ie te Ge ne ra le
27-02-2008 HB OS P lc (Llo yds B a nk Gro up) 28-02-2008 R o ya l B a nk o f S c o tla nd 03-03-2008 HS B C Ho lding P lc 05-03-2008 C re dit Agric o le S .A.
06-03-2008 EC B (0,00) B o E (0,00)
07-03-2008 AGEAS (EX-F OR TIS ) 11-03-2008 F ED (0,00)
18-03-2008 Le hm a n B ro the rs Go ldm a n S a c hs F ED (-0,75) 19-03-2008 M o rga n S ta nle y
10-04-2008 EC B (0,00) B o E (-0,25)
14-04-2008 B e a r S te a rns Wa c ho via C o (We lls F a rgo ) 16-04-2008 We lls F a rgo (Wa c ho via ) J P M o rga n C ha s e (B e a r S te a rns )
17-04-2008 M e rrill Lync h & C o . P NC F ina nc ia l S e rvic e s E*TR ADE F ina nc ia l 18-04-2008 C itigro up Inc .
21-04-2008 B a nk o f Am e ric a (M e rrill Lync h)
22-04-2008 F ifth Third B a nc o rp S unTrus t B a nk R o ya l B a nk o f S c o tla nd 24-04-2008 C re dit S uis s e Gro up
29-04-2008 De uts c he B a nk AG B a nc o S a nta nde r 30-04-2008 F ED (-0,25)
06-05-2008 UB S AG
08-05-2008 EC B (0,00) B o E (0,00)
12-05-2008 HS B C Ho lding P lc
13-05-2008 S o c ie te Ge ne ra le AGEAS (EX-F OR TIS ) 14-05-2008 ING Gro e p N.V. B NP P a riba s
15-05-2008 KB C Gro e p B a rc la ys P lc (Le hm a n B ro the rs ) C re dit Agric o le S .A.
05-06-2008 EC B (0,00) B o E (0,00)
16-06-2008 Le hm a n B ro the rs 17-06-2008 Go ldm a n S a c hs 18-06-2008 M o rga n S ta nle y 25-06-2008 F ED (0,00) 03-07-2008 EC B (+0,25) 10-07-2008 B o E (0,00)
16-07-2008 We lls F a rgo (Wa c ho via )
1s t Qua rte r Ea rnings Anno unc e m e nts 2008
2nd Qua rte r Ea rnings Anno unc e m e nts 2008 3rd Qua rte r Ea rnings Anno unc e m e nts 2007
17-07-2008 J P M o rga n C ha s e (B e a r S te a rns ) M e rrill Lync h & C o . P NC F ina nc ia l S e rvic e s 18-07-2008 C itigro up Inc .
21-07-2008 B a nk o f Am e ric a (M e rrill Lync h)
22-07-2008 Wa c ho via C o (We lls F a rgo ) E*TR ADE F ina nc ia l F ifth Third B a nc o rp S unTrus t B a nk 24-07-2008 C re dit S uis s e Gro up
29-07-2008 B a nc o S a nta nde r
31-07-2008 De uts c he B a nk AG HB OS P lc (Llo yds B a nk Gro up) 04-08-2008 HS B C Ho lding P lc AGEAS (EX-F OR TIS ) 05-08-2008 S o c ie te Ge ne ra le F ED (0,00) 06-08-2008 B NP P a riba s
07-08-2008 KB C Gro e p B a rc la ys P lc (Le hm a n B ro the rs ) EC B (0,00) B o E (0,00) 08-08-2008 R o ya l B a nk o f S c o tla nd
12-08-2008 UB S AG 13-08-2008 ING Gro e p N.V. 28-08-2008 C re dit Agric o le S .A.
04-09-2008 B a nk o f Am e ric a (M e rrill Lync h) EC B (0,00) B o E (0,00) 15-09-2008
16-09-2008 Go ldm a n S a c hs M o rga n S ta nle y F ED (0,00) 29-09-2008
01-10-2008
02-10-2008 EC B (0,00) 03-10-2008
08-10-2008 F ED (-0,50) EC B (-0,50) B o E (-0,50)
15-10-2008 We lls F a rgo (Wa c ho via ) J P M o rga n C ha s e (B e a r S te a rns ) EC B (-0,50) 16-10-2008 M e rrill Lync h & C o . P NC F ina nc ia l S e rvic e s C itigro up Inc . 19-10-2008 Wa c ho via C o (We lls F a rgo )
21-10-2008 E*TR ADE F ina nc ia l F ifth Third B a nc o rp 23-10-2008 S unTrus t B a nk C re dit S uis s e Gro up 28-10-2008 B a nc o S a nta nde r
29-10-2008 F ED (-0,50) 30-10-2008 De uts c he B a nk AG
31-10-2008 B a rc la ys P lc (Le hm a n B ro the rs )
03-11-2008 HB OS P lc (Llo yds B a nk Gro up) S o c ie te Ge ne ra le 04-11-2008 R o ya l B a nk o f S c o tla nd UB S AG 05-11-2008 B NP P a riba s
06-11-2008 KB C Gro e p EC B (-0,50) B o E (-1,50)
10-11-2008 HS B C Ho lding P lc 12-11-2008 ING Gro e p N.V. 13-11-2008 C re dit Agric o le S .A. 14-11-2008 AGEAS (EX-F OR TIS )
04-12-2008 EC B (-0,75) B o E (-1,00) 16-12-2008 Go ldm a n S a c hs F ED (-1; -0,75) 17-12-2008 M o rga n S ta nle y
08-01-2009 B o E (-0,50)
15-01-2009 J P M o rga n C ha s e (B e a r S te a rns ) EC B (0,00) 16-01-2009 B a nk o f Am e ric a (M e rrill Lync h) C itigro up Inc .
22-01-2009 Wa c ho via C o (We lls F a rgo ) F ifth Third B a nc o rp S unTrus t B a nk 27-01-2009 E*TR ADE F ina nc ia l
28-01-2009 We lls F a rgo (Wa c ho via ) 29-01-2009 F ED (0,00)
03-02-2009 P NC F ina nc ia l S e rvic e s
05-02-2009 B a nc o S a nta nde r De uts c he B a nk AG EC B (0,00) B o E (-0,50) 09-02-2009 B a rc la ys P lc (Le hm a n B ro the rs )
10-02-2009 UB S AG 11-02-2009 C re dit S uis s e Gro up 12-02-2009 KB C Gro e p 16-02-2009 M e rrill Lync h & C o .
18-02-2009 S o c ie te Ge ne ra le ING Gro e p N.V. 19-02-2009 B NP P a riba s
26-02-2009 R o ya l B a nk o f S c o tla nd 27-02-2009 HB OS P lc (Llo yds B a nk Gro up) 02-03-2009 HS B C Ho lding P lc
04-03-2009 C re dit Agric o le S .A.
05-03-2009 EC B (-0,50) B o E (-0,50) 19-03-2009 F ED (0,00)
31-03-2009 AGEAS (EX-F OR TIS ) 02-04-2009 EC B (-0,25)
09-04-2009 B o E (0,00) 14-04-2009 Go ldm a n S a c hs
16-04-2009 J P M o rga n C ha s e (B e a r S te a rns ) 17-04-2009 C itigro up Inc .
20-04-2009 B a nk o f Am e ric a (M e rrill Lync h)
22-04-2009 We lls F a rgo (Wa c ho via ) M o rga n S ta nle y
23-04-2009 F ifth Third B a nc o rp S unTrus t B a nk P NC F ina nc ia l S e rvic e s C re dit S uis s e Gro up 28-04-2009 E*TR ADE F ina nc ia l De uts c he B a nk AG
29-04-2009 B a nc o S a nta nde r F ED (0,00) 05-05-2009 UB S AG
06-05-2009 B NP P a riba s
07-05-2009 B a rc la ys P lc (Le hm a n B ro the rs ) S o c ie te Ge ne ra le EC B (-0,50) B o E (0,00) 08-05-2009 R o ya l B a nk o f S c o tla nd
11-05-2009 HS B C Ho lding P lc 13-05-2009 ING Gro e p N.V.
14-05-2009 KB C Gro e p C re dit Agric o le S .A. AGEAS (EX-F OR TIS ) US Ho us e o f R e pre s e nta tive s pa s s e s $ 700bn fina nc ia l re s c ue pla n
4th Qua rte r Ea rnings Anno unc e m e nts 2008
1s t Qua rte r Ea rnings Anno unc e m e nts 2009 3rd Qua rte r Ea rnings Anno unc e m e nts 2008
Le hm a n B ro the rs file d fo r C ha pte r 11 ba nkruptc y pro te c tio n
B a ilo ut pla n is re je c te d by US Ho us e o f R e pre s e nta tive s US S e na te a ppro ve s $ 700bn re s c ue pla n
Table 1:
Impact of Lehman Brothers
’
bankruptcy event on U.S. firms (15.09.2008)
Coe f f ic ie nt s P - v alue Coe f f ic ie nt s P - v alue Coe f f ic ie nt s P - v alue Coe f f ic ie nt s P - v alue Coe f f ic ie nt s P - v alue Coe f f ic ie nt s P - v alue Coe f f ic ie nt s P - v alue Coe f f ic ie nt s P - v alue Coe f f ic ie nt s P - v alue Coe f f ic ie nt s P - v alue Coe f f ic ie nt s P - v alue Coe f f ic ie nt s P - v alue
Inte rc e pt -1,526% 0,73 -1,517% 0,82 -8,995% 0,26 -3,456% 0,66 -7,691% 0,07 -6,319% 0,08 -5,589% 0,12 -0,660% 0,82 -2,814% 0,58 -5,364% 0,39 0,905% 0,88 -1,641% 0,78 B a nkde p 0,228% 0,62 -0,390% 0,57 -1,256% 0,12 -0,627% 0,44 -0,517% 0,24 0,005% 0,99 -0,394% 0,29 -0,591% 0,05 -0,287% 0,59 -1,350% 0,04 -1,120% 0,07 -1,349% 0,03
R S qua re S ignif F Obs % B .DEP
Coe f f ic ie nt s P - v alue Coe f f ic ie nt s P - v alue Coe f f ic ie nt s P - v alue Coe f f ic ie nt s P - v alue Coe f f ic ie nt s P - v alue Coe f f ic ie nt s P - v alue Coe f f ic ie nt s P - v alue Coe f f ic ie nt s P - v alue Coe f f ic ie nt s P - v alue Coe f f ic ie nt s P - v alue Coe f f ic ie nt s P - v alue Coe f f ic ie nt s P - v alue
Inte rc e pt 0,909% 0,85 1,193% 0,87 -4,297% 0,62 0,062% 0,99 -14,066% 0,00 -7,929% 0,04 -5,756% 0,15 -2,323% 0,44 0,844% 0,88 -1,175% 0,86 5,357% 0,42 3,546% 0,58 B a nkde p -0,043% 0,93 -0,880% 0,26 -1,904% 0,04 -1,145% 0,22 0,097% 0,84 -0,155% 0,70 -0,682% 0,12 -0,486% 0,13 -0,662% 0,27 -1,483% 0,04 -1,251% 0,08 -1,799% 0,01 lo g(s a le s ) -0,388% 0,07 -0,381% 0,24 -0,638% 0,10 -0,567% 0,14 0,815% 0,00 0,262% 0,12 0,104% 0,56 0,243% 0,07 -0,535% 0,03 -0,653% 0,03 -0,740% 0,01 -0,799% 0,00 m tb 0,021% 0,78 0,032% 0,78 -0,035% 0,80 -0,136% 0,32 -0,079% 0,25 0,035% 0,55 0,067% 0,28 0,057% 0,22 -0,039% 0,65 -0,117% 0,26 -0,186% 0,07 -0,120% 0,22 le ve ra ge 0,010% 0,59 -0,003% 0,91 -0,005% 0,88 0,028% 0,41 0,030% 0,09 -0,012% 0,43 -0,026% 0,09 -0,006% 0,61 0,007% 0,74 0,024% 0,35 0,043% 0,10 0,025% 0,30
R S qua re S ignif F Obs % B .DEP
Coe f f ic ie nt s P - v alue Coe f f ic ie nt s P - v alue Coe f f ic ie nt s P - v alue Coe f f ic ie nt s P - v alue Coe f f ic ie nt s P - v alue Coe f f ic ie nt s P - v alue Coe f f ic ie nt s P - v alue Coe f f ic ie nt s P - v alue Coe f f ic ie nt s P - v alue Coe f f ic ie nt s P - v alue Coe f f ic ie nt s P - v alue Coe f f ic ie nt s P - v alue
Inte rc e pt -1,893% 0,70 -1,097% 0,88 -5,619% 0,53 -0,617% 0,95 -12,359% 0,01 -7,111% 0,07 -4,973% 0,23 -1,168% 0,70 -1,291% 0,82 -2,024% 0,77 5,115% 0,46 2,702% 0,68 B a nkde p -0,255% 0,63 -1,113% 0,17 -2,202% 0,02 -1,344% 0,17 0,177% 0,72 -0,026% 0,95 -0,507% 0,25 -0,304% 0,36 -0,969% 0,12 -1,860% 0,01 -1,484% 0,04 -1,954% 0,01 lo g(s a le s ) -0,211% 0,37 -0,285% 0,43 -0,595% 0,16 -0,548% 0,21 0,621% 0,00 0,212% 0,26 0,094% 0,63 0,177% 0,23 -0,441% 0,11 -0,671% 0,04 -0,742% 0,02 -0,712% 0,02 m tb -0,119% 0,18 -0,094% 0,49 -0,152% 0,35 -0,240% 0,14 -0,023% 0,78 0,047% 0,51 0,097% 0,19 0,096% 0,08 -0,144% 0,16 -0,209% 0,09 -0,248% 0,05 -0,151% 0,20 le ve ra ge 0,033% 0,12 0,023% 0,50 0,017% 0,66 0,042% 0,29 0,025% 0,22 -0,013% 0,46 -0,028% 0,13 -0,013% 0,33 0,029% 0,26 0,039% 0,20 0,049% 0,11 0,026% 0,38 e bitda /s a le s 3,236% 0,12 1,313% 0,68 -3,004% 0,43 -2,290% 0,55 -2,620% 0,18 -2,798% 0,10 -4,157% 0,02 -2,736% 0,04 1,786% 0,46 -1,530% 0,60 -2,176% 0,46 0,522% 0,85 pa s tre t 1,385% 0,19 0,080% 0,96 0,865% 0,65 0,347% 0,86 -2,423% 0,01 1,232% 0,15 2,622% 0,00 0,691% 0,30 -0,750% 0,54 -1,837% 0,21 -0,964% 0,51 0,090% 0,95 z-s c o re 0,251% 0,01 0,292% 0,04 0,246% 0,15 0,153% 0,38 -0,018% 0,84 -0,067% 0,37 -0,118% 0,13 -0,098% 0,09 0,266% 0,02 0,256% 0,05 0,112% 0,39 0,066% 0,60
R S qua re
S ignif F
Obs % B .DEP
Model 1
Model 2
Model 3
C AR -1 0 +1 C AR -2 0 +2 C AR -3 0 +3 C AR -4 0 +4 C AR -2
0,000
C AR -1 0 +1 C AR -2
C AR -3
C AR -4 C AR -3
0,000 0,340 0,107 0,000 0,237 0,000 C AR -5 C AR -4
C AR -5 C AR -4 0 +4
C AR -2 0 +2
0,130
C AR -5 C AR -4 C AR -3
0,076 0,030 351
C AR +4 C AR +5
C AR -1 0 +1 C AR -2 0 +2 C AR -3 0 +3 C AR -4 0 +4
C AR +2 C AR +3
C AR +2 C AR +3 C AR +4
0,257 0,000 0,098 0,001 351 0,203 0,000 351
C AR -2
351 0,000 0,280 0,090 0,006 351 0,112 0,000 351 0,359 0,000 351 0,106 0,000 351 0,169 0,000 351 0,112 0,000 351 0,256 0,000 351 0,352 0,000 351 0,363 0,000
C AR +5 0,000 0,159 0,000 0,268 0,000 0,077 0,005 0,000 0,133 0,000 0,093 0,000 0,372
C AR -3 0 +3
0,093 0,001 0,000 0,000 0,140 0,000 0,081 0,000 0,265 0,000 0,000 0,097 0,000 0,331
C AR +3 C AR +4 C AR +5
0,078
C AR +2
Table 2:
Impact of Lehman Brothers
’
bankruptcy event on European firms (15.09.2008)
Coe f f ic ie nt s P - v alue Coe f f ic ie nt s P - v alue Coe f f ic ie nt s P - v alue Coe f f ic ie nt s P - v alue Coe f f ic ie nt s P - v alue Coe f f ic ie nt s P - v alue Coe f f ic ie nt s P - v alue Coe f f ic ie nt s P - v alue Coe f f ic ie nt s P - v alue Coe f f ic ie nt s P - v alue Coe f f ic ie nt s P - v alue Coe f f ic ie nt s P - v alue
Inte rc e pt 2,693% 0,05 2,792% 0,06 4,475% 0,03 0,516% 0,81 -3,523% 0,01 -1,745% 0,12 -0,060% 0,95 -0,451% 0,58 1,247% 0,28 2,540% 0,11 0,265% 0,88 0,265% 0,88 B a nkde p 0,641% 0,25 0,538% 0,38 -0,204% 0,81 -0,772% 0,39 -1,837% 0,00 -1,984% 0,00 -1,345% 0,00 -0,295% 0,38 0,757% 0,11 1,066% 0,10 1,136% 0,11 1,136% 0,11
R S qua re S ignif F Obs % B .DEP
Coe f f ic ie nt s P - v alue Coe f f ic ie nt s P - v alue Coe f f ic ie nt s P - v alue Coe f f ic ie nt s P - v alue Coe f f ic ie nt s P - v alue Coe f f ic ie nt s P - v alue Coe f f ic ie nt s P - v alue Coe f f ic ie nt s P - v alue Coe f f ic ie nt s P - v alue Coe f f ic ie nt s P - v alue Coe f f ic ie nt s P - v alue Coe f f ic ie nt s P - v alue
Inte rc e pt -3,914% 0,14 0,539% 0,86 -2,790% 0,50 -3,960% 0,35 -6,964% 0,01 -6,164% 0,01 -2,558% 0,19 -0,241% 0,88 0,042% 0,99 -0,971% 0,76 1,466% 0,67 -0,439% 0,90 B a nkde p 1,632% 0,01 1,154% 0,12 0,829% 0,40 -0,160% 0,88 -1,374% 0,03 -1,287% 0,02 -0,828% 0,08 -0,202% 0,61 1,006% 0,08 1,308% 0,09 0,778% 0,35 1,119% 0,19 lo g(s a le s ) 0,733% 0,00 0,264% 0,27 0,730% 0,02 0,593% 0,08 0,383% 0,05 0,459% 0,01 0,330% 0,03 -0,005% 0,97 0,076% 0,68 0,207% 0,40 -0,058% 0,83 -0,003% 0,99 m tb 0,007% 0,93 -0,033% 0,68 0,075% 0,50 -0,029% 0,80 -0,157% 0,02 -0,093% 0,12 0,009% 0,86 0,007% 0,87 0,007% 0,91 0,114% 0,18 0,112% 0,23 0,125% 0,19 le ve ra ge 0,004% 0,84 0,016% 0,44 0,049% 0,08 0,051% 0,08 0,015% 0,39 0,014% 0,34 0,002% 0,89 -0,003% 0,78 0,021% 0,18 0,050% 0,02 0,039% 0,09 0,041% 0,09
R S qua re S ignif F Obs % B .DEP
Coe f f ic ie nt s P - v alue Coe f f ic ie nt s P - v alue Coe f f ic ie nt s P - v alue Coe f f ic ie nt s P - v alue Coe f f ic ie nt s P - v alue Coe f f ic ie nt s P - v alue Coe f f ic ie nt s P - v alue Coe f f ic ie nt s P - v alue Coe f f ic ie nt s P - v alue Coe f f ic ie nt s P - v alue Coe f f ic ie nt s P - v alue Coe f f ic ie nt s P - v alue
Inte rc e pt -3,025% 0,31 -0,125% 0,97 -6,855% 0,14 -9,866% 0,04 -8,548% 0,00 -7,541% 0,00 -5,318% 0,01 -2,974% 0,10 1,397% 0,60 -2,988% 0,40 -3,776% 0,33 -5,547% 0,16 B a nkde p 1,798% 0,00 1,230% 0,10 0,805% 0,42 -0,341% 0,74 -1,347% 0,03 -1,215% 0,02 -0,823% 0,07 -0,220% 0,56 1,068% 0,06 1,245% 0,11 0,492% 0,55 0,865% 0,31 lo g(s a le s ) 0,698% 0,00 0,301% 0,22 0,900% 0,01 0,733% 0,03 0,459% 0,02 0,527% 0,00 0,458% 0,00 0,123% 0,33 0,026% 0,89 0,290% 0,25 0,054% 0,84 0,114% 0,68 m tb 0,037% 0,61 -0,040% 0,64 0,016% 0,89 -0,064% 0,58 -0,182% 0,01 -0,110% 0,07 -0,037% 0,48 -0,042% 0,34 0,029% 0,65 0,080% 0,36 0,074% 0,44 0,085% 0,38 le ve ra ge -0,032% 0,13 0,001% 0,98 0,049% 0,14 0,049% 0,15 0,010% 0,64 0,000% 1,00 0,001% 0,92 0,002% 0,86 0,011% 0,56 0,061% 0,02 0,062% 0,03 0,060% 0,03 e bitda /s a le s 5,513% 0,00 4,117% 0,03 6,359% 0,01 7,874% 0,00 3,641% 0,02 5,143% 0,00 4,660% 0,00 3,556% 0,00 -0,101% 0,95 1,036% 0,60 2,069% 0,33 2,729% 0,21 pa s tre t -1,634% 0,15 -0,008% 1,00 1,263% 0,48 -2,620% 0,15 0,652% 0,55 0,262% 0,78 1,340% 0,10 1,601% 0,02 -0,559% 0,59 0,974% 0,48 -1,831% 0,22 -1,573% 0,30 z-s c o re -0,263% 0,07 -0,068% 0,68 0,190% 0,39 0,318% 0,16 0,037% 0,79 -0,032% 0,79 0,118% 0,25 0,151% 0,08 -0,128% 0,32 0,162% 0,35 0,440% 0,02 0,406% 0,03
R S qua re
S ignif F
Obs % B .DEP
Model 1
Model 2
Model 3
C AR -5
C AR +3 C AR +4 C AR +5
C AR -1 0 +1 C AR -2 0 +2 C AR -3 0 +3 C AR -4 0 +4 0,000
C AR -2 C AR +2
C AR +5
C AR +2 C AR +3 C AR +4
C AR -5
0,147 C AR -1 0 +1 C AR -2 0 +2 C AR -3 0 +3 C AR -4 0 +4
0,264 0,040
C AR -3
0,116 0,000
0,182
C AR -2 C AR +2 0,266
0,000
0,147 0,000 C AR +3
C AR -1 0 +1 C AR -2 0 +2 C AR -3 0 +3 C AR -4 0 +4
C AR -4
0,253 0,092
0,034
0,211
C AR -4
0,000 0,093 0,033 0,100 0,017 0,000 0,228 0,000 0,330 0,000 0,341 0,152 0,000 0,124 0,002 0,118 0,000 0,107 0,002 0,001
C AR +4 C AR +5
0,139 0,000 0,000 0,189 0,000 0,000 0,022 0,631 0,030 0,376 0,046 0,363 0,058 0,162 0,000 0,064 0,013 0,158 0,000 288 0,149 C AR -4 C AR -5
0,085 0,104
61,46%
C AR -3 C AR -2
0,148 0,001 0,000 0,210 0,001 0,251 0,000 0,265 0,141 0,000 0,085 0,000 0,075 0,000 264
C AR -3
60,98% 60,98%
264 0,000
Table 3:
Impact of earnings announcements events from U.S. banks on U.S. firms. VW US B.DEP-RATED is the difference between U.S.
value-weighted portfolios of dependent and rated firms. EW US B.DEP-RATED is the difference between U.S. equally-weighted portfolios of
bank-dependent and rated firms.
1Q09 4Q08 3Q08 2Q08 1Q08 4Q07 3Q07
Coe f f ic ie nt s P - v alue Coe f f ic ie nt s P - v alue Coe f f ic ie nt s P - v alue Coe f f ic ie nt s P - v alue Coe f f ic ie nt s P - v alue Coe f f ic ie nt sP - v alue Coe f f ic ie nt s P - v alue
Inte rc e pt 0,008% 0,82 Inte rc e pt 0,004% 0,88 Inte rc e pt 0,012% 0,67 Inte rc e pt 0,011% 0,61 Inte rc e pt 0,005% 0,78 Inte rc e pt 0,000% 0,98 Inte rc e pt 0,020% 0,25 M a rke t US 4,775% 0,00 M a rke t US 4,404% 0,00 M a rke t US -0,200% 0,01 M a rke t US 9,171% 0,00 M a rke t US 7,440% 0,00 M a rke t US 6,029% 0,00 M a rke t US 5,782% 0,00
14-Abr 0,356% 0,55 16-De z 0,305% 0,58 4-S e t -0,155% 0,29 16-J un 0,119% 0,76 18-M a r 0,029% 0,93 13-De z 0,005% 0,99 18-S e t -0,306% 0,32
16-Abr 0,852% 0,15 17-De z 0,037% 0,95 15-S e t 0,335% 0,08 17-J un -0,161% 0,68 19-M a r 0,041% 0,91 18-De z -0,356% 0,28 19-S e t -0,082% 0,79
17-Abr -0,583% 0,33 15-J a n 0,019% 0,97 16-S e t 0,213% 0,35 18-J un 0,115% 0,77 14-Abr -0,371% 0,29 19-De z 0,212% 0,52 20-S e t 0,110% 0,72
20-Abr 0,030% 0,96 16-J a n 0,305% 0,57 29-S e t -1,188% 0,02 16-J ul 0,660% 0,10 16-Abr 0,804% 0,02 15-J a n 0,010% 0,98 10-Out 0,094% 0,76
22-Abr 1,298% 0,03 22-J a n -2,031% 0,00 1-Out -0,419% 0,49 17-J ul 0,241% 0,54 17-Abr 0,131% 0,71 16-J a n -0,419% 0,20 15-Out 0,058% 0,85
23-Abr -0,589% 0,32 27-J a n 0,000% 1,00 3-Out -0,153% 0,48 18-J ul -1,240% 0,00 18-Abr 1,440% 0,00 17-J a n 0,413% 0,21 16-Out 0,044% 0,89
28-Abr -0,289% 0,63 28-J a n 0,579% 0,29 15-Out -0,201% 0,97 21-J ul -0,128% 0,74 21-Abr 0,435% 0,21 22-J a n -0,404% 0,22 17-Out 0,829% 0,01
3-F e v 0,178% 0,74 16-Out 0,358% 0,80 22-J ul -0,429% 0,27 22-Abr -0,304% 0,38 23-J a n -0,398% 0,23 18-Out 0,058% 0,85
16-F e v -0,743% 0,17 19-Out -0,999% 0,04 24-J a n 1,105% 0,00 19-Out -0,292% 0,34
21-Out -1,090% 0,02 29-J a n -0,205% 0,53 24-Out -0,047% 0,88
23-Out -0,601% 0,16
R S qua re R S qua re R S qua re R S qua re R S qua re R S qua re R S qua re
S ignif F S ignif F S ignif F S ignif F S ignif F S ignif F S ignif F
Obs Obs Obs Obs Obs Obs Obs
1Q09 4Q08 3Q08 2Q08 1Q08 4Q07 3Q07
Coe f f ic ie nt s P - v alue Coe f f ic ie nt s P - v alue Coe f f ic ie nt s P - v alue Coe f f ic ie nt s P - v alue Coe f f ic ie nt s P - v alue Coe f f ic ie nt sP - v alue Coe f f ic ie nt s P - v alue
Inte rc e pt 0,008% 0,72 Inte rc e pt 0,013% 0,49 Inte rc e pt 0,012% 0,51 Inte rc e pt 0,022% 0,10 Inte rc e pt 0,021% 0,10 Inte rc e pt 0,022% 0,08 Inte rc e pt 0,015% 0,21 M a rke t US 0,500% 0,48 M a rke t US 0,694% 0,30 M a rke t US -0,200% 0,80 M a rke t US 4,895% 0,00 M a rke t US 5,381% 0,00 M a rke t US 5,616% 0,00 M a rke t US 5,554% 0,00
14-Abr 0,143% 0,70 16-De z 0,419% 0,23 4-S e t -0,155% 0,63 16-J un 0,128% 0,59 18-M a r -0,130% 0,57 13-De z -0,049% 0,83 18-S e t 0,072% 0,74
16-Abr 0,284% 0,45 17-De z 0,122% 0,73 15-S e t 0,335% 0,30 17-J un -0,085% 0,72 19-M a r -0,045% 0,84 18-De z -0,250% 0,26 19-S e t -0,057% 0,79
17-Abr -0,117% 0,75 15-J a n 0,247% 0,48 16-S e t 0,213% 0,51 18-J un -0,109% 0,65 14-Abr -0,047% 0,83 19-De z 0,024% 0,91 20-S e t 0,096% 0,66
20-Abr -0,053% 0,89 16-J a n -0,007% 0,98 29-S e t -0,378% 0,25 16-J ul 0,299% 0,22 16-Abr 0,499% 0,03 15-J a n 0,137% 0,54 10-Out -0,065% 0,77
22-Abr 0,732% 0,05 22-J a n -0,983% 0,00 1-Out -0,419% 0,19 17-J ul 0,046% 0,85 17-Abr -0,149% 0,51 16-J a n -0,050% 0,82 15-Out 0,233% 0,28
23-Abr -0,965% 0,01 27-J a n 0,098% 0,78 3-Out -0,153% 0,63 18-J ul 0,021% 0,93 18-Abr 0,098% 0,67 17-J a n 0,583% 0,01 16-Out 0,043% 0,84
28-Abr -0,132% 0,72 28-J a n 0,156% 0,65 15-Out -0,201% 0,54 21-J ul -0,283% 0,24 21-Abr 0,107% 0,64 22-J a n -0,137% 0,54 17-Out 0,347% 0,11
3-F e v 0,069% 0,84 16-Out 0,358% 0,27 22-J ul -0,061% 0,80 22-Abr -0,274% 0,23 23-J a n -0,417% 0,06 18-Out -0,021% 0,92
16-F e v 0,187% 0,59 19-Out -0,483% 0,14 24-J a n 0,398% 0,07 19-Out -0,089% 0,68
21-Out -0,211% 0,51 29-J a n -0,317% 0,15 24-Out -0,181% 0,40
23-Out -0,601% 0,06
R S qua re R S qua re R S qua re R S qua re R S qua re R S qua re R S qua re
S ignif F S ignif F S ignif F S ignif F S ignif F S ignif F S ignif F
VW US B.DEP-RATED
EW US B.DEP-R
Table 4:
Impact of earnings announcements events from U.S. banks on European firms. VW EU B.DEP-RATED is the difference
between European value-weighted portfolios of bank-dependent and rated firms. EW EU B.DEP-RATED is the difference between European
equally-weighted portfolios of bank-dependent and rated firms.
1Q09 4Q08 3Q08 2Q08 1Q08 4Q07 3Q07
Coe f f ic ie nt s P - v alue Coe f f ic ie nt s P - v alue Coe f f ic ie nt s P - v alue Coe f f ic ie nt s P - v alue Coe f f ic ie nt s P - v alue Coe f f ic ie nt sP - v alue Coe f f ic ie nt s P - v alue
Inte rc e pt -0,014% 0,68 Inte rc e pt -0,013% 0,66 Inte rc e pt -0,047% 0,08 Inte rc e pt -0,028% 0,15 Inte rc e pt -0,026% 0,12 Inte rc e pt -0,020% 0,19 Inte rc e pt -0,004% 0,78 M a rke t EU -6,685% 0,00 M a rke t EU -5,919% 0,00 M a rke t EU -5,264% 0,00 M a rke t EU 3,227% 0,03 M a rke t EU 0,890% 0,52 M a rke t EU -0,797% 0,58 M a rke t EU -2,364% 0,14
14-Abr 0,402% 0,48 16-De z 0,126% 0,81 4-S e t -0,273% 0,56 16-J un 0,026% 0,94 18-M a r 0,434% 0,15 13-De z 0,261% 0,35 18-S e t 0,336% 0,19
16-Abr 0,411% 0,47 17-De z -0,505% 0,34 15-S e t 0,324% 0,49 17-J un -0,280% 0,40 19-M a r 0,266% 0,37 18-De z 0,005% 0,99 19-S e t 0,205% 0,42
17-Abr 0,360% 0,52 15-J a n -0,570% 0,29 16-S e t 0,623% 0,18 18-J un -0,123% 0,71 14-Abr -0,111% 0,71 19-De z 0,030% 0,91 20-S e t -0,134% 0,59
20-Abr -0,319% 0,57 16-J a n 0,315% 0,56 29-S e t 0,051% 0,91 16-J ul 0,792% 0,02 16-Abr 0,184% 0,53 15-J a n -0,397% 0,15 10-Out -0,019% 0,94
22-Abr 1,250% 0,03 22-J a n 0,128% 0,81 1-Out 0,507% 0,28 17-J ul 0,843% 0,01 17-Abr -0,544% 0,07 16-J a n 0,232% 0,40 15-Out 0,000% 1,00
23-Abr 0,717% 0,20 27-J a n -0,765% 0,15 3-Out -0,255% 0,59 18-J ul 0,440% 0,19 18-Abr 0,013% 0,96 17-J a n 0,303% 0,27 16-Out 0,236% 0,35
28-Abr -0,235% 0,68 28-J a n 0,319% 0,55 15-Out 0,950% 0,05 21-J ul -0,056% 0,87 21-Abr 0,132% 0,65 22-J a n 1,264% 0,00 17-Out 0,443% 0,08
3-F e v -0,433% 0,42 16-Out 0,083% 0,86 22-J ul 0,166% 0,62 22-Abr -0,487% 0,10 23-J a n 0,097% 0,73 18-Out -0,290% 0,25
16-F e v -0,009% 0,99 19-Out -1,663% 0,00 24-J a n 0,164% 0,56 19-Out 0,034% 0,89
21-Out 1,087% 0,02 29-J a n 0,039% 0,89 24-Out -0,110% 0,66
23-Out -0,340% 0,47
R S qua re R S qua re R S qua re R S qua re R S qua re R S qua re R S qua re
S ignif F S ignif F S ignif F S ignif F S ignif F S ignif F S ignif F
Obs Obs Obs Obs Obs Obs Obs
1Q09 4Q08 3Q08 2Q08 1Q08 4Q07 3Q07
Coe f f ic ie nt s P - v alue Coe f f ic ie nt s P - v alue Coe f f ic ie nt s P - v alue Coe f f ic ie nt s P - v alue Coe f f ic ie nt s P - v alue Coe f f ic ie nt sP - v alue Coe f f ic ie nt s P - v alue
Inte rc e pt 0,003% 0,91 Inte rc e pt 0,005% 0,85 Inte rc e pt -0,016% 0,51 Inte rc e pt -0,001% 0,98 Inte rc e pt 0,009% 0,61 Inte rc e pt 0,006% 0,70 Inte rc e pt 0,005% 0,74 M a rke t EU -2,122% 0,06 M a rke t EU -1,641% 0,11 M a rke t EU -1,571% 0,17 M a rke t EU 2,190% 0,13 M a rke t EU 3,534% 0,01 M a rke t EU 4,482% 0,00 M a rke t EU 3,627% 0,02
14-Abr 0,437% 0,36 16-De z -0,360% 0,43 4-S e t 0,139% 0,74 16-J un 0,496% 0,13 18-M a r -0,085% 0,78 13-De z 0,485% 0,08 18-S e t 0,008% 0,97
16-Abr 0,339% 0,47 17-De z -0,191% 0,68 15-S e t -0,308% 0,47 17-J un 0,460% 0,16 19-M a r 0,104% 0,72 18-De z 0,059% 0,83 19-S e t 0,433% 0,09
17-Abr 0,116% 0,81 15-J a n 0,066% 0,88 16-S e t 0,336% 0,43 18-J un -0,211% 0,52 14-Abr -0,175% 0,55 19-De z -0,015% 0,96 20-S e t 0,072% 0,77
20-Abr -0,070% 0,88 16-J a n -0,031% 0,95 29-S e t -0,383% 0,37 16-J ul -0,298% 0,37 16-Abr 0,206% 0,48 15-J a n -0,239% 0,38 10-Out 0,018% 0,94
22-Abr 0,176% 0,71 22-J a n 0,761% 0,10 1-Out -0,331% 0,43 17-J ul 0,539% 0,11 17-Abr -0,326% 0,27 16-J a n -0,461% 0,09 15-Out 0,467% 0,06
23-Abr 0,845% 0,07 27-J a n -0,550% 0,23 3-Out -0,371% 0,38 18-J ul -0,106% 0,75 18-Abr -0,490% 0,10 17-J a n 0,435% 0,11 16-Out -0,016% 0,95
28-Abr 0,098% 0,84 28-J a n -0,221% 0,63 15-Out 0,384% 0,37 21-J ul 0,662% 0,04 21-Abr 0,273% 0,35 22-J a n 0,918% 0,00 17-Out 0,017% 0,95
3-F e v -0,653% 0,15 16-Out -0,530% 0,22 22-J ul 0,096% 0,77 22-Abr 0,444% 0,13 23-J a n 0,497% 0,07 18-Out -0,250% 0,32
16-F e v -0,081% 0,86 19-Out -1,266% 0,00 24-J a n -0,506% 0,07 19-Out 0,177% 0,48
21-Out 0,344% 0,42 29-J a n 0,024% 0,93 24-Out 0,179% 0,47
23-Out -0,272% 0,52
R S qua re R S qua re R S qua re R S qua re R S qua re R S qua re R S qua re
S ignif F S ignif F S ignif F S ignif F S ignif F S ignif F S ignif F
0,107 0,000
0,046 0,191
VW EU B.DEP-RATED
EW EU B.DEP-RATED
Table 5:
Impact of earnings announcements events from European banks on European firms. VW EU B.DEP-RATED is the difference
between European value-weighted portfolios of bank-dependent and rated firms. EW EU B.DEP-RATED is the difference between European
equally-weighted portfolios of bank-dependent and rated firms.
1Q09 4Q08 3Q08 2Q08 1Q08 4Q07 3Q07
Coe f f ic ie nt s P - v alue Coe f f ic ie nt s P - v alue Coe f f ic ie nt s P - v alue Coe f f ic ie nt s P - v alue Coe f f ic ie nt s P - v alue Coe f f ic ie nt sP - v alue Coe f f ic ie nt s P - v alue
Inte rc e pt -0,009% 0,79 Inte rc e pt -0,019% 0,50 Inte rc e pt -0,042% 0,12 Inte rc e pt -0,020% 0,30 Inte rc e pt -0,021% 0,22 Inte rc e pt -0,017% 0,28 Inte rc e pt 0,002% 0,91 M a rke t EU -6,535% 0,00 M a rke t EU -5,682% 0,00 M a rke t EU -6,146% 0,00 M a rke t EU 3,301% 0,02 M a rke t EU 1,283% 0,34 M a rke t EU -0,015% 0,99 M a rke t EU -1,826% 0,24
23-Abr 0,713% 0,21 5-F e v 0,618% 0,24 23-Out -0,350% 0,45 24-J ul 0,364% 0,27 22-Abr -0,490% 0,10 5-F e v -0,476% 0,09 25-Out -0,341% 0,17
28-Abr -0,237% 0,68 9-F e v 0,856% 0,10 28-Out -0,277% 0,55 29-J ul 0,464% 0,16 24-Abr 0,209% 0,48 7-F e v 0,424% 0,13 30-Out 0,475% 0,05
29-Abr 0,610% 0,29 10-F e v -0,031% 0,95 30-Out 0,891% 0,06 31-J ul -0,879% 0,01 29-Abr -0,127% 0,67 12-F e v 0,117% 0,68 1-No v 0,255% 0,30
5-M a i -0,102% 0,86 11-F e v 0,275% 0,60 31-Out -1,153% 0,01 4-Ago 0,190% 0,57 6-M a i 0,062% 0,83 14-F e v -0,237% 0,39 7-No v 0,042% 0,86
6-M a i 0,545% 0,34 12-F e v 0,067% 0,90 3-No v 0,354% 0,45 5-Ago 0,404% 0,23 12-M a i 0,029% 0,92 19-F e v 0,073% 0,79 8-No v -0,904% 0,00
7-M a i -0,073% 0,90 18-F e v -0,089% 0,86 4-No v 0,895% 0,06 6-Ago 0,022% 0,95 13-M a i -0,592% 0,04 20-F e v 0,475% 0,09 9-No v -0,483% 0,05
8-M a i 0,175% 0,76 19-F e v -0,810% 0,12 5-No v 0,018% 0,97 7-Ago -0,446% 0,18 14-M a i -0,519% 0,08 21-F e v -0,060% 0,83 14-No v -0,132% 0,59
11-M a i -0,102% 0,86 26-F e v 0,844% 0,11 6-No v 1,157% 0,01 8-Ago 0,245% 0,46 15-M a i -0,221% 0,45 27-F e v -0,161% 0,56 27-No v -0,064% 0,79
13-M a i -0,157% 0,78 27-F e v -0,649% 0,22 10-No v -1,105% 0,02 12-Ago -0,219% 0,51 28-F e v 0,632% 0,02
14-M a i -0,121% 0,83 2-M a r 0,729% 0,17 12-No v -0,532% 0,26 13-Ago -0,942% 0,01 3-M a r -0,427% 0,12
4-M a r -1,350% 0,01 13-No v -0,052% 0,91 28-Ago 0,288% 0,39 5-M a r 0,445% 0,11
31-M a r 0,373% 0,48 14-No v -0,680% 0,14 7-M a r 0,174% 0,53
R S qua re R S qua re R S qua re R S qua re R S qua re R S qua re R S qua re
S ignif F S ignif F S ignif F S ignif F S ignif F S ignif F S ignif F
Obs Obs Obs Obs Obs Obs Obs
1Q09 4Q08 3Q08 2Q08 1Q08 4Q07 3Q07
C o e ffic ie nts P -v alue C o e ffic ie nts P -v alue C o e ffic ie nts P -v alue C o e ffic ie nts P -v alue C o e ffic ie nts P -v alue C o e ffic ie nts P -v alue C o e ffic ie nts P -v alue
Inte rc e pt 0,001% 0,97 Inte rc e pt -0,002% 0,93 Inte rc e pt -0,026% 0,27 Inte rc e pt 0,012% 0,51 Inte rc e pt 0,009% 0,61 Inte rc e pt 0,005% 0,77 Inte rc e pt 0,009% 0,52 M a rke t EU -2,096% 0,06 M a rke t EU -1,819% 0,08 M a rke t EU -2,448% 0,03 M a rke t EU 2,833% 0,05 M a rke t EU 3,458% 0,01 M a rke t EU 4,036% 0,00 M a rke t EU 4,142% 0,01
23-Abr 0,847% 0,07 5-F e v 0,480% 0,29 23-Out -0,267% 0,52 24-J ul -0,519% 0,11 22-Abr 0,443% 0,13 5-F e v -0,139% 0,62 25-Out -0,197% 0,43
28-Abr 0,101% 0,83 9-F e v 0,822% 0,07 28-Out -0,194% 0,64 29-J ul 0,325% 0,32 24-Abr -0,355% 0,23 7-F e v 0,209% 0,46 30-Out 0,181% 0,47
29-Abr 0,428% 0,37 10-F e v 0,230% 0,62 30-Out 1,102% 0,01 31-J ul -0,007% 0,98 29-Abr 0,241% 0,41 12-F e v 0,042% 0,88 1-No v 0,345% 0,17
5-M a i 0,067% 0,89 11-F e v 0,064% 0,89 31-Out -0,440% 0,29 4-Ago -0,481% 0,14 6-M a i 0,208% 0,48 14-F e v 0,098% 0,72 7-No v 0,184% 0,46
6-M a i 0,028% 0,95 12-F e v -0,023% 0,96 3-No v 0,904% 0,03 5-Ago -0,746% 0,02 12-M a i 0,280% 0,34 19-F e v 0,555% 0,05 8-No v -0,266% 0,29
7-M a i 0,335% 0,48 18-F e v -0,111% 0,81 4-No v 1,322% 0,00 6-Ago 0,170% 0,60 13-M a i -0,234% 0,42 20-F e v 0,042% 0,88 9-No v -0,226% 0,37
8-M a i 0,543% 0,25 19-F e v -0,446% 0,33 5-No v -0,308% 0,46 7-Ago 0,071% 0,83 14-M a i -0,270% 0,36 21-F e v -0,066% 0,81 14-No v -0,206% 0,41
11-M a i 0,225% 0,64 26-F e v -0,385% 0,40 6-No v 0,604% 0,15 8-Ago -0,822% 0,01 15-M a i -0,375% 0,20 27-F e v 0,099% 0,72 27-No v -0,228% 0,36
13-M a i 0,006% 0,99 27-F e v -0,198% 0,66 10-No v -0,629% 0,13 12-Ago -0,227% 0,49 28-F e v 0,715% 0,01
14-M a i -0,046% 0,92 2-M a r 0,052% 0,91 12-No v -0,809% 0,05 13-Ago -0,102% 0,76 3-M a r -0,207% 0,46
4-M a r 0,255% 0,58 13-No v -0,391% 0,34 28-Ago 0,083% 0,80 5-M a r 0,252% 0,37
31-M a r 0,220% 0,63 14-No v -0,229% 0,58 7-M a r -0,020% 0,94
R S qua re R S qua re R S qua re R S qua re R S qua re R S qua re R S qua re
S ignif F S ignif F S ignif F S ignif F 0,050 S ignif F S ignif F S ignif F
0,050 0,089 0,067 0,062 0,042 0,148 0,078 0,003 320 0,032 0,579 0,109 0,001 0,031 0,679 0,068 0,041 0,200 301 0,062 0,098 321 0,162 0,000 317 0,096 0,003 307 0,088 0,005 294 0,122 0,000 337
VW EU B.DEP-RATED
Table 6:
Impact of earnings announcements events from European banks on U.S. firms. VW US B.DEP-RATED is the difference
between U.S. value-weighted portfolios of bank-dependent and rated firms. EW US B.DEP-RATED is the difference between U.S. equally-weighted
portfolios of bank-dependent and rated firms.
1Q09 4Q08 3Q08 2Q08 1Q08 4Q07 3Q07
Coe f f ic ie nt s P - v alue Coe f f ic ie nt s P - v alue Coe f f ic ie nt s P - v alue Coe f f ic ie nt s P - v alue Coe f f ic ie nt s P - v alue Coe f f ic ie nt sP - v alue Coe f f ic ie nt s P - v alue
Inte rc e pt 0,021% 0,54 Inte rc e pt -0,009% 0,75 Inte rc e pt -0,011% 0,68 Inte rc e pt 0,007% 0,75 Inte rc e pt 0,008% 0,71 Inte rc e pt -0,002% 0,93 Inte rc e pt 0,026% 0,11 M a rke t US 4,813% 0,00 M a rke t US 5,180% 0,00 M a rke t US 4,083% 0,00 M a rke t US 9,677% 0,00 M a rke t US 8,131% 0,00 M a rke t US 6,325% 0,00 M a rke t US 5,937% 0,00
23-Abr -0,602% 0,31 5-F e v 0,926% 0,09 23-Out -0,670% 0,17 24-J ul -0,328% 0,41 22-Abr -0,300% 0,40 5-F e v 0,294% 0,38 25-Out -0,477% 0,09
28-Abr -0,302% 0,61 9-F e v -0,647% 0,23 28-Out -0,770% 0,13 29-J ul 0,010% 0,98 24-Abr 0,457% 0,20 7-F e v -0,124% 0,71 30-Out 0,883% 0,00
29-Abr 0,187% 0,75 10-F e v 0,268% 0,62 30-Out -0,891% 0,07 31-J ul -0,191% 0,63 29-Abr -0,036% 0,92 12-F e v -0,336% 0,31 1-No v 0,508% 0,08
5-M a i -0,417% 0,48 11-F e v -0,337% 0,53 31-Out -0,343% 0,48 4-Ago -0,244% 0,54 6-M a i 0,350% 0,33 14-F e v 0,127% 0,70 7-No v 0,111% 0,70
6-M a i -0,575% 0,34 12-F e v 0,153% 0,78 3-No v -0,349% 0,47 5-Ago 0,013% 0,97 12-M a i 0,518% 0,15 19-F e v -0,581% 0,08 8-No v -1,621% 0,00
7-M a i -1,539% 0,01 18-F e v 0,048% 0,93 4-No v 0,179% 0,71 6-Ago 0,569% 0,15 13-M a i 0,243% 0,50 20-F e v -0,166% 0,61 9-No v -0,562% 0,05
8-M a i -0,646% 0,28 19-F e v -0,588% 0,28 5-No v -0,502% 0,31 7-Ago 0,574% 0,15 14-M a i -0,104% 0,77 21-F e v 0,212% 0,52 14-No v -0,527% 0,06
11-M a i 0,677% 0,26 26-F e v -0,273% 0,61 6-No v 0,341% 0,49 8-Ago -0,261% 0,51 15-M a i 0,379% 0,29 27-F e v 0,510% 0,12 27-No v 0,146% 0,61
13-M a i -0,191% 0,75 27-F e v 1,418% 0,01 10-No v -0,470% 0,33 12-Ago 0,336% 0,40 28-F e v -0,008% 0,98
14-M a i 0,510% 0,39 2-M a r 1,151% 0,04 12-No v 0,361% 0,46 13-Ago -0,098% 0,81 3-M a r -0,486% 0,14
4-M a r 0,936% 0,08 13-No v -0,320% 0,52 28-Ago 0,094% 0,81 5-M a r 0,302% 0,36
31-M a r 0,592% 0,28 14-No v -0,208% 0,67 7-M a r 0,676% 0,04
R S qua re R S qua re R S qua re R S qua re R S qua re R S qua re R S qua re
S ignif F S ignif F S ignif F S ignif F S ignif F S ignif F S ignif F
Obs Obs Obs Obs Obs Obs Obs
1Q09 4Q08 3Q08 2Q08 1Q08 4Q07 3Q07
Coe f f ic ie nt s P - v alue Coe f f ic ie nt s P - v alue Coe f f ic ie nt s P - v alue Coe f f ic ie nt s P - v alue Coe f f ic ie nt s P - v alue Coe f f ic ie nt sP - v alue Coe f f ic ie nt s P - v alue
Inte rc e pt 0,012% 0,58 Inte rc e pt 0,011% 0,58 Inte rc e pt 0,013% 0,47 Inte rc e pt 0,024% 0,08 Inte rc e pt 0,020% 0,12 Inte rc e pt 0,020% 0,11 Inte rc e pt 0,018% 0,14 M a rke t US 0,534% 0,45 M a rke t US 0,970% 0,15 M a rke t US -0,183% 0,82 M a rke t US 5,546% 0,00 M a rke t US 5,505% 0,00 M a rke t US 5,021% 0,00 M a rke t US 5,481% 0,00
23-Abr -0,970% 0,01 5-F e v 0,295% 0,40 23-Out -0,602% 0,06 24-J ul -0,002% 0,99 22-Abr -0,271% 0,24 5-F e v 0,325% 0,15 25-Out -0,083% 0,69
28-Abr -0,136% 0,71 9-F e v 0,000% 1,00 28-Out -0,675% 0,04 29-J ul -0,178% 0,46 24-Abr 0,181% 0,43 7-F e v 0,125% 0,58 30-Out 0,326% 0,12
29-Abr 0,608% 0,10 10-F e v 0,216% 0,54 30-Out -0,646% 0,04 31-J ul -0,212% 0,38 29-Abr 0,173% 0,45 12-F e v -0,214% 0,34 1-No v 0,115% 0,59
5-M a i -0,371% 0,31 11-F e v -0,460% 0,19 31-Out 0,516% 0,10 4-Ago -0,044% 0,85 6-M a i 0,114% 0,62 14-F e v -0,229% 0,31 7-No v 0,212% 0,33
6-M a i -0,211% 0,57 12-F e v 0,370% 0,29 3-No v -0,225% 0,48 5-Ago -0,258% 0,29 12-M a i -0,090% 0,69 19-F e v -0,475% 0,03 8-No v -0,269% 0,20
7-M a i -0,771% 0,04 18-F e v 0,220% 0,53 4-No v 0,518% 0,10 6-Ago -0,019% 0,94 13-M a i 0,133% 0,56 20-F e v 0,088% 0,69 9-No v -0,549% 0,01
8-M a i -0,482% 0,19 19-F e v -0,473% 0,18 5-No v -0,651% 0,04 7-Ago 0,063% 0,79 14-M a i 0,217% 0,34 21-F e v 0,210% 0,35 14-No v -0,379% 0,07
11-M a i 0,538% 0,15 26-F e v -0,081% 0,82 6-No v 0,235% 0,46 8-Ago -0,269% 0,27 15-M a i 0,032% 0,89 27-F e v 0,329% 0,14 27-No v 0,269% 0,21
13-M a i 0,169% 0,65 27-F e v 0,272% 0,44 10-No v -0,303% 0,34 12-Ago 0,064% 0,79 28-F e v -0,191% 0,39
14-M a i 0,290% 0,43 2-M a r 0,444% 0,21 12-No v -0,241% 0,45 13-Ago 0,178% 0,46 3-M a r 0,020% 0,93
4-M a r 0,234% 0,50 13-No v 0,521% 0,10 28-Ago 0,027% 0,91 5-M a r 0,203% 0,37
31-M a r 0,144% 0,68 14-No v -0,425% 0,18 7-M a r 0,133% 0,55
R S qua re R S qua re R S qua re R S qua re R S qua re R S qua re R S qua re
S ignif F S ignif F S ignif F S ignif F 0,005 S ignif F S ignif F S ignif F
0,089 0,001 0,089 0,005 0,099 0,000 0,173 0,000 326 0,041
0,067 0,031 0,636 0,085 0,008 0,086 0,092 0,000 321 0,077 0,018 331 0,062 0,082 330 0,110 0,000 322 0,094 0,002 302 0,117 0,000 348