905 905 905 905 905 Mem Inst Oswaldo Cruz, Rio de Janeiro, Vol. 102(8): 905-912, December 2007
The dynamics of dengue virus serotype 3 introduction and
dispersion in the state of Bahia, Brazil
Paulo Roberto Santana de Melo/*, Eliana Almeida Gomes Reis, Isolina Allen Ciuffo**,
Mônica Góes, Ronald Edward Blanton***, Mitermayer Galvão dos Reis/
+Centro de Pesquisa Gonçalo Moniz-Fiocruz, R. Valdemar Falcão 121, 40295-001 Salvador, BA, Brasil *Universidade Estadual de Santa Cruz, BA, Brasil **Laboratório Central do Estado da Bahia, Salvador, BA, Brasil ***Case University, Cleveland, OH, USA
By 2002, dengue virus serotype 1 (DENV-1) and DENV-2 had circulated for more than a decade in Brazil. In 2002, the introduction of DENV-3 in the state of Bahia produced a massive epidemic and the first cases of dengue hemorrhagic fever. Based on the standardized frequency, timing and location of viral isolations by the state’s Central Laboratory, DENV-3 probably entered Bahia through its capital, Salvador, and then rapidly disseminated to other cities, following the main roads. A linear regression model that included traffic flow, distance from the capital and DENV-1 circulation (r2 = 0.24, p = 0.001) supported this hypothesis. This pattern was not seen for serotypes already in circulation and was not seen for DENV-3 in the following year. Human population density was another important factor in the intensity of viral circulation. Neither 1 nor DENV-2 fit this model for DENV-2001 or DENV-2003. Since the vector has limited flight range and vector densities fail to correlate with intensity of viral circulation, this distribution represents the movement of infected people and to some extent mosquitoes. This pattern may mimic person-to-person spread of a new infection.
Key words: dengue - emerging diseases - surveillance - Aedes aegypti - public health - modeling
Dengue viruses are mosquito-borne RNA viruses of the Flaviviridae family. The four closely related sero-types (DENV-1-4) are thought to represent at least three independent introductions into human populations from sylvatic primates, the most recent (DENV-1) occurring within the last century (Wang et al. 2000). Dengue is one of the most important re-emergent infectious dis-eases and one of the most serious health problems af-fecting tropical and subtropical regions of the Americas (McBride & Bielefeldt-Ohmann 2000, Guzman & Kouri 2002). All four serotypes cause dengue fever (DF), a febrile illness characterized by severe joint and muscle pains, and in some cases, the potentially fatal dengue hemorrhagic fever (DHF) and dengue shock syndrome (DSS). The wide distribution of the mosquito vector
Aedes aegypti in the tropics and subtropics results in the exposure of approximately 2.5 billion individuals to dengue infection yearly (Mackenzie et al. 2004).
Consistent with this, dengue viruses are the most common, important Flavivirus causing human disease in Brazil (Figueiredo 2000). In the last 14 years, Brazil has accounted for nearly 70% of the 3,141,850 reported cases of DF in the Americas in the last five years (PAHO 2003). Some viral serotypes and the mosquito vector are now distributed throughout the country, and dengue outbreaks occur in all regions, especially the most popu-lated areas, such as in the state of Bahia (BA). By the
end of 2001, BA had only experienced epidemics with DENV-1 and DENV-2. Both of which were actively cir-culating when DENV-3 was introduced in 2002 and pro-duced the first cases of DHF in BA. In 1987, DENV-1 was isolated for the first time in BA in the city of Ipupiara, located in the center of the state (the Chapada Diamantina region) (Vasconcelos et al. 2000). A second serotype, DENV-2, was introduced in 1995 in the ex-treme south of the state, although its exact point of in-troduction was not identified. During these initial epi-demics in BA, the dynamics of introduction and subse-quent spread of the infection could not be followed state-wide, since the necessary public health protocols and the mechanism for viral isolation were not available. These were introduced in 1995 with development of a special unit at the state of Bahia’s Central Laboratory (LACEN) for DENV isolation. In this study, we used the information from viral isolations at the LACEN from 2001 to 2003 to assess the dynamics of circulation of DENV serotypes in BA before, during and after the first introduction of DENV-3.
MATERIALS AND METHODS
Study site - BA is the fifth-largest Brazilian state in territorial extension and comprises 6.64% of the total area of the country. BA has 13,323,212 inhabitants with nearly 25% concentrated in the metropolitan area close to Salvador, the state's capital. Approximately 69% of the state is considered arid or semi-arid. By contrast, the 1,183 km long coastline is generally tropical and hu-mid. Urbanization in BA is marked by concentration of the overwhelming part of the urban population in the capi-tal, thus making Salvador the only city in the state whose population exceeds 500,000. Nevertheless, the state is also characterized by the dispersion of the population in hundreds of smaller urban centers. In the last two de-Financial support: Fiocruz (PDTSP), CNPq, NIH (AI056263-01)
+Corresponding author: [email protected]
906 906 906 906
906 Dengue 3 dynamics • Paulo RS de Melo et al.
cades, there has been explosive growth of medium-sized urban centers (cities with more than 100,000 inhabit-ants). This has strengthened interurban networks and fa-cilitated individual movements for commerce and mi-gration. Although the majority of the state’s territory is agricultural, there is a good level of infrastructure with electricity and paved roads throughout most of its area.
Sampling - For administrative and epidemiologic purposes, the state is divided into municipalities, which are the basic reporting unit for the State Secretariat of Health (SSH). Dengue is a reportable disease in Brazil. The secretary of health in each municipality is respon-sible for collecting serum from each suspected case of dengue within five days of onset of symptoms, and send-ing this on to the LACEN for viral isolation and serol-ogy. All data were obtained directly from the LACEN or online public databases of the Brazilian government in 2004. In the analysis, the simplifying assumptions were made that the only difference between municipalities was the frequency with which serum was collected from sus-pected cases, and errors were not systematic, but random.
Viral isolation - Viral isolation was performed by inoculation of an Aedes albopictus C6/36 cell line with 25 µl of undiluted acute serum. The cell line was then incubated for seven days at 32°C in Leibovitz´s medium supplemented with 5% fetal calf serum. After fixation to slides in quadruplicate with cold buffered acetone, the cells were incubated with serotype-specific mono-clonal antibodies for each of the four serotypes followed by fluorescein conjugated anti-mouse antibodies. The slides were then scored as positive or negative by fluo-rescent microscopy (Gubler et al. 1984).
Statistical analysis - Since municipalities differed in their efficiency of submitting samples, a correction factor was calculated for each community for each month. The efficiency with which each municipality would send samples was calculated as the number of se-rum samples submitted for viral isolation divided by the number of cases notified for the month. The median ef-ficiency for all municipalities was used to correct the
total number of isolates per 100,000 populations. Se-rum samples were to be collected within the first five days of presentation and transported to Salvador within 24 h. This was clearly not always possible, and cases of-ten were identified after more than five days of symp-toms. Availability of roads is not an obstacle to trans-portation of serum samples. In order to compare the numbers of DENV isolates obtained from different mu-nicipalities, the efficiency of sample submission was calculated as in the following equation:
efficiency = frequency/median
where frequency is the ratio between number of sample submitted for viral isolation and the number of dengue cases registered by the SSH, and median is the median ratio for all municipalities submitting samples. The efficiency of sample collection was then used to standardize the number of isolates per 100,000 popula-tion as calculated in the following equapopula-tion:
standardized number of isolates = efficiency X recorded number of isolates X (population X 10-5)
For this analysis, the standardized number of isolates/ 100,000 will be a proxy for the intensity of serotype-specific viral circulation. Log transformation was used to normalize the viral circulation intensity per munici-pality, the number of cases of dengue, number of samples arriving at the LACEN and the number of viral isolates. Distance from Salvador was normally distributed as as-sessed by probability-probability plots.
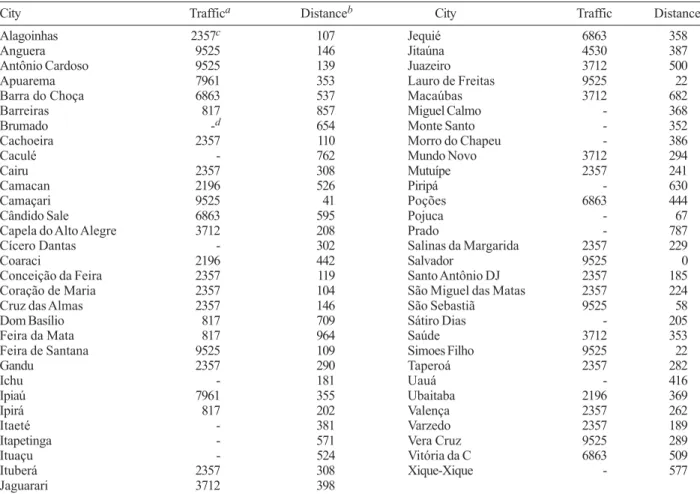
Viral circulation was plotted using the program Tabwin V. 3.0.1 (http://www.datasus.gov.br/tabwin/ download.htm) from the Brazilian Ministry of Health. Data on the number of notified cases, municipal popula-tion sizes and Ae. aegypti infestation indices were pro-vided by the BA-SSH through the Health Communica-tion and InformaCommunica-tion Directorate (DICS). Demographic data for the state and municipalities was obtained from the National Census Bureau (IBGE, http://www.ibge.gov.br). Traffic flow data (mean number of vehicles passing per day), and distances from Salvador were obtained from the National Department of Infrastructure and Transpor-tation. In BA, there are six electronic counting stations installed along the most important federal highways (Table I). The data from municipalities that were directly on these routes were analyzed separately from those that were located nearby. Since no qualitative differences were noted in the results, data on traffic flow for municipalities on and near (< 20 km) the major highways was used.
Multiple linear, forward stepwise regression analy-sis was conducted to identify predictor variables with an inclusion criterion of p < 0.15. Traffic flow, distance from Salvador (putative site of introduction), other viral serotypes, population size and vector infestation indi-ces (Surveillance Epidemiology Division from SSH) were used as independent variables to explain the inten-sity of DENV-3 circulation. The plot of the standardized residuals against the standardized predicted values showed no patterns by visual inspection, and the prob-ability-probability plots were essentially linear for all regression analyses.
TABLE I
Dengue virus serotype 3 (DENV-3) circulationa in 2002 was associated with distance from Salvador, traffic flow and
DENV-1 circulation in the state of Bahia
Model Adjusted r2 (p) ANOVA
Distance from Salvador 0.138 0.004 0.004 Distance from Salvador,
traffic flowb 0.202 0.032 0.002
Distance from Salvador,
traffic flow, DENV-1 0.235 0.087 0.001
907 907 907 907 907 Mem Inst Oswaldo Cruz, Rio de Janeiro, Vol. 102(8), December 2007
RESULTS
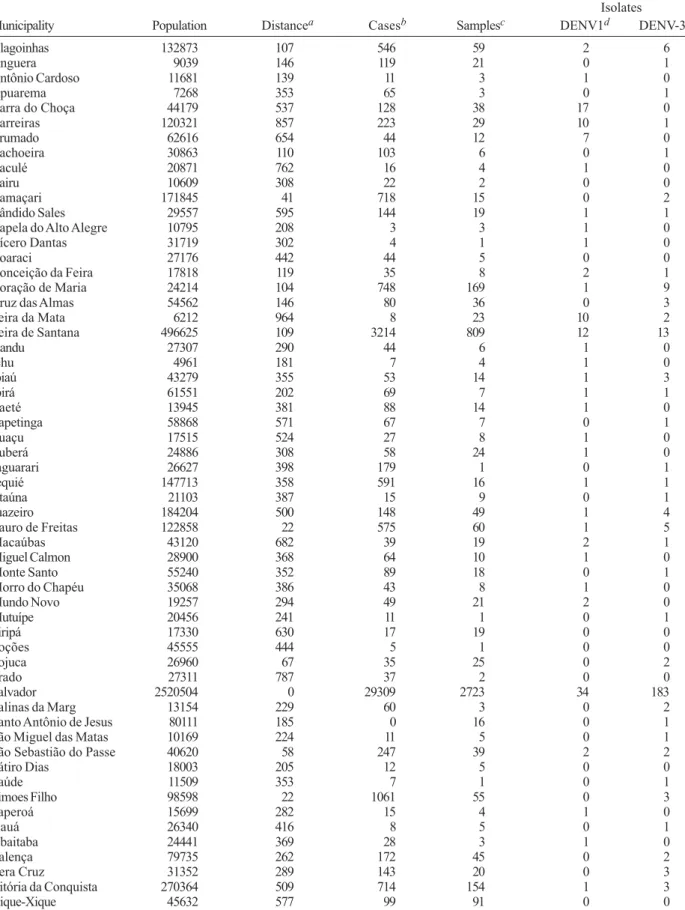
Characteristics of reporting - In 2002, the LACEN received samples from 58 of 417 municipalities in BA that also reported cases of dengue (Table II). DENV-1 or DENV-3 was isolated from 8% of the 4,777 samples received. DENV-3 isolates comprised 69% of the total. The number of samples per municipality arriving at the LACEN did not correlate with distance from Salvador (r2 = 0.01), but the number of samples did correlate with the number of cases (r2 = 0.56), and the number of cases correlated with the number of viral isolates (r2 = 0.54). This analysis was performed with the values for Salva-dor removed. The inclusion of SalvaSalva-dor produced higher correlations (data not shown).
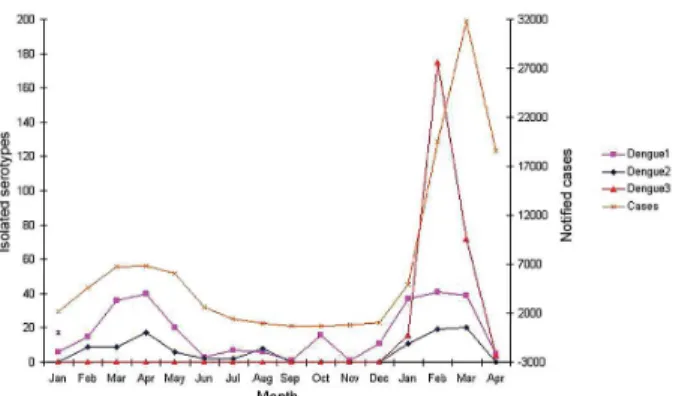
Temporal analyses - There was very active DENV-1 and DENV-2 transmission reflected in the number of vi-ral isolates in January through April of 2001. This fell from a high of 403 in March to 23 by June (Fig. 1). Un-even and sporadic isolations continued through the end of the year. In January of 2002, there was a small rise in the total number of samples submitted (193), and only DENV-1 and DENV-2 were isolated early in the month. Significantly, on January 18, the first recorded isolation of DENV-3 in BA was obtained from an individual living in a suburb of Salvador. Later in the month, there was a single isolation from the municipality of Valença, 100 km south along the coast from Salvador. Isolation of all circulat-ing serotypes continued to increase durcirculat-ing February and March, but isolation of DENV-3 clearly reached epidemic proportions relative to the other serotypes. Viral isolations as well as dengue cases declined steeply in April 2002.
In 2003, the initial DENV-3 isolates appeared in February instead of January. Prior to obtaining a positive sample from Salvador at the end of March 2003, the virus was isolated from eight small communities (mean population 29,000 ± 26,000) each on average > 500 km from Salvador.
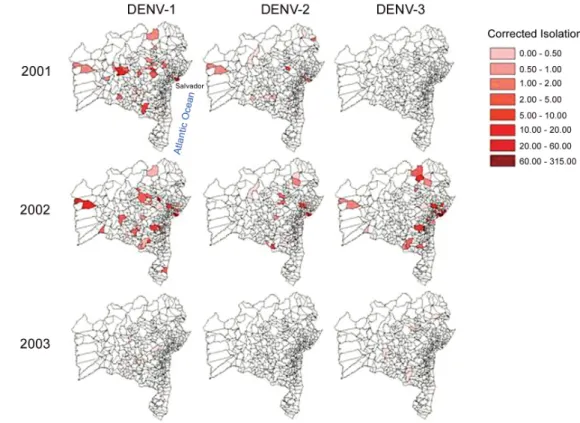
Spatial analyses - Samples were received for isola-tion from 15% (60/417 and 65/417) of municipalities for both 2001 and 2002, while cases of dengue were reported from 84% (352/417) and 94% (391/417), re-spectively. In 2001, DENV-1 circulated as intensely in some distant municipalities as in Salvador (Fig. 2). DENV-2 circulated with much lower intensity and no
DENV-3 was isolated. There is no indication that either virus might be distributed from a common source. Fol-lowing its appearance in BA, DENV-3 circulated in many of the same municipalities as DENV-1 (Fig. 2), but Sal-vador is located at the center of this subsequent diffu-sion with the intensity of circulation generally decreas-ing inversely with distance from Salvador.
Following the initial isolation of DENV-3 near Sal-vador in January 2002, all but one of the DENV-3 iso-lates for the month were from Salvador as well. By Feb-ruary, DENV-3 was isolated from some of the most dis-tant municipalities from Salvador (Fig. 3). The capital remained one of the most important foci throughout the rest of this quarter and remained a focus of circulation even as the epidemic waned in April. The pattern of iso-lations for DENV-1 and DENV-2 did not conform to this pattern in any year studied. The pattern of appearance of DENV-3 did not appear as an enlarging concentric ring around the capital, nor did it appear random within the state. An overlay of the principal highways of the state shows that these roadways extend through the municipalities from which DENV-3 was most isolated in 2002 (Fig. 4).
DENV-1 and DENV-3 in 2003 continued to circulate in generally overlapping areas, except that DENV-3 con-tinued to be more intensely associated with Salvador than DENV-1. DENV-2 did not circulate in 2003 (data not shown), and there was no single predominant region for intensity of DENV-1 or DENV-3 circulation.
Relationship of traffic volume and distance to DENV-3 circulation - Since Ae. aegypti, the vector of the dengue virus, has a very short flight range, human movement is the principal method for spread of the dis-ease by either taking infected individuals to uninfected mosquitoes or humans carrying infected mosquitoes to where there are uninfected people (McDonald 1977, Trpis & Hausermann 1986, Reiter et al. 1995, Getis et al. 2003, Huber et al. 2004, Harrington et al. 2005). If Salvador represented the initial focus and point of dis-semination, the intensity of circulation in the state should be a function of distance from Salvador modified by the degree of human movement (migration and commercial) in the area. Linear regression was used to test this hy-pothesis. The log normalized intensity DENV-3 circula-tion was modeled with traffic flow along the main high-way, distance from Salvador, log-normalized DENV-1 circulation intensity and DENV-2 circulation (Table III). The stepwise analysis revealed that a model that included (in order of significance) traffic flow and distance from Salvador produced an adjusted r2 = 0.278 when direct traffic flow was used (p = 0.031, Table I). The model worsened with the addition of any other variable, and the r2 was also reduced when flow estimates were assigned to municipalities near but not directly on routes with counting stations. The coefficients for traffic flow were positive, while those for distance from Salvador were negative. The inverse square of distance was also tested, but did not improve the correlation. When DENV-1 or DENV-2 was used as the dependent variable, neither showed any significant correlations with distance or traf-fic volume in 2001 or 2002 (Table IV). In 2003, DENV-2 did not circulate, and isolation of DENV-1 or DENV-3 did not correlate with any of the tested variables.
908 908 908 908
908 Dengue 3 dynamics • Paulo RS de Melo et al.
TABLE II
Origin and characteristics of samples sent to Bahia's Central Laboratory (LACEN), 2002
Isolates
Municipality Population Distancea Casesb Samplesc DENV1d DENV-3e
Alagoinhas 132873 107 546 59 2 6
Anguera 9039 146 119 21 0 1
Antônio Cardoso 11681 139 11 3 1 0
Apuarema 7268 353 65 3 0 1
Barra do Choça 44179 537 128 38 17 0
Barreiras 120321 857 223 29 10 1
Brumado 62616 654 44 12 7 0
Cachoeira 30863 110 103 6 0 1
Caculé 20871 762 16 4 1 0
Cairu 10609 308 22 2 0 0
Camaçari 171845 41 718 15 0 2
Cândido Sales 29557 595 144 19 1 1
Capela do Alto Alegre 10795 208 3 3 1 0
Cícero Dantas 31719 302 4 1 1 0
Coaraci 27176 442 44 5 0 0
Conceição da Feira 17818 119 35 8 2 1
Coração de Maria 24214 104 748 169 1 9
Cruz das Almas 54562 146 80 36 0 3
Feira da Mata 6212 964 8 23 10 2
Feira de Santana 496625 109 3214 809 12 13
Gandu 27307 290 44 6 1 0
Ichu 4961 181 7 4 1 0
Ipiaú 43279 355 53 14 1 3
Ipirá 61551 202 69 7 1 1
Itaeté 13945 381 88 14 1 0
Itapetinga 58868 571 67 7 0 1
Ituaçu 17515 524 27 8 1 0
Ituberá 24886 308 58 24 1 0
Jaguarari 26627 398 179 1 0 1
Jequié 147713 358 591 16 1 1
Jitaúna 21103 387 15 9 0 1
Juazeiro 184204 500 148 49 1 4
Lauro de Freitas 122858 22 575 60 1 5
Macaúbas 43120 682 39 19 2 1
Miguel Calmon 28900 368 64 10 1 0
Monte Santo 55240 352 89 18 0 1
Morro do Chapéu 35068 386 43 8 1 0
Mundo Novo 19257 294 49 21 2 0
Mutuípe 20456 241 11 1 0 1
Piripá 17330 630 17 19 0 0
Poções 45555 444 5 1 0 0
Pojuca 26960 67 35 25 0 2
Prado 27311 787 37 2 0 0
Salvador 2520504 0 29309 2723 34 183
Salinas da Marg 13154 229 60 3 0 2
Santo Antônio de Jesus 80111 185 0 16 0 1
São Miguel das Matas 10169 224 11 5 0 1
São Sebastião do Passe 40620 58 247 39 2 2
Sátiro Dias 18003 205 12 5 0 0
Saúde 11509 353 7 1 0 1
Simoes Filho 98598 22 1061 55 0 3
Taperoá 15699 282 15 4 1 0
Uauá 26340 416 8 5 0 1
Ubaitaba 24441 369 28 3 1 0
Valença 79735 262 172 45 0 2
Vera Cruz 31352 289 143 20 0 3
Vitória da Conquista 270364 509 714 154 1 3
Xique-Xique 45632 577 99 91 0 0
909 909 909 909 909 Mem Inst Oswaldo Cruz, Rio de Janeiro, Vol. 102(8), December 2007
Fig. 2: comparison of yearly intensity of dengue virus serotypes circulation (DENV-1, 2 and 3) 2001 - 2003 in Bahia, Brazil. Maps of state of Bahia municipalities (www.datasus.gov.br/tabwin/tabwin.htm) by year and by serotype showing intensity of viral circulation (standardized number of viral isolations) indicated in legend.
Fig. 3: comparison of monthly intensity of dengue serotype 3 (DENV-3) circulation (standardized isolates/100,000), Jan-Apr 2002 in Bahia, Brazil.
Additional factors associated with intensity of DENV-3 circulation - Traffic volume and distance from Salvador explain approximately 27% of the variation in DENV-3 circulation intensities in 2002. To assess the contribution of other factors, both population size and municipal vector infestation indices (household and Breteau) were included in the model. The size of the population had the largest effect of any variable, and pro-duced a model with r2 = 0.565, p= 0.0003 (Table V). The variables traffic volume, distance from Salvador and log of the standardized DENV-1 circulation also entered into the model, but neither of the infestation indices contributed. The r2 was reduced when traffic volume was removed (r2 = 0.431) or the estimated traffic volume for municipalities not directly on monitored routes was
used (r2 = 0.488). Collinearity diagnostics showed that population and traffic volume were independent, and thus traffic volume was not merely a surrogate for popula-tion size. For this epidemic: DENV-3 circulapopula-tion = 0.663 + (0.574) population size + (0.190) traffic volume + (-0.266) distance from Salvador + (0.158) log10 other viral circulation.
DISCUSSION
The dengue epidemic of 2002 was the most severe yet experienced BA. The first recorded cases of DHF occurred during this period. Although the epidemic spike was clearly due to the introduction of DENV-3, the stage was set by a previous decade of spreading
in-910 910 910 910
910 Dengue 3 dynamics • Paulo RS de Melo et al.
TABLE III
Distance and estimated traffic volume used for municipalities with DENV isolations, 2002
City Traffica Distanceb City Traffic Distance
Alagoinhas 2357c 107 Jequié 6863 358
Anguera 9525 146 Jitaúna 4530 387
Antônio Cardoso 9525 139 Juazeiro 3712 500
Apuarema 7961 353 Lauro de Freitas 9525 22
Barra do Choça 6863 537 Macaúbas 3712 682
Barreiras 817 857 Miguel Calmo - 368
Brumado -d 654 Monte Santo - 352
Cachoeira 2357 110 Morro do Chapeu - 386
Caculé - 762 Mundo Novo 3712 294
Cairu 2357 308 Mutuípe 2357 241
Camacan 2196 526 Piripá - 630
Camaçari 9525 41 Poções 6863 444
Cândido Sale 6863 595 Pojuca - 67
Capela do Alto Alegre 3712 208 Prado - 787
Cícero Dantas - 302 Salinas da Margarida 2357 229
Coaraci 2196 442 Salvador 9525 0
Conceição da Feira 2357 119 Santo Antônio DJ 2357 185
Coração de Maria 2357 104 São Miguel das Matas 2357 224
Cruz das Almas 2357 146 São Sebastiã 9525 58
Dom Basílio 817 709 Sátiro Dias - 205
Feira da Mata 817 964 Saúde 3712 353
Feira de Santana 9525 109 Simoes Filho 9525 22
Gandu 2357 290 Taperoá 2357 282
Ichu - 181 Uauá - 416
Ipiaú 7961 355 Ubaitaba 2196 369
Ipirá 817 202 Valença 2357 262
Itaeté - 381 Varzedo 2357 189
Itapetinga - 571 Vera Cruz 9525 289
Ituaçu - 524 Vitória da C 6863 509
Ituberá 2357 308 Xique-Xique - 577
Jaguarari 3712 398
a: mean daily volume as measured in 2001 by fixed electronic sensors at six stations (Table I); b: distance from Salvador; c: values in bold indicate municipalities directly on the monitored routes; d: municipalities too distant from monitored routes to estimate traffic flow. fections. Thus, prior to the introduction of DENV-3, 69% of the population of Salvador was seropositive for at least one dengue virus (Teixeira et al. 2002). Viral isolation from clinical samples was instituted in the LACEN after DENV-1 and DENV-2 began to circulate, so that the 2002 epidemic was the first that could be tracked state-wide from its introduction. The institution of state-wide viral isolations was an essential tool in the epidemiology of this disease, since the registra-tion of dengue cases alone does not allow for a recon-struction of what was occurring and how it occurred in the presence of multiple circulating serotypes.
Both time and space place the introduction of DENV-3 infection in Salvador in January 2002. For two weeks this serotype was only isolated from infected individuals in Salvador despite continued receipt of samples and iso-lation of other serotypes from all corners of BA. The next site for the dissemination of the virus was the trans-portation hub of Feira de Santana, 40 km west of the capi-tal. In less than 30 days this virus was distributed to the rest of the state. Even after its introduction and dissemi-nation, the capital remained the site of the most intense circulation of DENV-3, but not necessarily the other serotypes. The significant positive correlation with
911 911 911 911 911 Mem Inst Oswaldo Cruz, Rio de Janeiro, Vol. 102(8), December 2007
fic flow, the negative correlation with distance from Svador, the absence of this pattern for the serotypes al-ready present and for DENV-3 in the following year all support the hypothesis that Salvador was the center of distribution for DENV-3 during the 2002 epidemic.
While it may not be surprising that this virus would follow the major transportation routes out of the capi-tal, this was not the pattern for the introduction and dis-tribution of DENV-1 and DENV-2 (Vasconcelos et al. 2000). These two were introduced in smaller cities in the state and had a less clear pattern for subsequent dis-tribution. One important factor in the more halting spread for those earlier introductions was that the distribution of Ae. aegypti was less extensive. From the time of first introduction of dengue in the state (1987) up to 2001, the number of municipalities reporting Ae. aegypti in-festation in Brazil increased by 800% (Teixeira et al. 2001). Infected individuals traveling to a new area in the 1980s and 1990s were not as likely to encounter a vec-tor as in 2002.
The low percent of municipalities sending samples for viral isolation may have produced a bias toward col-lections from population and transportation centers and this might have explained the pattern for isolations in 2002. However, no such pattern was observed for 2001 when there was a similar percentage of municipalities providing samples. In addition, those collecting samples had no idea of the serotype of the infecting virus, but only DENV-3 demonstrated a distribution associated with distance from Salvador and traffic flow.
Although a vector-borne disease, the pattern of spread of DENV-3 in BA in 2002 has some features in common
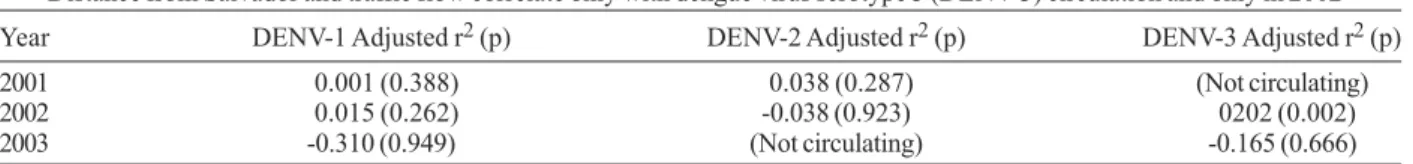
TABLE IV
Distance from Salvador and traffic flow correlate only with dengue virus serotype 3 (DENV-3) circulation and only in 2002a
Year DENV-1 Adjusted r2 (p) DENV-2 Adjusted r2 (p) DENV-3 Adjusted r2 (p)
2001 0.001 (0.388) 0.038 (0.287) (Not circulating)
2002 0.015 (0.262) -0.038 (0.923) 0202 (0.002)
2003 -0.310 (0.949) (Not circulating) -0.165 (0.666)
a: linear multiple regression where the dependent variable is viral circulation (standardized isolates/100,000) per municipality and the independent variables are distance from Salvador (km) and traffic flow (mean daily number of passing vehicles on the major highway < 50 km away).
with a point source introduction and subsequent distri-bution of a new pathogen with person-to-person spread. The mosquito vector, Ae. aegypti, has a short flight range, so that its own movements are unlikely to contribute much to the rapid distribution of this serotype of den-gue (McDonald 1977, Trpis & Hausermann 1986, Reiter et al. 1995, Getis et al. 2003, Huber et al. 2004, Harrington et al. 2005). The heavy dependence of this infection on human movement and, indirectly, human contact may make the distribution of new dengue sero-types a model for the introduction of diseases that re-quire person-to-person spread. While the movement of the human population is often cited a key to dengue trans-mission (Rodhain 1992, Pinheiro & Corber 1997, da Costa-Ribeiro et al. 2006), models of dengue transmis-sion, however, often fail to include human mobility as an explanatory factor (Newton & Reiter 1992, Focks et al. 1995, 2000, Lifson 1996, Atkinson et al. 2007). Our findings further support the central role of the human population in viral dissemination.
The greatest weakness of these data is that they are secondary or relatively incomplete. Thus, the results must be viewed with caution. Nonetheless, lack of correla-tion between numbers of serum samples received and distance from the LACEN in Salvador as well as the cor-relation between number of samples received and num-ber of cases of dengue indicate that the data are not ran-dom or a function of convenience. They likely represent the intensity of viral circulation. While distance was measured with good accuracy, traffic volume was some-times assigned based on some distant point of measure-ment. Since misspecification lowers the power and sig-nificance of analyses, it is likely that more accurate measurements would produce even stronger correlations. Distance and traffic flow, however, only explained 28% of the variance. Clearly there were other factors that could influence this pattern. One of these was popula-tion size. The intensity of viral circulapopula-tion was strongly dependent on density and availability of susceptible dividuals. Vector density did not correlate well with in-tensity of viral circulation in this study.
One issue related to this being a “new” virus for this population was the active circulation of two other den-gue serotypes. There is a brief period of two months following acute infection in which immunity develops to all dengue serotypes (Sabin 1952), so co-circulation of two serotypes might interfere with the spread of a third serotype. From the regression analysis, however, the co-circulation of other DENV did not lead to rela-TABLE V
Linear multiple regression analysis of dengue virus serotype 3 (DENV-3) circulation in 2002
Modela Adjusted r2 P
Populationb 0.399 < 10-5
Population, traffic flow 0.490 < 10-6 Population, traffic flow, distance 0.487 < 10-5 Population, traffic flow,
distance, logDENV-1c 0.488 < 10-5
912 912 912 912
912 Dengue 3 dynamics • Paulo RS de Melo et al.
tive inhibition of DENV-3. DENV-1 circulation was in fact positively correlated with DENV-3 circulation. This might suggest that the factors that allowed DENV-1 to circulate successfully may have also promoted DENV-3 circulation to overcome whatever degree of cross-im-munization that might have existed. On the other hand, no cases of dual infection were detected, which may sug-gest some interference, albeit the viral isolation method may be insensitive to dual infection.
Finally, the analysis of new introductions is very im-portant to the study of the dynamics of viral diseases, since even one year after the introduction, understand-ing the pattern of dissemination becomes more com-plex. The level of immunity in the population must be ac-counted for. Thus, the opportunity to analyze this circum-stance again any time soon in Brazil will only present itself with the introduction of DENV-4 or another new disease.
ACKNOWLEDGMENTS
To the Biomedical Section of the State Central Laboratory of Bahia (LACEN), as well as Emanuel Araújo and Jesuina Costa and other staff members in SESAB for epidemiologic data. To Dr. M Gloria Teixeira for her useful information on patterns of vector distribution within the state.
REFERENCES
Atkinson MP, Su Z, Alphey N, Alphey LS, Coleman PG, Wein LM 2007. Analyzing the control of mosquito-borne diseases by a dominant lethal genetic system. Proc Natl Acad Sci USA104: 9540-9545.
da Costa-Ribeiro MC, Lourenco-de-Oliveira R, Failloux AB 2006. Geographic and temporal genetic patterns of Aedes aegypti
populations in Rio de Janeiro, Brazil. Trop Med Int Health 11: 1276-1285.
Figueiredo LT 2000. The Brazilian flaviviruses. Microbes Infect 2: 1643-1649.
Focks DA, Brenner RJ, Hayes J, Daniels E 2000. Transmission thresholds for dengue in terms of Aedes aegypti pupae per person with discussion of their utility in source reduction ef-forts. Am J Trop Med Hyg62: 11-18.
Focks DA, Daniels E, Haile DG, Keesling JE 1995. A simulation model of the epidemiology of urban dengue fever: literature analy-sis, model development, preliminary validation, and samples of simulation results. Am J Trop Med Hyg53: 489-506. Getis A, Morrison AC, Gray K, Scott TW 2003. Characteristics
of the spatial pattern of the dengue vector, Aedes aegypti, in Iquitos, Peru. Am J Trop Med Hyg69: 494-505.
Gubler DJ, Kuno G, Sather GE, Velez M, Oliver A 1984. Mos-quito cell cultures and specific monoclonal antibodies in surveil-lance for dengue viruses. Am J Trop Med Hyg33: 158-165. Guzman MG, Kouri G 2002. Dengue: an update. Lancet Infect
Dis2: 33-42.
Harrington LC, Scott TW, Lerdthusnee K, Coleman RC, Costero A, Clark GG, Jones JJ, Kitthawee S, Kittayapong P, Sithiprasasna R, Edman JD 2005. Dispersal of the dengue
vector Aedes aegypti within and between rural communi-ties. Am J Trop Med Hyg72: 209-220.
Huber K, Loan LL, Chantha N, Failloux AB 2004. Human trans-portation influences Aedes aegypti gene flow in Southeast Asia. Acta Trop90: 23-29.
Lifson AR 1996. Mosquitoes, models, and dengue. Lancet347: 1201-1202.
Mackenzie JS, Gubler DJ, Petersen LR 2004. Emerging flaviviruses: the spread and resurgence of Japanese encepha-litis, West Nile and dengue viruses. Nat Med10: S98-109. McBride WJ, Bielefeldt-Ohmann H 2000. Dengue viral
infec-tions; pathogenesis and epidemiology. Microbes Infect2: 1041-1050.
McDonald PT 1977. Population characteristics of domestic Aedes aegypti (Diptera: Culicidae) in villages on the Kenya Coast I. Adult survivorship and population size. J Med Entomol 14: 42-48.
Newton EA, Reiter P 1992. A model of the transmission of dengue fever with an evaluation of the impact of ultra-low volume (ULV) insecticide applications on dengue epidemics. Am J Trop Med Hyg47: 709-720.
PAHO - Pan American Health Organization 2003. Surveillance-featured surveillance items. http://www.paho.org/english/ad/ dpc/cd/dengue.html [cited 2003 Nov 23].
Pinheiro FP, Corber SJ 1997. Global situation of dengue and den-gue haemorrhagic fever, and its emergence in the Americas.
World Health Stat Q50: 161-169.
Reiter P, Amador MA, Anderson RA, Clark GG 1995. Short re-port: dispersal of Aedes aegypti in an urban area after blood feeding as demonstrated by rubidium-marked eggs. Am J Trop Med Hyg52: 177-179.
Rodhain F 1992. Recent data on the epidemiology of dengue fever. Bull Acad Natl Med176: 223-236.
Sabin AB 1952. Research on dengue during World War II. Am J Trop Med Hyg1: 30-50.
Teixeira MG, Barreto ML, Costa M da C, Ferreira LD, Vasconcelos PF, Cairncross S 2002. Dynamics of dengue virus circulation: a silent epidemic in a complex urban area. Trop Med Int Health 7: 757-762.
Teixeira MG, Costa MC, Barreto ML, Barreto FR 2001. Epide-miology of dengue in Salvador-Bahia, 1995-1999. Rev Soc Bras Med Trop34: 269-274.
Trpis M, Hausermann W 1986. Dispersal and other population parameters of Aedes aegypti in an African village and their possible significance in epidemiology of vector-borne diseases.
Am J Trop Med Hyg35: 1263-1279.
Vasconcelos PF, Mota K, Straatmann A, Santos-Torres S, Travasso da Rosa AP, Tavares Neto J 2000. A dengue epi-demic in Ipupiara and Prado, Bahia. A seroepidemiologic survey. Rev Soc Bras Med Trop33: 61-67.