ENVIRONMENTAL DECISION-MAKING
UTILIZING A WEB GIS TO MONITOR
HAZARDOUS INDUSTRIAL EMISSIONS
IN THE VALENCIAN COMMUNITY OF SPAIN
ENVIRONMENTAL DECISION-MAKING UTILIZING A WEB GIS
TO MONITOR HAZARDOUS INDUSTRIAL EMISSIONS IN THE
VALENCIAN COMMUNITY OF SPAIN
Dissertation supervised by Dr. Laura Díaz, PhD
Dissertation co-supervised by Dr. Edward Pultar, PhD Professor Miguel Neto, Ph.D
ACKNOWLEDGMENTS
I would like express my sincere gratitude to my supervisor Dr. Laura Díaz for continuous support and patience. This study would not have been successful without her encouragement and motivation. I would like to thank my co-supervisors Dr. Edward Pultar and Dr. Miguel Neto for their invaluable comments and feedback.
I would like to acknowledge Dr. Jorge Mateu and Dr. Ismael Sanz for their support and technical advices and Dr. Joaquin Huerta for his support during the Master’s program.
ENVIRONMENTAL DECISION-MAKING UTILIZING A WEB GIS
TO MONITOR HAZARDOUS INDUSTRIAL EMISSIONS IN THE
VALENCIAN COMMUNITY OF SPAIN
ABSTRACT
KEYWORDS
Web GIS Interoperability Geovisualization Web Map Service
Environmental monitoring
ACRONYMS
GIS – Geographic Information Systems SOA – Service-Oriented Architecture EEA – European Environment Agency
E-PRTR – European Pollutant Release and Transfer Register OGC – Open Geospatial Consortium
SDI – Spatial Data Infrastructure WWW – World Wide Web
CPCB – Central Pollution Control Board EU – European Union
SRID – Spatial Reference System Identifier WMS – Web Map Service
WFS – Web Feature Service SVG – Scalable Vector Graphics WKT – Well-known text
INSPIRE – Infrastructure for Spatial Information in the European Community CAD – Computer-Aided Design
GPS – Global Positioning System DBMS – Database Management System AJAX – Asynchronous JavaScript and XML GWT – Google Web Toolkit
RPC – Remote Procedure Call JSON – JavaScript Object Notion
IDE – Integrated Development Environment OSM – OpenStreetMap
INDEX OF THE TEXT
ACKNOWLEDGMENTS...iii
ABSTRACT...iv
KEYWORDS………..…...v
ACRONYMS...vi
INDEX OF FIGURES ……….…ix
1. INTRODUCTION……….…..1
1.1 Problem statement……….…..1
1.2 Objectives……….…...4
1.3 Methodology………..…..5
1.3 Thesis structure………..…..6
2. THEORETICAL FRAMEWORK………..…...8
2.1 Environmental monitoring………..….8
2.2 Air pollution………....9
2.3 Web GIS……….………..……….11
3. ARCHITECTURE………..……...13
3.1 Interoperability and GIS……….……...13
3.1.1 Service-Oriented Architecture………....13
3.1.2 Spatial Data Infrastructure………..14
3.1.3 Open Geospatial Consortium……….……….…14
3.1.4 Standard-based Services..……….…..15
3.1.5 INSPIRE……….…16
3.2 Web GIS Architecture...………17
3.2.1 Components of Web GIS………18
3.2.1.1 Presentation tier………...19
3.2.1.2 Service tier………...19
4. TECHNOLOGIES AND METHODS……….22
4.1 Web mapping technologies………...22
4.1.1 AJAX………..22
4.1.2 Google Web Toolkit………...22
4.1.3 OpenLayers……….24
4.2 Geospatial services standard implementation………25
4.2.1 GeoServer………...25
4.3 Spatial Database………26
4.3.1 PostgreSQL and PostGIS………27
4.4 Pollutant Emissions Distribution Simulation………28
4.4.1 Inverse Distance Weighted Interpolation………...28
5. IMPLEMENTATION………...30
5.1 Data Model………30
5.2 Geospatial Service Implementation and Deployment………...33
5.3 Application Logic……..………34
5.4 IDW Model………..………..36
6. USE CASE: Industrial emissions in Valencian Community……….38
6.1 Study Area Description……….38
6.2 Systems’ Prototype …..……….39
6.2.1 Air Pollution Monitoring………42
6.2.2 IDW Interpolation………...43
7. CONCLUSIONS………45
INDEX OF FIGURES
Figure 1. E-PRTR downloadable data (http://prtr.ec.europa.eu/, 2011)………3
Figure 2. The structure of the E-PRTR database (http://prtr.ec.europa.eu/, 2011)……...5
Figure 3. E-PRTR………...………...8
Figure 4. Relationship between clients/servers and some OGC protocols (http://en.wikipedia.org/wiki/Open_Geospatial_Consortium, 2011)………..15
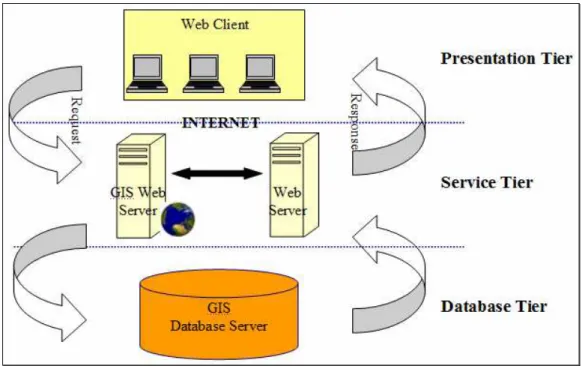
Figure 5. Application architecture………...…19
Figure 6. GWT project in Eclipse IDE………24
Figure 7. GeoServer interface ……….26
Figure 8. Data Model design………...………31
Figure 9. Populating the database...………...32
Figure 10. Geospatial Services Deployment………...33
Figure 11. GeoServer interface (http://geoinfo.dlsi.uji.es:8080/geoserver/, 2011)…….34
Figure 12. GWT RPC mechanism………...36
Figure 13. Study area (http://www.europeinns.com/regions/valencian-community.jpg, 2011)………38
Figure 14. The Use Case Diagram………...40
Figure 15. Application user interface………..40
Figure 16. Information about the industry………...………41
Figure 17. Querying the database………...……….42
Figure 18. Query Result…………..……….43
1. INTRODUCTION
Air pollution is a crucial world issue in the present day. The use of fossil fuels has been the major component of air pollutants and emissions, which has resulted in many environmental and health problems (Slanina 2004). Population growth and thereby rising demand for products have influenced the situation and increased the problem extent. Governments and industries are becoming environmentally aware and have an increasing desire to monitor the status of the Earth.
Public officials as well as environmental managers are in need of suitable tools for visualization, manipulation and analysis of environmental data. Thirty years ago terms such as “environmental monitoring”, “risk assessment”, “contamination management” and “risk management” were not common. This was due to the fact that environmental protection efforts have grown rapidly in the previous three decades becoming a specific interest of scientific, technical, economic and political experts (Ilyushchenko and Kamberov 2004).
Progress in information technologies and particularly Geographic Information Science and Systems has made GIS key for managers interacting with environmental data (Dragicevic et al. 2000). GIS are now widely accepted and exploited as powerful tools for storing, manipulating, visualizing and analyzing geospatial data (Dragicevic 2004).
1.1 Problem statement
Union Member States. Available information includes the amount of pollutants each facility releases into the air, water and land. Emissions into the atmosphere are of particular interest in this thesis.
E-PRTR is a large database containing valuable information concerning pollution from almost all industrial enterprises. Society will benefit if these data are used to improve monitoring and aid environmental management. One key challenge is:
How do we make environmental data accessible, open, and mobile while at the same
time utilizing interoperable systems for data consumption?
This challenge is addressed in order to achieve the ultimate goal of advancing environmental monitoring thus improving the status of the environment.
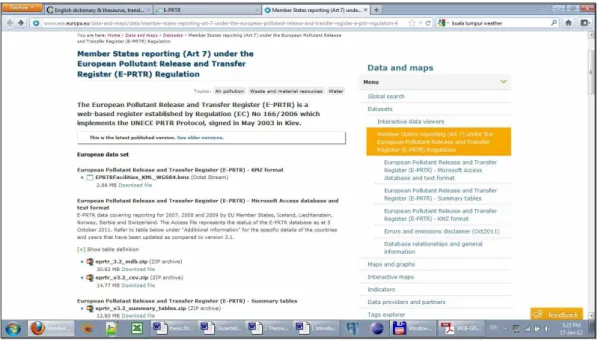
However, there are several difficulties in fully utilizing this international data source. First, the information produced must be downloaded prior to its use (Figure 1). Second, maps offered in graphical formats are “pre-queried” thus limiting user interaction. Point data are available in KMZ or Microsoft Access formats which in this case complicates visualisation aspects due to enormous amount of data points that freezes even powerful personal computers. Last, the data are not currently integrated into a publicly available GIS, which would allow citizens to be more aware of their current environment and make decisions based on this data. All of these factors take away from the potential flexibility, applicability and interoperability of the E-PRTR data.
with embedded vector geometry and spatial reference system. It is essential not only for visualisation but also for the spatial analysis that is significant part of the project. Afterwards the database is posted on a Web server and also published as a geospatial service, thus it becomes available for further projects. Data availability in the form of geospatial services is of a profound importance to GIS today since it provides with platform independent access.
The achievements mentioned are attained by creation of a distributed Web GIS which components reside on physically separate servers. The system provides with functionalities to interact with the spatial database, to consume geospatial services WMS and WFS, to perform spatial analysis and to visualize data.
Figure 1. E-PRTR downloadable data (source http://prtr.ec.europa.eu/, 2011)
1.2 Objectives
There are five research objectives addressed in the paper:
1. Design and create a spatially-enabled relational database to store an international environmental data set.
2. Provide interoperable access to the database and expose it for publication, invocation, discovery and reusability using standard internet protocols. 3. Develop a Web GIS to manipulate the environmental data set in order to
facilitate air pollution monitoring and enhance risk assessment studies. 4. Create a model to simulate distribution of air pollutants and assess a
population’s exposure to industrial emissions.
Research objectives are complemented and inspired by personal objectives:
1. Explore open source tools and libraries for Web-based GIS development.
2. Acquire knowledge and skills in the field of computer science for client/server Web application development.
3. Gain knowledge and skills for Geospatial Web services implementation and integration.
4. Acquire knowledge and skills in geospatial modeling methods to simulate air pollutant distribution.
The expected outcome of the research is a Web-based GIS application implemented using open source tools and libraries that conform to Open Geospatial Consortium (OGC) specifications. The application facilitates monitoring of air pollution sources and their possible influence on human populations. It advances environmental monitoring by means of Web mapping tools and user-friendly interfaces. The application also provides data query functions to reveal:
b) Industries with emissions that exceed a critical level of a particular pollutant for a given year
c) Atmospheric distribution of a specified pollutant.
Consequently, the application enhances urban area risk assessments and aids environmental monitoring techniques.
1.3 Methodology
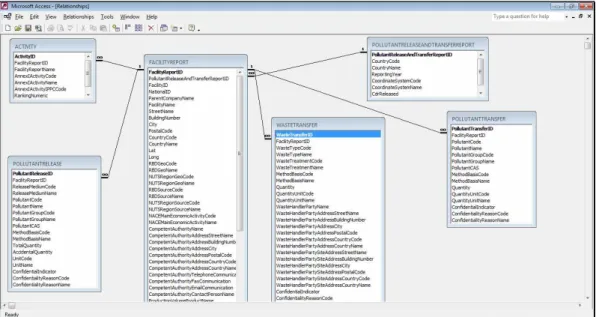
The proposed interoperable approach using a service-based architecture is implemented as a three-tier GIS application. These three tiers are the data tier, service tier and presentation tier. One of the initial steps for this research is the creation of a spatial database. The E-PRTR database is distributed in Microsoft Access format and the database is designed to support geographical objects (Figure 2). Storing data in a spatial database allows for geovisualization as well as spatial analysis.
Figure 2. The structure of the E-PRTR database (source http://prtr.ec.europa.eu/, 2011)
data interoperability. Then implementing OGC standards we share data as geospatial services WMS and WFS that can be accessed and consumed by other services or applications. Anderson and Moreno-Sanchez (2003) argue that system’s compliance with OGC standards enables operability. Depending of the standardized interface geospatial services provide different functionality - visualization and download respectively. The use of standard-based interface enhances reusability and interoperability. The user interacts with a lightweight or thin client application of the presentation tier, and consumes Web services that provide access, editing capabilities and visualization of geospatial data. The service tier, where the system’s logic resides, provides data retrieval from the database along with visualisation and communication between system components.
1.4 Thesis structure
This thesis consists of seven chapters. The first chapter describes the context, background and importance of the topic. It also identifies the problems, defines objectives and provides an overview of the thesis structure.
The second chapter provides related work, particularly addressing air pollution management issues and environmental monitoring. This chapter also describes the electronic database of the Pollutant Release and Transfer of the European Environmental Agency. Relevant articles and developments in Web-based mapping applications for environmental monitoring are discussed in this chapter.
Chapter 4 gradually moves from concepts to a description of Web mapping technologies and methods. This includes a spatial database management system, tools for Web-based application development and a GIS server that promotes distributed access to geospatial data.
Chapter 5 describes the details of the prototype implementation, such as the data model, geospatial services deployment and communication between the components. It also provides a detailed description of interaction between the system’s components.
Chapter 6 presents an example use case and highlights the way the system processes real data queries.
2. THEORETICAL FRAMEWORK
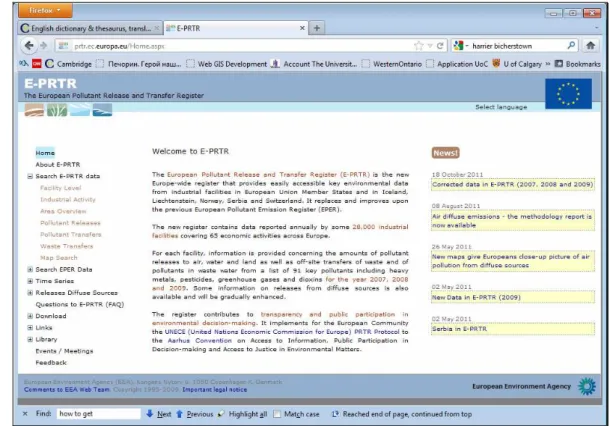
In Europe the European Environment Agency (EEA) is responsible for independent environmental information provision (http://www.eea.europa.eu/). It is an official information source for those involved in developing, adopting, implementing and evaluating environmental policy in addition to the general public (http://www.eea.europa.eu/). It currently collects data from 32 member countries (Figure 3).
E-PRTR is provided by the EEA and contains key environmental data from industrial facilities (http://prtr.ec.europa.eu). The register contributes to transparency and public participation in environmental decision-making.
2.2 Air pollution
Air quality has been deteriorating due to global development and increasing population demands. Growing cities and urban migrations, increases in traffic and energy consumption, plus additional industrial and economic development has resulted in increases of air pollution (CPCB, 2000; Copies, 2009). The burning of fuels for industrial activities and transportation results in various kinds of combustion products which also contribute to air pollution (Slanina 2004). Serious health problems such as damage to the immune system, respiratory, neurological and reproductive problems can be caused by exposure to toxic air pollutants.
Two general groups of pollutants have been identified based on their nature of formation: primary and secondary pollutants. The former are directly emitted from the source and are comprised of sulphur dioxide, nitric oxide, carbon monoxide and dioxide. The latter are formed in the atmosphere as a result of reactions between normal air constituents and primary pollutants. These include sulphur trioxide, nitrogen dioxide, and peroxy acyl nitrate among others.
Environmental pollution due to oil exploration and spills is an interest of those monitoring the environment. Toldo and Auyp Zouain (2009) explore recently developed non-aqueous fluids in the petroleum industry. The authors consider biota exposure to petroleum- and diesel-based fluids that are used for well drilling. The monitoring program proposed includes drilling a number of exploratory wells and aimed to determine the type of biota living in the oceanic ecosystem. This is done to assess the effect of the non-aqueous fluids on the deep-water biotic community and to evaluate its recovery rate by evaluating physical, chemical and biological changes (Toldo and Auyp Zouain 2009).
Since the present thesis is devoted to air pollution monitoring it is worthwhile to raise an issue of data comparability for industrial emissions. Saarinen (2003) reviews methods of accounting for total emissions and issues of its temporal and spatial coverage. Saarinen (2003) points out that the practical value of emission data depends on its representativeness of the true emissions and comparability. However data from different regions or plants are not comparable due to differences in the underlying monitoring methods (Saarinen 2003).
Ahammed and Nixon (2006) review the role of monitoring with the environmental impact assessment (EIA). They examine principles of monitoring and auditing in EIA, its effectiveness, weak areas and provisions used in Australia. The results reveal that the majority of South Australian projects studied do not meet the recommendations outlined by Beanlands and Duinker (1984). There are several reasons said to cause nonconformity: 1) a lack of monitoring legislation and efficiency with clear aims and objectives for monitoring and 2) shortage of human resources in government agencies (Ahammed and Nixon 2006).
2.3 Web GIS
GIS and the Internet have become two key information technologies for managers to interact with environmental data (Dragicevic et al. 2000). GISystems are illuminated by the capability to integrate geospatial data from various resources and thereby allow different kinds of spatial analysis operations (Kraak 2004). Due to its openness and interactivity, the World Wide Web (WWW) has developed into suitable environment for communication and consequently an appropriate platform and interface for spatial data exchange (Dragicevic et al. 2000). Authorities and environmental managers that utilized GIS to monitor the environment saw opportunities to use the Web to enhance working processes and facilitate services to the public. Web GIS plays an important role in environmental monitoring and public administration since it provides GIS functionality via the Web. A mapping component is an essential attribute of most Web GIS applications that facilitates issues and perceptions in space (Kraak 2004). The next section outlines the latest relevant developments in Web GIS for environmental monitoring.
Kulawiak et al. (2010) implement a Web GIS for en existing oil spill monitoring and forecasting service. They integrated marine pollution monitoring and a forecasting system enhances contamination awareness and monitoring. Various mapping technologies have been used to implement the prototype. Authors compare open source and proprietary technologies for Web GIS development. ArcIMS, GeoServer and OpenLayers were tested on layer rendering, amount of time spent on development, as well flexibility, advanced functionality and creation easiness (Kulawiak et al. 2010). To test the capabilities of visualisation and mapping two oil spread events were used as input.
Ortolani et al. (2010) propose a Web GIS for water quality monitoring. The system is to manage various environmental scenarios by means of in-situ sensors connected via an intelligent Web-based network infrastructure. The system relied on a service-oriented architecture that provides interoperability. The research showed the importance of Web services in heterogeneous data discovery and access as well as data aggregation from various sources into spatial layers for different purposes.
Mari et al. (2011) developed GIS-based decision support system for final location selection for the construction of wind farms. An integrated GIS-based system is designed to help public operators in finding suitable locations for wind farm construction. The system is easily accessible on the Web and is developed using open source tools MapServer and PHP/MapScript. The prototype is developed in the region of Tuscany, Italy.
3. ARCHITECTURE
3.1 Interoperability in GIS
Systems interoperability has been one of the most significant issues in geospatial world. Anderson and Moreno-Sanches (2003, p. 449) define interoperability as the ability of the diverse systems to provide “information portability and inter-application process control”. Due to development of information technologies, GIS is now able to make its concepts more open and accessible to everyone thereby promoting ideas such as democratisation of spatial data, specifically open accessibility and effective distribution.
3.1.1 Service-Oriented Architecture
Attempts to disseminate GIS capabilities have concerned GIS community over the past several years (Tait 2005) and resulted in a new form of technologies to distribute GIS capabilities using Internet. Tait (2005) claims that distributed GIS is a technology that is built and deployed using standards and software of the Internet. The proposed solution is a development of a system composed of components or services as they are called in SOA. High et al. (2005) see SOA as a key technology to overcome software systems complexity and facilitate flexibility. Taking into account that the software industry has moved towards service-oriented architecture (Díaz 2012), SOA-oriented systems facilitate dissemination and use of environmental data sets offered by the EEA. In the proposed system some services act as servers for other services while others act as clients that is a distinctive feature of SOA (Bejar et al. 2009)
and processing (Granell et al. 2009). A software client that consumes or accesses Web services can display, query and analyze spatial data. This enables the ability of software components to interact with minimal knowledge of the underlying structure thus promoting the core principle of interoperability (Bejar et al. 2009). Friis-Christensen et al. (2007) argue that SOA is an open and interoperable environment that is based on reusability and standardized components.
There is an immutable advantage from exploitation of SOA-oriented systems – once the environmental geospatial data are updated on the server, client applications can immediately access and process up-to-date information.
3.1.2 Spatial Data Infrastructure
With a short history of 10 years, Web-based GIS emerged and evolved into Internet distributed geospatial services that are able to interact with various heterogeneous systems and servers offering additional geospatial functions. Web-based applications with geospatial functionalities have enriched GIS in the following domains: spatial data access and dissemination, spatial data access, exploration and visualization, and spatial data processing and modeling (Dragicevic 2004). The Web-based GIS application is a solution suggested for interactive decision-making allowing better understanding of environmental processes and more effective monitoring and management.
3.1.3 Open Geospatial Consortium
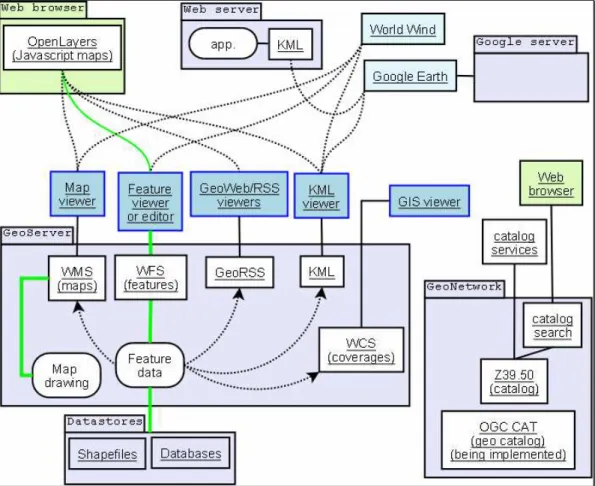
rules for implementing protocol interfaces to enable interoperability of systems (Sanchez et al. 2007). The systems communication schema is outlined on the Figure 4.
Figure 4. Relationship between clients/servers and some OGC protocols (source http://en.wikipedia.org/wiki/Open_Geospatial_Consortium, 2011)
3.1.2 Standard-based Services
serve a variety of needs (Fu and Sun 2011). These services are used as building blocks in service-oriented architecture (Fu and Sun 2011).
Exploitation of Web services is the future of Web mapping. They provide access to remote data and share them (Mitchell 2005). The OGC specification defines WMS as the international standard to produce maps of spatially referenced data dynamically from geographic information. A Web map is not the data per se but is rendered in a graphic format such as JPEG, PNG or GIF or as a vector-based graphical element in Scalable Vector Graphics (SVG) or Web Computer Graphic Metafile (OGC WMS Implementation Specification 2006).
The WMS supports the following HTTP requests (Westra 2010):
• getCapabilities that returns an XML document describing operations available, a
list of the available map layers, coordinates system used, and a list of visual styles among others.
• getMap generates and returns an actual map image based on the parameters
requested. This includes a list of the layers to be included in the map, a list of styles to apply to the map, the bounding box defining the area covered by a particular map and the image format.
• getFeatureInfo returns detailed information about the feature at a particular
position within a rendered image.
3.1.3 INSPIRE
activities that may have an effect on the environment (http://inspire.jrc.ec.europa.eu/index.cfm).
The directive envisages establishment coordination between the users and providers of information so that information from various sectors can be compared (http://inspire.jrc.ec.europa.eu/index.cfm).
There are numerous problems regarding the availability, quality, organization,
accessibility and sharing of spatial information
(http://inspire.jrc.ec.europa.eu/index.cfm). Consequently, there is a need for measures of exchange, sharing, access and use of interoperable spatial data and spatial data services across the various levels of public authority and different sectors (http://inspire.jrc.ec.europa.eu/index.cfm). The infrastructure is expected to assist policy-making in activities and policies that directly or indirectly affect the environment.
3.2 Web GIS
GISystems are now widely accepted and exploited as powerful tools for storing, manipulating, visualizing and analyzing geospatial data (Dragicevic 2004). Due to evolved Internet technologies GIS has been able to make its concept and functionalities accessible and mobile for everyone introducing such terms as democratisation of spatial data, open accessibility and effective distribution (Dragicevic 2004).
It is important to note that Web GIS is an interdisciplinary subject and consequently its development relies on several knowledge domains such as GISystems and GIScience, together with geography, cartography, computer science, participatory research and spatial decision-making (Dragicevic 2004).
support and advanced cartographic and geo-visualisation tools. Eventually Internet-based GIS evolved into Internet distributed Geospatial Services that are able to communicate with multiples systems and servers that provide more complex GIS functionality (Dragicevic 2004).
3.2.1 Components of Web GIS
The best representation of a GIS approach to SOA-based application is an SDI model, a multi-component framework that consists of a service provider and consumer (Aalst et al. 2007). SDI is developed to enable users to discover, explore and exploit datasets based on needs of their applications. SDI’s interoperability is achieved by breaking application functionality into modular and flexible Web services (Bejar et al. 2009). These services can be published, discovered, integrated, reused and invoked independently of a technology used (Granell et al. 2009). Moreover, they can be bound to create more sophisticated services.
Figure 5. Application architecture
3.2.1.1 Presentation tier
The presentation tier is at the topmost level of the application and provides the application user interface. It accepts user inputs and displays results of user queries. This tier is usually represented by a Web browser or mobile application.
The user interface is composed of widgets, various controls such as text box, buttons, drop-down lists and a “slippy” map that is embedded in the application and provides geovisualization of spatially-referenced data set. This tier communicates with other tiers and retrieves the result for clients.
3.2.1.2 Service tier
connects to the database tier, retrieves and processes information then sends it back to presentation tier. This tier is where business logic resides. The service tier is responsible for communication between presentation and database tiers. It is also represented by a GIS Web Server that is designed for interoperability and allows for sharing and editing of geospatial data (http://geoserver.org). Availability of the environmental data set is one of the objectives of the present research. Thus various Web clients will be able to access project data and use it for their purposes. A GIS Web server provides distributed geospatial access and visualisation by producing data layers in various widely accepted formats.
3.2.1.3 Database tier
According to Fu and Sun (2011) the GIS database is the data storage for a GIS that can hold a collection of geographic datasets of types, namely basic vector data and raster data. The robust GIS database is essential for GIS application. The application’s output quality and credibility is a direct ratio of the information stored in the GIS database. Fun and Sun (2011) argue that a strong GIS database comprise following competence:
• Stores a rich range of spatial data
• Support sophisticated rules and relationship to the data
• Define geospatial relational models
• Maintains integrity of spatial data
• Provides a means for data security, backup and recovery.
access components to facilitate resource sharing without encumbering client to install DBMS libraries and drivers (http://alitarhini.wordpress.com).
The proposed architecture complies with INSPIRE, Infrastructure Spatial Information in the European Community directive, to envisages establishment coordination between the users and providers of information so that information from various sectors can be compared (http://inspire.jrc.ec.europa.eu/index.cfm).
4. TECHNOLOGIES AND METHODS
4.1 Web technologies
Web application development comprises technologies for Web server and the Web client and their interactions (Fu and Sun 2011). Server-side technologies include: 1) Web application servers that host the Web sites, accept HTTP requests from clients and serve HTTP responses and 2) server-side programming languages that are executed on the Web server (Fu and Sun 2011). Client-side technologies include applications that run inside a Web client, usually a browser or a mobile device.
4.1.1 AJAX
Rich Internet Application (RIA) performance comes from Asynchronous JavaScript and XML (AJAX) technology, which uses client-side scripting to make Web applications more responsive (Deitel and Deitel 2008). AJAX applications separate client-side user interaction and server communication, and run them in parallel, reducing the delays of server-side processing normally experienced by the user (Deitel and Deitel 2008). Asynchronous calls are a core principle of AJAX providing an application with the following benefits (http://code.google.com/webtoolkit):
• The user interface remains responsive.
• Other processes can be performed while waiting on a pending server call.
• Multiple server calls at the same time are supported.
4.1.2 Google Web Toolkit
widgets, development tools and programming utilities to facilitate Web-based application development. The distinctive feature between GWT and other frameworks is that client-side code is written in Java instead of JavaScript (Hanson and Tracy 2007). The use of Java as a programming language provides access to a collection of available Java development tools. The idea to use Java instead of JavaScript was induced by increasing size and complexity of Internet applications since was designed to ease large application management (Hanson and Tracy 2007).
There is the Java-to-JavaScript compiler at the core of GWT that makes code that can be run on Internet Explorer, Mozilla, Firefox and Opera (Hanson and Tracy 2007). And at the same time any Java library can be used on the server-side. Apart from compiler GWT contains a large library of widgets and panel to build desktop-look-like applications. There is a wide range of widgets available including text box, radio button, drop-down menu, dialog boxes etc (Hanson and Tracy 2007).
Since in the present research the major part of the application code resides on the server-side, the application needs a way to communicate with a server. GWT offers Remote Procedure Call mechanism to pass to and from the server over standard HTTP. GWT RPC calls to the server are asynchronous meaning they do not block while waiting for the call to return. Thus the code following the call executes immediately (http://code.google.com/webtoolkit).
Figure 6. GWT project in Eclipse IDE
4.1.3 OpenLayers
OpenLayers is an open source client side JavaScript library for making interactive Web maps that can be viewed in a Web browser (Hazard 2011). It supplies a Web application with “where” component. The library allows building an entire mapping application from the ground up. OpenLayers – the map client of the present application that communicates with Web map server GeoServer to retrieve images of map background. OpenStreetMap (OSM) is a server backend that provides a base map. OpenLayers consumes data from OSM. OpenLayers is not a map server but consumes map images from them (Hazzard 2011). The base map for this project is provided by OpenStreetMap.
4.2 Geospatial Services Standards Implementation
Web GIS is a multi-disciplinary subject and consequently its development relies on several knowledge domains such as GISystems and GIScience, together with geography, cartography, computer science, participatory research and spatial decision-making (Dragicevic 2004). Web GIS broadens a Web application by adding GIS components, such as GIS Web server and GIS database (Fu and Sun 2012).
Geospatial Web Services is an important way to achieve interoperability. Web services for mapping are the future of Web mapping and provide with accessing remote data and sharing them (Mitchell 2005). OGC Specification defines WMS as the international standard to produce maps of spatially referenced data dynamically from geographic information. For the present project GeoServer is used to create maps out of the dataset by implementing OGC WMS and WFS standards.
4.2.1 GeoServer
GeoServer makes the project’s geospatial data set interoperable, i.e. available through the Internet. Geoserver is an open source Java-based software server that provides that allows sharing and editing geospatial data. It has been designed for interoperability; hence using open standards it can publish geospatial data from any major source (http://geoserver.org/). GeoServer is developed, tested and supported by a varied organizations and individuals from all over the world (http://geoserver.org/).
Figure 7. GeoServer interface
(source http://geoinfo.dlsi.uji.es:8080/geoserver/web/, 2011)
GeoServer allows displaying spatial information. It implements two important OGS standards – WMS and WFS. For compliance with WMS standard, GeoServer creates maps in a wide range of accepted formats having a free mapping library OpenLayers that makes map generation easy and quick. Moreover, GeoServer also supports WFS standard that permits actual sharing and editing the geospatial data. GeoServer is a reasonable of example of operability and plays an important role in the current project.
4.3 Spatial Database
• Store spatial data types, such as point, lines and polygons directly in the database.
• Perform spatial queries on the data.
• Perform spatial joins on the data.
• Create new spatial objects.
Spatially-enabled database is a powerful tool for geospatial data manipulation. Using optimizations such as spatial indexes, spatial databases can to quickly perform above-mentioned operations (Westra 2010).
4.3.1 PostgreSQL and PostGIS
There are several open-source spatially-enabled databases, however for development of the prototype in the current project PostgreSQL is chosen to store spatial data set. PostgreSQL is an open-source relational database management system available for various platforms such as Linux, Solaris, Windows and Mac OS X. The first release of PostreSQL was in 1996, so the database system has been developed for 16 years.
topology support, data validation, coordinate transformation and programming APIs (http://postgis.refractions.net/).
4.4 Pollutant Emissions Distribution Simulation
Longley et al (2011) argue that spatial analysis can be considered as the most essential domain of GIS because it involves transformations, manipulations and methods to geographic data to reveal patterns and anomalies that are not immediately obvious (Longley et al. 2011). Analyses methods are divided into those which are based on distance, such as cluster detection, density estimation and spatial interpolation, and based on location, for instance spatial joins, overlays, raster analysis (Longley et al. 2011).
4.4.1 Inverse Distance Weighted Interpolation
Spatial analysis is a significant part of GIS ( Raju n.d.). It illuminates underlying trends in the spatial data producing new information. There are various spatial interpolation methods available. The methods are classified into statistical, for instance Inverse Distance Weighting (IDW) and geostatistical, such as kriging. These methods take into account Tobler’s First Law, which assumes that “the value at a location is more similar to the values measured at nearby sample points than to the values at distant sample points” (Longley et al. 2011, p. 374).
sophisticated math taking and measures distance between all possible pairs of sample points to define the spatial autocorrelation.
In the present research IDW, a spatial interpolation technique, is exploited to simulate distribution of pollutants in the atmosphere. IDW is one of the most commonly used techniques for interpolation of scatter points and is based on the assumption that the interpolating surface is influenced most by the nearby points and less by the more distant points. IDW is considered a workhorse of spatial interpolation (Longley et al. 2011) while the kriging method is the most convincing in terms of theoretical principles. However, due to limited time resources for the project realization IDW is chosen as a spatial analysis technique due to (i) its relative simplicity of guessing the values at location where no measurement is available and (ii) geostatistical analysis is of a secondary interest of the present research.
IWD estimates unknown values as weighted averages over the known measurements at surrounding points, so closest point affect more than those located farther (Longley et al. 2011). The equation of IDW is used as follows (http://ems-i.com 2011):
where n is the number of scattered points in the set, fi are data set values, and wi are the
weight functions assigned to each scatter point and looks as follows:
5. IMPLEMENTATION
5.1 Data Model
Since the E-PRTR database is available in Microsoft Access format, the database that adds supports for geographical objects is proposed for design. By posting a database on a server it becomes globally available through the Internet. An Internet-available spatial database is an important step towards interoperability. Then using OGC elaborated standards and specification and by means of GeoServer the database gets shared over the Internet in the OpenLayers format by implementing WMS and WFS standards. Afterwards a light client application, a presentation tier consumes geospatial services, accesses, manipulates and visualizes geospatial data. There were inconsistencies in the initial E-PRTR MS Access database. Consequently, preparing the spatial database involved the following stages: 1) export data sets of interest from Ms Access into comma-delimited files, 2) format and clean the spatial and temporal data, 3) import data into PostgreSQL format, 4) add the spatial component – a point geometry column for every industry based on the geographic coordinates, 5) publish geospatial data in the database and as a standard-based services (WMS and WFS).
Figure 8. Data Model Design
Figure 9. Populating the database
The Industry table is a spatial layers layer that contains 1171 records located in the
Valencian Community of Spain. This table comprises the information about the geographical location of an enterprise, its full address, longitude and latitude coordinates and the feature’s geometry type. The point geometry type is used for enterprises. The table Pollutant contains all hazardous pollutants that have been emitted
by the mentioned industries. Every pollutant record has an associated code, name and pollutant group. The table Emission contains the amount of a pollutant emitted for every
5.2 Geospatial Service Implementation and Deployment
The base map is provided by the OpenLayers library. OpenLayers asynchronously makes the call to GeoServer and sends requests to a map server for map images every time a user interacts with the map then combines map tiles to provide a seamless map (Hazzard 2011).
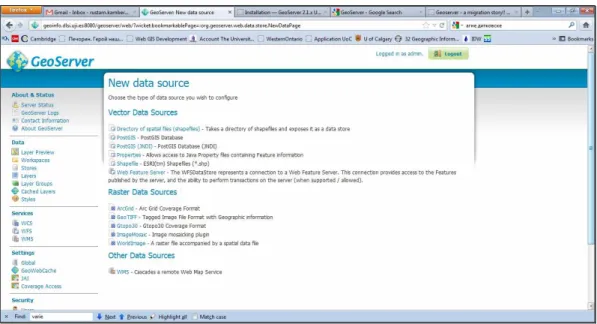
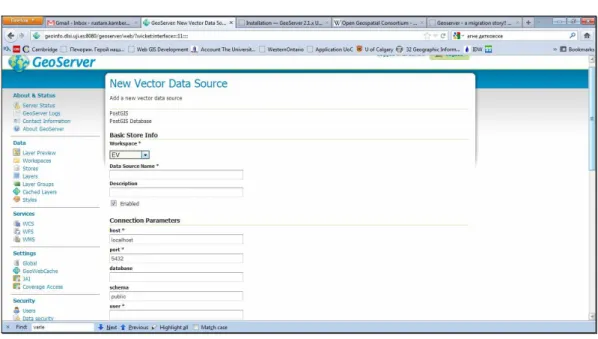
The project data are added to GeoServer by creating a new data source in the PostGIS format (Figure 11). Afterwards it needs to create a new resource by specifying a database table. The following parameters were chosen to add data to GeoServer:
1. Localhost with the port number of 5432 because the database and the GeoServer
reside on the same Web server.
2. Spatial Referencing System code of 4326 is determined.
Figure 11. GeoServer interface (source http://geoinfo.dlsi.uji.es:8080/geoserver/web/, 2011)
5.3 Application Logic
client and the server. The communication with the spatial database is implemented on the server side as well as spatial analysis. The server side classes provide means for database connection, data retrieval and their transmission to the client. Spatial analysis logic also resides on the server side. The client classes are responsible for visualisation of the retrieved data. Communication between the client and the server are organized by means of HTTP requests across the network.
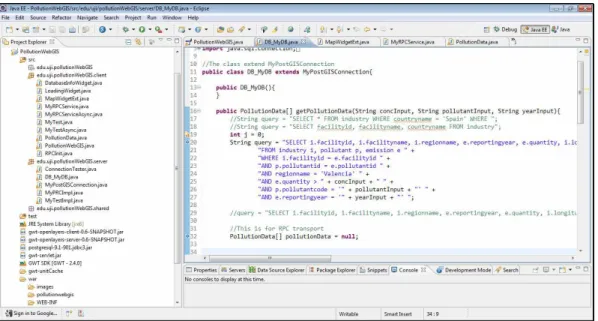
For the present project GWT Remote Procedure Call is chosen as a client-server interaction mechanism which is based on Java Servlet technology. GWT RPC is a tool that transfers Java objects between the browser and server with no need for translation into an intermediate format (Hanson and Tracy 2007). To connect to the database the JDBC API is used. To provide communication between client, server and the database a remote service was created that runs on the server, and is invoked by the client. The classes PollutionData and SurfaceData are serializable, so their objects are passed from the server to the client.. There were three important steps to implement client-server/database interaction (Figure 12):
1. MyRPCService interface was defined for the service that extends RemoteService and has the methods getPollutionData and getSurfaceData of there arguments.
2. The MyPRCImpl class that extends RemoteServiceServlet and implements this service was created. There are two methods in this class getPollutionData and getSurfaceData, and they return objects of serializable classes that can be send t the client for the following visualization.
Figure 12. GWT RPC mechanism
5.4 IDW Model
unit, a polygon feature, is filled with a value of pollutant concentration. The equal intervals classification method is applied to associate a particular colour with a value.
6. USE CASE: Industrial emissions in Valencian Community
6.1 Study Area Description (The Valencian Community)
The study area, the Valencian Community is an autonomous community of Spain located in the south-eastern part of the Iberian Peninsula (Figure 13). Its capital and largest city is Valencia. The region is divided into three provinces: Alicante, Castellón and Valencia. The Community is lack of energy resources that results in its dependence on other regions: only some 5% of the energy consumed comes from the Valencian territory (http://www.grec.cat/).
The major industries in the Valencian Community are chemical, textile, ceramic and paper. The industrial sector has a significant contribution to the community’s GDP. The export of various products to the other parts of the world enables the city to garner lots of foreign exchange aiding in the development of the economy.
Figure 13. Study area
The Valencian Community’s industry is represented by some big companies share the market with a great quantity of small and middle-sized businesses belonging to those known as traditional sectors, supporting an intensive labour force (http://www.hellovalencia.galeon.com). The influence of these main businesses in the industrial development has been indirect according to a training and demand of skilled labour force and to a major requirement of the quality of the providers (http://www.hellovalencia.galeon.com). The region is represented by a wide range of industries that might result in a significant amount of hazardous pollutant emissions.
6.2 System’s Prototype
The system’s prototype is developed for the Valencian Community. The environmental data available for the prototype are constrained by the area of interest. However, the database contains data about all European Union Member States and can be used for the whole area in the future projects. The Use Case Diagram depicts how the user is expected to interact with the system (Figure 14). There are five main use case defined in the project.
Figure 14. The Use Case Diagram
The application window consists of an embedded map component and various widgets to provide a user interface. There are navigation tools located in the upper left-hand section of the map allowing navigate the map and zooming into geographic regions. Since the regions of interest if the Valencian Community the default map extent covers the Valencian Community (Figure 15).
It is essential for mapping applications to provide a user with navigation tools. The present application allows the user to move the map using drag-and-drop action. Panning arrows move the map in a needed direction as well. There are several option of changing the map zoom: (i) by clicking on the + or – buttons, (ii)double clicking on the map, (iii) by clicking on the magnifier button and drawing an imagery rectangle that zooms in, and (iv) moving mouse scrolling wheel.
The layer toggle is located on the upper right-hand side. The toggle allows choosing the map background between OSM and Google Maps. The project data set can be added as a separate layer the project data in the form of WMS or WFS. After the data set is displayed a user can get information on every point feature. It provides all corresponding information related to the selected point feature (Figure 14).
The layer toggle located in the upper right corner of the map allows user switching map layers on and off, including overlay layers, those are created “on the fly” by querying the database. Clicking a appoint feature fires a pop-up window with information about an industry code in the database, company name, reporting year and the quantity of emissions (Figure 16).
6.2.1 Air Pollution Monitoring
The system allows the search of industries to be performed based on a number of search criteria and makes a spatial layer out of it. This is achieved through a text box and drop-down menus located in the top left hand side of the application window. A user specifies following search criteria:
1. Quantity of emissions 2. Pollutant
3. Reporting year.
The user inputs the emission quantity in a drop-down box, specifies a pollutant and a reporting year from drop-down menus (Figure 17).
If there are industries that conform the query the corresponding industries are added as a new layer in upper left-hand side of the application window and displayed on the map as point features (Figure 18). The tabulated result of the point selection by spatial query is also returned and resides on left hand side of the working environment.
Figure 18. Query Result
6.2.2 IDW Interpolation
7. CONCLUSIONS
In the present work the development of a Web GIS application is described which facilitates monitoring of industrial emissions. It is a dynamic and interactive application that can be freely accessed on the Web. The client and server side are both implemented in Java within Google Web Toolkit for browser-based application development. GeoServer is used a free Web map server that provides interoperability and PostGIS is a spatial database residing on a Web server as well. The system interface is supplied with navigation panel, layer toggle and various forms to specify query parameters. Distinctive feature of the application is that GWT is used together with OpenLayers, as well as PostGIS DBMS. It is built completely based on open source tools and libraries implying openness and extendibility.
The system provides various communities of organizations to consume environmental data and GIS functionalities on the Internet. It can be used to support a preliminary step of a new industry possible location. The emission distribution surface layer may discern help discern susceptible municipality areas and physician can research whether respiratory diseases are attributed to the presence of a particular industrial pollutant in the atmosphere.
The application enables broad groups of users to easily access hazardous pollution information through the Internet. The contribution of the present project is to enhance public awareness about air condition and likely sources of industrial contamination. Users can access the application and check out which industrial facilities are located in the proximity of their residential area and the amount of pollutants is emitted into the atmosphere in a certain year.
The developed spatial database is provided with distributed geospatial access by implementing OGC-standardized standards. The system’s prototype successfully manipulates and allows for database querying. The prototype distributes environmental data and GIS functions to various communities and organizations.
Results of this work may be used to support preliminary steps for site selection analysis of new potential industry locations. Using distribution of emissions using IDW method will reveal vulnerable municipal areas. For example, health professionals can use this data to research if there is a correlation between respiratory disease cases and the presence of a particular industrial pollutant.
In summary although the prototype needs some finalization steps there are no impediments that could bar its further development to better pollutant release awareness and monitoring tool.
Bibliographic References
Ahammed A. K. M. R and B. M. Nixon. 2006. Environmental impact monitoring in the EIA process of South Australia. Environmental Impact Assessment Review 26: 426-447.
Aalst, W.M.P. van der, Beisiegel, M., Hee, K.M. van der, Konig, D., Christian Stahl, C. 2007. An SOA-based architecture framework. International Journal of Business
Process Integration and Management 2 (2) 91-101.
Anderson G., R. Moreno-Sanchez. 2003. Building Web-based Spatial Information Solutions around Open Specifications and Open Source Software. Transactions in GIS
7(4): 447-466.
Auer T., A. M. MacEachren, C. McCabe, S. Pezanowski, M. Stryker. 2011.
HerbariaViz: A Web-based client-server interface for mapping and exploring flora observation data. Ecological Informatics 6: 93-110.
Ballester F., D. Corella, S. Perez-Hoyos, A. Hervas. 1996. Air pollution and mortality in Valencia, Spain: a study using the APHEA methodology. Journal of Epidemiology and
Community Health 50: 527-533.
Beanlands G. E. and P. N. Duinker. 1984. An ecological framework for environmental
Béjar, R., Latre, M. Á., Nogueras-Iso, J., Muro-Medrano, P. R., Zarazaga-Soria, F. J. (2009). An architectural style for Spatial Data Infrastructures. International Journal of Geographical Information Science 23(3): 271-294.
Chappel D. A., and T. Jewell. 2002. Java Web Services. O’Reilly & Associates.
Darbra R.M. , N. Pittam, K.A. Royston, J.P. Darbra, H. Journee. 2009. Survey on environmental monitoring requirements of European ports. Journal of Environmental
Management 90: 1396-1403.
Deitel P., H. Deitel. Java How to Program. Person Education, New Jersey, 2010.
Díaz D., M. Núñez-Redó, D. González, J. Gil, P. Aragó, E. Pultar, J. Huerta. 2012. Alternative search mechanism for Web 2.0 resources. Article under Review for the International Journal of Spatial Data Infrastructures Research.
Dragicevic S., S. Balram, J. Lewis. 2000. The role of Web GIS tools in the
environmental modeling and decision-making process. 4th International Conference on Integrating GIS and Environmental Modelling: Problems, Prospects and Research
Needs. Banff, Alberta, Canada, September 2-8.
Dragicevic, S. 2004. The potential of Web-based GIS. Journal of Geographical Systems
6: 79-81.
INSPIRE Directive. 2007. European Commission.
http://inspire.jrc.ec.europa.eu/index.cfm (accessed November 06, 2011)
Fu P., J. Sun. 2011. Web GIS: Principles and Applications. Redlands: ESRI Press.
GeoServer. http://geoserver.org/display/GEOS/Welcome (accessed November 03,
2011)
Granell C., L. Diaz and M. Gould. 2009. Distributed Geospatial Processing Services.
Encyclopedia of Information Science and Technology: 1186-1193.
Hanson R., and A. Tracy. 2007. GWT in Action. Greenwich: Manning Publications Co.
Henri J. G. L. Aalders, Harold Moellering. N.d. Spatial Data Infrastructure.
High R. Jr. , S. Kinder, S. Graham.2005. IBM’s SOA Foundation - An Architectural Introduction and Overview. Version 1.0. IBM.
Ilyushchenko M., R. Kamberov. 2004. Mercury pollution at Pavlodar. hg-pavlodar.narod.ru (accessed December 28, 2011).
Kraak M.-J. 2004. The role of the map in a Web-GIS environment. Journal of
Mari R., L. Bottai, C. Busillo, F. Calastrini, B. Gozzini. 2011. A GIS-based interactive Web decision support system for planning wind farms in Tuscany (Italy). Renewable Energy 36: 754-763.
Michaelis C. D. and D. P. Ames. 2009. Evaluation and Implementation of the OGC
Web Processing Service for Use in Client-Side GIS. Geoinformatica 13: 109-120.
Mitchell T. 2005. Web mapping. Sebastopol: O’Reilly Media.
Open Geospatial Consortium. About OGC. http://www.opengeospatial.org/ogc
(accessed November 09, 2012)
Open Geospatial Consortium. 2006. OpenGIS® Web Map Server Implementation Specification. 2006.
Open Geospatial Consortium. 2007. OpenGIS® Web Processing Service. 2007.
Paul A. Longley and Michael F. Goodchild and David J. Maguire and David W. Rhind.
2011. Geographic Information Systems and Science. New Jersey: John Wiley & Sons
Paul J. Deitel (Author), Harvey M. Deitel. 2008. AJAX, Rich Internet Applications, and Web Development for Programmers. Boston.: Pearson Education, Inc
Pender T. A. 2002. UML Weekend Crash Course. New York: Wiley Publishing, Inc.
PostGIS. What is PostGIS? http://postgis.refractions.net (accessed November 01, 2011)
Raju P.L.N. n.d. Spatial Data Analysis. World AgroMeteorological Information Service.
http://www.wamis.org (accessed December 22).
Renner S. A. 2001. A “Community of Interest” Approach to Data Interoperability.
Federal Database Colloquium.
Saarinen K. 2003. Monitoring total emissions from industrial installations.
Environmental science & Policy 6: 367-376.
Sanchez M. R, Anderson G,. 2003. Building Web-Based Spatial Information Solutions around Open Specifications and Open Source Software, Transactions in GIS, John
Wiley & Sons, Inc 7( 4), pp 447-449.
Slanina J. 2004. Air Pollution from Energy Production and Use. Encyclopedia of
Energy, Volume 1. Elsevier Inc.
Toldo E. E. and R. N. Auyp Zouain. 2009. Environmental monitoring of offshore
drilling for petroleum exploration: A brief overview. Deep-Sea Research II 56: 1-3.
Westra E. 2010. Python Geospatial Development. Birmingham, UK: Packt Publishing
Ltd. 487
Google Web Toolkit. 2011. http://code.google.com/webtoolkit (accessed October 22, 2011).
Central Pollution Control Board. http://cpcb.nic.in/ (accessed January 10, 2012)