Evaluation of polymorphism in ten microsatellite loci in Uruguayan sheep
flocks
Ivanna Tomasco, G. Wlasiuk and E.P. Lessa
Laboratorio de Evolución, Facultad de Ciencias, Universidad de la República, Montevideo, Uruguay.
Abstract
The allele frequencies of 10 microsatellite loci previously described for sheep as BM1314, BM6526, OarFCB128, OarHH64, OarCP20, OarHH47, OarFCB48, OarHH35, OarHH72 and BM2508 were estimated for the Uruguayan flocks. A representative sample of 101 individuals composed by the two predominant breeds (76% Corriedale and 24% Australian Merino) was used. The sample did not show a significant tendency towards substructuring, in spite of presenting some significantly different allele frequencies between races. The Corriedale sample presents three loci in which the presence of null alleles is possible. The markers were highly variable, showing between 7 and 15 alleles each. The Polymorphism Information Content Index ranged from 0.63 to 0.87 and the Exclusion Probability from 0.39 to 0.75 for a cumulative Exclusion Probability of 99.98%. These results suggest the effectiveness of this set of loci for testing genetic relatedness. This is the first report of microsatellite variation in Corriedale.
Key words: sheep, polymorphism, microsatellites.
Received: March 14, 2002; accepted: March 25, 2002.
Introduction
For every program of breeding and selection, it is de-sirable to rely on a precise assessment of parentage to assist, for example, in the elimination of undesirable recessive alleles, in early selection for future breeding, or to ensure accurate pedigrees and registration. Microsatellites, seg-ments of the nuclear genome composed of tandem repeat of short-sequence motifs, have become excellent candidate markers for this kind of studies (Quelleret al., 1993), since they are numerous, highly variable and easy to score.
A large number of highly polymorphic microsate-llites have been characterized and mapped in domestic ani-mals, including sheep, cattle and other ruminants (de Gortariet al., 1997, 1998; Hayeset al., 1996; Jenkingset al., 1997), facilitating the use of these markers in parentage testing. For this kind of test to be acceptable, it must pro-vide a high degree of certainty in the assignment of parent-age, which can be evaluated with the Exclusion Probability (Weir, 1996). This requires a previous knowledge of allele frequencies in the population of interest and certainty about the assumptions of the model, like independence of the markers utilized and Hardy-Weinberg equilibrium.
The goals of this study were to analyze the polymor-phism of a set of microsatellites previously described as
polymorphic in sheep and to evaluate their usefulness for relatedness testing in Uruguayan sheep flocks.
Material and Methods
We analyzed ten microsatellite loci in a sample of the Uruguayan flocks considering only pure-breed individuals. The analysis were carried out separately for two subsam-ples: one of 77 Corriedale individuals from a fair, and an-other of 24 Australian Merinos from an experimental field (all of them are expected to be unrelated ewes), as well as on the combined dataset. Corriedale, the predominant race in the country, has not been previously characterized using microsatellite markers.
Total DNA extractions were made with SDS/protei-nase K/NaCl/alcohol precipitation (modified from Milleret al., 1988) from skin preserved in 95% ethyl-alcohol. The microsatellite loci OarHH35, OarHH64, OarHH47 (Henry
et al., 1993), OarVH72 (Piersonet al., 1993), OarFCB128 (Buchanan and Crawford 1993), OarFCB48 (Buchananet al., 1994), OarCP20, BM1314, BM6526, (Crawfordet al., 1995), and BM2508 (Mulsantet al., 1998) were amplified by PCR (Polymerase Chain Reaction) for all animals; ex-cluding OarHH35 and OarHH64 all of them map on dif-ferent chromosomes. Amplification was carried out in a total volume of 12.5µL containing the following
constitu-ents: 6.25µL of DNA (0.4µg/mL) used as a template, 1X
Taq Polymerase Buffer, 240µM of each dNTP, 240 nM of
www.sbg.org.br
each primer, 0.5 units of Taq Polymerase and variable con-centration of MgCl2depending on the locus (from 1.5 to
3.0 mM). PCR amplifications were performed in a Rapid-cyclerTM(Idaho Technology) by an initial denaturation of 3 min at 94 °C, followed by 35 cycles of 45 s of denatur-ation at 94 °C, 45 s of annealing at 50 °C and 45 s of exten-sion at 72 °C, and a final extenexten-sion of 7 min at 72 °C.
The amplified products were electrophoresed in 7%, 0.80 mm thick denaturing polyacrylamide gels (1000-1200 V, 1-2 h), and the DNA bands were visualized by sil-ver staining (Sanguinetti et al., 1994). Genotypes were scored by at least two persons independently and the abso-lute sizes of the alleles were determined in relation to a 10bp DNA size standard (GIBCO BRL).
On the basis of allele and genotype frequencies, Har-dy-Weinberg equilibrium and linkage disequilibrium were tested using the softwareGenePop, version 3.1b (Raymond and Rousset, 1995). A Bonferroni correction was used to adjust significance levels in all tests to an overallα= 0.05.
Observed heterozygosity (Hobs), Polymorphism
Informa-tion Content (PIC, Botstein et al., 1980) and Exclusion Probability assuming that the genotype of the lamb and one of its parents is known (Q, according to Weir, 1996) were calculated.
The softwareStructure (Pritchardet al., 2000) was used in order to assess levels of subdivision between two races (10,000 Burn-in period, 10,000 MCMC repetitions, and default parameters).
Results
Allele length in base pairs, allele frequencies, Hobs,
PIC, Q and the number of individuals analyzed per locus are given in Table I. All loci were highly polymorphic, showing between 7 and 15 alleles, PICs between 0.63 and 0.87 and Hobsin the range of 0.62 to 0.84 for the whole
sam-ple. The two loci that map on the same chromosome (OarHH35 and OarHH64) did not show a significant link-age (p > 0.373, SE = 0.052).
The loci OarHH35, OarHH64 and OarFCB128 showed significant departures from Hardy-Weinberg equi-librium in the whole population and in the Corriedale sam-ple (Table II). With the exception of OarFCB128, OarVH72 and BM6526, all loci presented significant dif-ferences in allele frequencies between Merino and Corrie-dale samples. Some alleles were much more frequent in one race than in the other (e.g., allele 123 in OarHH35 and 146 in OarHH47, which are 14 and 8 times more frequent, re-spectively in Merino than in Corriedale, or allele 75 in
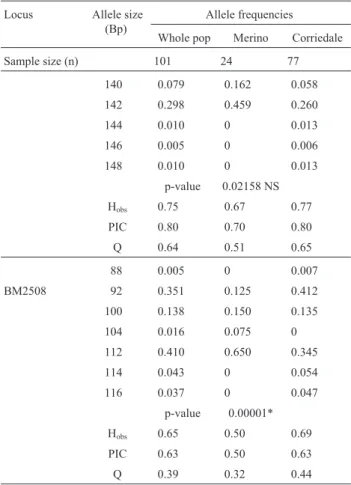
Table I- Loci, absolute allele sizes in base pairs, allele frequencies, ob-served heterozygosity (H0bs), polymorphism information content (PIC),
exclusion probability (Q) and number of individuals analyzed per locus and sample. The whole population combines all the Merinos and Corrie-dales; p-values refer to the comparison of allele frequency distributions between Merino and Corriedale samples: *and NS means significant and non-significant difference, respectively. Markers are followed by♦if their absolute allele sizes are not concordant with those reported in the lit-erature.
Locus Allele size
(Bp)
Allele frequencies
Whole pop Merino Corriedale
Sample size (n) 101 24 77
117 0.010 0 0.013
OarHH35 121 0.094 0.229 0.052
123 0.079 0.271 0.019
125 0.347 0.167 0.403
127 0.109 0.229 0.071
129 0.322 0.104 0.390
131 0.010 0 0.013
133 0.005 0 0.006
135 0.015 0 0.019
137 0.010 0 0.013
p-value 0.00001*
Hobs 0.72 0.77 0.70
PIC 0.71 0.75 0.62
Q 0.53 0.57 0.43
130 0.025 0 0.032
Table I (cont.)
Locus Allele size
(Bp)
Allele frequencies
Whole pop Merino Corriedale
Sample size (n) 101 24 77
OarHH64 132 0.060 0.043 0.065
136 0.015 0 0.019
138 0.299 0.191 0.331
140 0.055 0 0.071
142 0.109 0.277 0.058
144 0.199 0.191 0.201
146 0.239 0.298 0.221
p-value 0.00260*
Hobs 0.69 0.83 0.65
PIC 0.77 0.72 0.76
Q 0.59 0.44 0.54
126 0.020 0 0.026
OarHH47 128 0.005 0.021 0
132 0.005 0 0.007
134 0.085 0 0.112
136 0.095 0.063 0.105
138 0.055 0.104 0.039
140 0.485 0.583 0.454
142 0.110 0 0.145
144 0.025 0 0.033
Table I (cont.)
Locus Allele size
(Bp)
Allele frequencies
Whole pop Merino Corriedale
Sample size (n) 101 24 77
148 0.060 0.083 0.053
150 0.020 0.042 0.013
p-value 0.00002*
Hobs 0.66 0.54 0.70
PIC 0.72 0.60 0.72
Q 0.55 0.43 0.56
142 0.010 0 0.013
OarFCB48 144 0.120 0.261 0.078
♦ 146 0.025 0.022 0.026
148 0.370 0.217 0.416
150 0.275 0.109 0.325
152 0.015 0.043 0.006
154 0.040 0.109 0.019
156 0.070 0.152 0.045
158 0.005 0 0.006
160 0.010 0 0.013
162 0.015 0.065 0
164 0.010 0 0.013
166 0.005 0 0.006
168 0.025 0.022 0.026
170 0.005 0 0.006
p-value 0.0001*
Hobs 0.73 0.96 0.66
PIC 0.73 0.79 0.67
Q 0.55 0.67 0.46
100 0.122 0 0.149
OarFCB128 112 0.058 0.114 0.045
♦ 114 0.243 0.286 0.234
120 0.005 0.029 0
122 0.048 0 0.058
124 0.196 0.143 0.208
126 0.259 0.400 0.227
128 0.069 0.029 0.078
p-value 0.00732 NS
Hobs 0.68 0.59 0.70
PIC 0.78 0.68 0.79
Q 0.63 0.45 0.63
127 0.051 0.068 0.046
OarVH72 129 0.454 0.318 0.493
131 0.036 0.068 0.026
133 0.276 0.409 0.237
137 0.036 0 0.046
139 0.102 0.114 0.099
141 0.026 0 0.033
Table I (cont.)
Locus Allele size
(Bp)
Allele frequencies
Whole pop Merino Corriedale
Sample size (n) 101 24 77
143 0.020 0.023 0.020
p-value 0.09948 NS
Hobs 0.62 0.64 0.62
PIC 0.66 0.66 0.65
Q 0.48 0.47 0.47
71 0.005 0 0.006
OarCP20 73 0.337 0.313 0.344
75 0.119 0.021 0.149
77 0.114 0.125 0.110
79 0.129 0.104 0.136
81 0.015 0.021 0.013
83 0.238 0.271 0.227
85 0.035 0.146 0
87 0.005 0 0.006
89 0.005 0 0.006
p-value 0.00070*
Hobs 0.72 0.79 0.70
PIC 0.76 0.72 0.75
Q 0.59 0.58 0.57
140 0.213 0.159 0.321
BM1314 150 0.075 0 0.100
155 0.086 0.045 0.100
157 0.144 0.182 0.131
159 0.149 0.364 0.077
161 0.057 0.045 0.062
163 0.034 0 0.046
165 0.023 0.023 0.023
197 0.023 0 0.031
169 0.006 0 0.008
171 0.069 0.045 0.077
173 0.098 0.114 0.092
175 0.023 0.023 0.023
p-value 0.00444*
Hobs 0.84 0.77 0.86
PIC 0.87 0.76 0.81
Q 0.76 0.61 0.77
124 0.016 0.027 0.013
BM6526 126 0.026 0.054 0.019
128 0.005 0 0.006
130 0.016 0.027 0.013
132 0.068 0 0.084
134 0.204 0.162 0.214
136 0.079 0 0.097
OarCP20 which is seven times more frequent in Corriedale than in Merino). Other alleles were found only in one sam-ple, and sometimes at high frequency (e.g., alleles 134 and 142 of OarHH47 in Corriedale, and allele 85 of OarCP20 in Merino). In several cases, these frequencies differed from those reported in the literature (see Henryet al., 1993,for OarHH47, OarHH35, OarHH64; Buchanan and Crawford
1993, for OarFCB128; Edeet al., 1995, for OarCP20; and Buchananet al., 1994, for OarFCB48). There were also dif-ferences in one base pair between absolute allele sizes reported for OarFCB48 and OarFCB128 and our observa-tions but it was easy to resolve the correspondences on the basis of allele frequencies. Direct comparisons would be needed to assess the reason for this discrepancy.
Analyses of subdivision using the softwareStructure
(Pritchardet al., 2000) did not find a significant tendency towards substructuring in the sample (data not shown), in spite of the presence of two breeds.
Discussion
The loci used in the analysis are effectively independ-ent, since the only two that map on the same chromosome (OarHH35 and OarHH64) did not show significant linkage disequilibrium. The departures from Hardy-Weinberg equilibrium shown by OarHH35, OarHH64 and OarFCB128 in the Corriedale sample were probably the cause of the departure in the whole population. This could be due to the presence of null alleles in these loci in Corrie-dale or be the consequence of several years of intensive se-lection on these breeds (Ushaet al., 1995). To avoid this problem, these loci can be excluded from parentage analy-sis and the cumulative Q would vary from 99.99% to 99.77% and from 99.98% to 99.75% for the whole popula-tion and the Corriedale stock, respectively. For Merinos, the cumulative Q with ten loci was 99.93%.
In spite of the presence of several differences in allele frequencies between races, these were insufficient to result in substantial separation between these breeds. These two races are known to be related, since Corriedale was origi-nated from crosses between pure Merino and Lincoln sheep (Majala, 1997), so this result is not entirely surprising. Cou-pled with the fact that most of Uruguayan sheep are not completely pure, these observations suggest that allele
Table II- Observed p-values and standard errors (SE) of Hardy-Weinberg exact tests for heterozygote deficit.
p - value and SE
Locus Whole pop Merino Corriedale
OarHH35 0.0022* 0.0015 0.4380 0.0110 0.0011* 0.0008
OarHH64 0.0000* 0.0000 0.7105 0.0102 0.0000* 0.0000
OarHH47 0.0243 0.0091 0.0319 0.0076 0.0855 0.0180
OarFCB48 0.5571 0.0555 0.9664 0.0075 0.2182 0.0422
OarFCB128 0.0003* 0.0003 0.0478 0.0052 0.0016* 0.0010
OarVH72 0.2808 0.0219 0.3717 0.0161 0.2687 0.0212
OarCP20 0.0917 0.0177 0.5716 0.0236 0.0319 0.0111
BM1314 0.2119 0.0294 0.1718 0.0233 0.3823 0.0386
BM6526 0.0658 0.0210 0.0835 0.0115 0.1427 0.0287
BM2508 0.2454 0.0217 0.1807 - 0.6460 0.0252
*Means significant departures from equilibrium, after a Bonferroni correction (correctedα= 0.005). See text.
Table I (cont.)
Locus Allele size
(Bp)
Allele frequencies
Whole pop Merino Corriedale
Sample size (n) 101 24 77
140 0.079 0.162 0.058
142 0.298 0.459 0.260
144 0.010 0 0.013
146 0.005 0 0.006
148 0.010 0 0.013
p-value 0.02158 NS
Hobs 0.75 0.67 0.77
PIC 0.80 0.70 0.80
Q 0.64 0.51 0.65
88 0.005 0 0.007
BM2508 92 0.351 0.125 0.412
100 0.138 0.150 0.135
104 0.016 0.075 0
112 0.410 0.650 0.345
114 0.043 0 0.054
116 0.037 0 0.047
p-value 0.00001*
Hobs 0.65 0.50 0.69
PIC 0.63 0.50 0.63
frequency estimations derived from the whole sample may be sufficient for future applications in relatedness tests. Also, such tests may exclude the loci suspected to have null alleles without a marked reduction in the probability of ex-clusion.
The fact that estimated frequencies differed from those reported in the literature in most loci analyzed, stresses the importance of independent estimates for differ-ent regions and races.
In sum, these results indicate that the selected system of markers is highly effective for relatedness studies, with a Probability of Exclusion greater than 99.9% considering all loci. The significance of this report, the first of this kind in the country, is that it offers interesting perspectives for the incorporation of molecular genetic techniques to animal breeding in Uruguay. In addition, our results represent an original contribution of allele frequencies for regional Cor-riedale and Australian Merino races.
Acknowledgments
We are grateful to Jaime Mendoza, Roberto Cardel-lino and Mario Azzarini, from SUL (Secretariado Uru-guayo de la Lana) for encouragement and collaboration in the field work, and to CSIC (Comisión Sectorial de Inves-tigación Científica de la Universidad de la República) for financial support of this work.
References
Botstein D, White RL, Skolnick M and David R (1980) Construc-tion of a genetic linkage map in man using restricConstruc-tion frag-ment length polymorphisms. Am. J. Hum. Genet. 32:314-331.
Buchanan F and Crawford AM (1993) Ovine microsatellites at the OarFCB11, OarFCB128, OarFCB193, OarFCB266 and OarFCB304 loci. Anim. Genet. 24:145.
Buchanan FC, Galloway SM and Crawford AM (1994) Ovine microsatellites at the OarFCB5, OarFCB19, OarFCB20, OarFCB48, OarFCB129 and OarFCB226 loci. Anim. Genet. 25:60.
Crawford AM, Dodds KG, Ede AJ, Pierson CA, Montgomery GW, Garmonsway HG, Beattie AE, Davies K, Maddox JF, Kappes SW, et al. (1995). An autosomal genetic linkage map of the sheep genome. Genetics. 140:703-724.
de Gortari MJ, Freking BA, Kappes SM, Leymaster KA, Crawford AM, Stone RT and Beattie CW (1997) Extensive genomic conservation of cattle microsatellite heterozygosity in sheep. Animal. Genetics. 28:274-290.
de Gortari MJ, Freking BA, Cuthbertson RP, Kappes SM, Keele JW, Stone RT, Leymaster KA, Dodds KG, Crawford AM and Beattie CW (1998) A second-generation linkage map of the sheep genome. Mamm. Genome. 9:204-209.
Ede AJ, Pierson CA and Crawford AM (1995) Ovine microsa-tellites at the OarCP9, OarCP16, OarCP20, OarCP21, OarCP23 and OarCP26 loci. Anim. Genet. 26:129-130. Henry HM, Penty JM, Pierson CA and Crawford AM (1993)
Ovine microsatellites at the OarHH35, OarHH41, OarHH44, OarHH47and OarHH64 loci. Anim. Genet. 24:222.
Hayes H, Le Chalony C, Goubin G, Mercier D, Payen E, Bignon C and Kohno K (1996) Localization of ZNF164, ZNF146, GGTA1, SOX2, PRLR and EEF2 on homologous cattle, sheep and goat chromosomes by fluorescent in situ hybrid-ization and comparison with the human gene map. Cyto-genet. Cell Genet. 72:342-346.
Jenkins ZA, Henry HM, Galloway SM, Dodds KG and Montgom-ery GW (1997) Comparative linkage mapping of genes on sheep chromosome 3 provides evidence of chromosomal re-arrangements in the evolution of Bovidae. Cytogenet. Cell Genet. 78:272-274.
Majala K (1997) Genetics aspects of domestication, common breeds and their origin. In: Piper L and Rubinsky A (eds) The genetics of sheep. CAB International, U.K , pp. 13-50. Miller SA, Dikes DD and Polesky HH (1988) A simple salting
procedure for extracting DNA from human nucleated cells. Nucleic Acids Res. 16:215.
Mulsant P, Schibler L, Lecerf F, Riquet J, Chitour N, Eggen A, Cribiu EP, Lanneluc I and Elsen JM (1998) Regional map-ping of the FecB (Booroola) region of sheep chromosome 6. Anim. Genet. 29:36-37.
Pierson CA, Hanrahan V, Ede AJ and Crawford AM (1993) Ovine microsatellites at the OarVH34, OarVH58, OarVH61 and OarVH72 loci. Anim. Genet. 24:224.
Pritchard JK, Stephens M and Donnelly P (2000) Inference of population structure using multilocus genotype data. Genet-ics. 155:945-959.
Queller DC, Strassmann JE and Hughes CR (1993) Microsa-tellites and Kinship. Tree. 8:285-288.
Raymond M and Rousset F (1995) GenePop (version 1.2). Popu-lation genetics software for exact test and ecumenisism. J. Hered. 86:248-249.
Sanguinetti CJ, Neto ED and Simpson AJG (1994) Rapid silver staining and recovery of PCR products separated on polya-crilamide gels. Biotechniques. 17:915-918.
Usha AP, Simpson SO and Williams JL (1995) Probability of ran-dom sire exclusion using microsatellite markers for parent-age verification. Anim. Genet. 26:155-161.