Prediction of the Unified Parkinson’s Disease Rating Scale assessment
using a genetic programming system with geometric semantic genetic
operators
Mauro Castelli
a,⇑, Leonardo Vanneschi
a, Sara Silva
b,c aISEGI, Universidade Nova de Lisboa, 1070-312 Lisboa, PortugalbINESC-ID, IST, University of Lisbon, 1000-029 Lisbon, Portugal cLabMAg, FCUL, University of Lisbon, 1749-016 Lisbon, Portugal
a r t i c l e
i n f o
Keywords:
Unified Parkinson’s Disease Rating Scale Genetic programming
Geometric operators Semantics
a b s t r a c t
Unified Parkinson’s Disease Rating Scale (UPDRS) assessment is the most used scale for tracking Parkin-son’s disease symptom progression. Nowadays, the tracking process requires a patient to undergo inva-sive and time-consuming specialized examinations in hospital clinics, under the supervision of trained medical staff. Thus, the process is costly and logistically inconvenient for both patients and clinicians. For this reason, new powerful computational tools, aimed at making the process more automatic, cheaper and less invasive, are becoming more and more a necessity. The purpose of this paper is to investigate the use of an innovative intelligent system based on genetic programming for the prediction of UPDRS assess-ment, using only data derived from simple, self-administered and non-invasive speech tests. The system we propose is called geometric semantic genetic programming and it is based on recently defined geo-metric semantic genetic operators. Experimental results, achieved using the largest database of Parkin-son’s disease speech in existence (approximately 6000 recordings from 42 ParkinParkin-son’s disease patients, recruited in a six-month, multi-centre trial), show the appropriateness of the proposed system for the prediction of UPDRS assessment. In particular, the results obtained with geometric semantic genetic pro-gramming are significantly better than the ones produced by standard genetic propro-gramming and other state of the art machine learning methods both on training and unseen test data.
Ó2014 Elsevier Ltd. All rights reserved.
1. Introduction
Neurological disorders, including Parkinson’s disease (PD), af-fect profoundly the lives of patients and their families ( Caap-Ahl-gren & Dehlin, 2002). PD is a disorder of the central nervous system that leads to severe difficulties with body motions. It is the second most common neurodegenerative disorder after Alzhei-mer’s disease (de Rijk et al., 2000) and it is estimated that more than one million people in North America alone are affected by it (Lang & Lozano, 1998). Moreover, as explained inLittle, McSharry, Hunter, Spielman, and Ramig (2009), because of the rapid increase in the average population age in several countries, and since the risk of contracting PD increases after the age of 60 (Van Den Eeden et al., 2013), this number is expected to rise in the next few years. As a direct consequence, the medical care costs for patients with
PD is estimated to rise in the future (Huse et al., 2005). The cur-rently available therapies aim at improving the functional capacity of the patient for as much time as possible; however they are not able to modify the progression of the neurodegenerative process (Singh, Pillay, & Choonara, 2007). Most people affected by PD will therefore be substantially dependent on clinical intervention.
The process of tracking PD symptoms progression is a complex task. It often uses a system of measurement of the intensity of the symptoms called Unified Parkinson’s Disease Rating Scale (UPDRS). The UPDRS is a scale that was developed as an effort to incorporate elements from existing scales to provide a comprehensive, efficient and flexible way of measuring and monitoring PD-related disabil-ity and impairment (Movement Disorder Society, 2003). Prior to its development, multiple scales were used in different hospital clinics and health centers, making comparative assessments diffi-cult. One of the core advantages of the UPDRS is that it was devel-oped as a compound scale to capture multiple aspects of PD. It assesses both motor disability and motor impairment. Of all anal-ogous available clinical scales, the UPDRS is currently the most
http://dx.doi.org/10.1016/j.eswa.2014.01.018 0957-4174/Ó2014 Elsevier Ltd. All rights reserved.
⇑Corresponding author. Tel.: +351 213828628; fax: +351 213872140. E-mail addresses: [email protected] (M. Castelli),[email protected] (L. Vanneschi),[email protected](S. Silva).
Contents lists available atScienceDirect
Expert Systems with Applications
commonly used one (Ramaker, Marinus, Stiggelbout, & Van Hilten, 2002). It reflects the presence and severity of symptoms, express-ing it in a range from 0 to 176, with 0 representexpress-ing a healthy state and 176 total disability. The UPDRS contains three sections:
Mentation, Behavior and Mood.
Activities of daily living.
Motor.
The motor section of the UPDRS encompasses tasks such as speech, facial expression, tremor and rigidity and expresses the severity of the related symptoms in a range from 0 to 108, where 0 represents a symptom free state and 108 denotes severe motor impairment.
For many persons affected by PD, the necessary specialized medical examinations to estimate the severity of their symptoms are difficult and invasive and they have to be performed by trained medical staff. Thus, as described inTsanas, Little, McSharry, and Ramig (2010), symptom monitoring is costly and logistically incon-venient for patients and clinicians. All these critical aspects high-light the need of reliable and accurate computational techniques that allow estimating the UPDRS automatically and effectively.
In this paper, we present a comparative study of a set of compu-tational methods aimed at predicting the severity of the PD symp-toms in their entirety (i.e. including all of the three sections of the UPDRS) and the severity of the symptoms considered in the motor section of the UPDRS. The studied methods attempt to express these quantities as a function of several other features related to patients. Thus, the application is reduced to two symbolic regres-sion problems, using as many datasets. The two datasets contain identical features and differ between each other in terms of the tar-get values to be predicted. The dataset using as tartar-get the values of the severity of the general PD symptoms (including all of the three sections of the UPDRS) will be calledtotal-UPDRSfrom now on, while the one using as target the values of the severity of the motor symptoms will be calledmotor-UPDRS.
In particular, the focus of this paper is on an intelligent system based on genetic programming (Koza, 1992; Poli, Langdon, & Mcphee, 2008). We use a recently introduced version of genetic programming, that uses so called geometric semantic genetic oper-ators. We compare the results obtained with this new version of genetic programming to the ones returned by standard genetic programming and a set of different state-of-the-art machine learn-ing methods.
The paper is organized as follows: Section2introduces standard genetic programming. Section3presents and motivates geometric semantic genetic operators. Section4describes the data we used and our experimental settings and proposes an accurate analysis of the results, comparing them with several different machine learning techniques. Finally, Section5concludes the paper.
2. Genetic programming
Models lie in the core of any technology in any industry, be it finance, health, manufacturing, services, mining, or information technology. The task of data-driven modeling lies in using a limited number of observations of system variables for inferring relation-ships among these variables. The design of reliable learning ma-chines for data-driven modeling tasks is of strategic importance, as there are many systems that cannot be accurately modeled by classical mathematical or statistical techniques. Reliable learning in the field of Machine Learning (ML) revolves around the notion of generalization, which is the ability of a learned model to correctly explain data that have not been used during the training process. Genetic programming (GP) (Koza, 1992; Poli et al., 2008) is
one of the youngest paradigms inside the computational intelli-gence research area called evolutionary computation and consists in the automated learning of computer programs by means of a process mimicking Darwinian evolution. GP tackles learning prob-lems by searching a computer program space for the program that better respects some given functional specifications. In other words, GP is an evolutionary computation technique that automat-ically solves problems without requiring the user to know or spec-ify the form or structure of the solution in advance. At the most abstract level, GP is a systematic, domain-independent method for getting computers to solve problems automatically starting from a high-level statement of what needs to be done. In GP a pop-ulation of computer programs is evolved and, generation by gener-ation, stochastically transformed into a population composed by new, hopefully better, programs. The recipe for solving a problem with GP is as follows:
Choose a representation space in which candidate solutions can be specified. This consists in deciding on the primitives of the programming language that will be used to construct programs. Usually, a program is built up from a terminal set (the variables in the problem) and a function set (the basic operators).
Design the fitness criteria for evaluating the quality of a solu-tion. This customarily involves the execution of a candidate solution on a suite of training cases, reminiscent of the process of black-box testing. In case of supervised learning, a distance-based function is typically employed to quantify the divergence of a candidate solution’s behavior from the desired one.
Design a parent selection and replacement policy. Central to every evolutionary algorithm is the concept of fitness-driven selection in order to exert an evolutionary pressure towards promising areas of the program space. The replacement policy determines the way in which newly created offspring programs replace their parents in the population.
Design a variation mechanism for generating offspring from parents. Standard GP traditionally uses two main variation operators: crossover and mutation. The standard version of crossover recombines parts of the structure of two individuals, whereas standard mutation stochastically alters a portion of the structure of an individual.
After a random initialization of a population of computer pro-grams, an iterative application of selection-variation-replacement is employed aimed at improving the programs quality in a step-wise refinement way. In GP, both terms of program and model re-fer to the same entity and will be used interchangeably. Supervised learning of regression models in GP relies on the extraction of im-plicit relationships that may exist in the input–output data speci-fied by the training examples. The discovered relationships are typically expressed in symbolic form, which is traditionally an expression represented as a tree structure. For a complete intro-duction to GP, the reader is referred toKoza (1992). In this work we use genetic operators that, diversely from the canonical ones, are based on the concept of semantics, that will be introduced in the next section. To understand the differences between geometric semantic genetic operators and the ones used in the standard GP algorithm, the latter are briefly described.
2.1. Standard crossover
The crossover operator is traditionally used to combine the ge-netic material of two parents by swapping a part of the structure (syntax) of one parent with a part of the other. More specifically, tree-based crossover proceeds by the following steps:
Choose two individuals as parents, based on mating selection policy (the better the fitness of the individual, the higher its probability of being selected).
Select a random subtree in each parent.
Swap the selected subtrees between the two parents. The resulting individuals are the children.
This process is shown, using two arbitrary simple boolean expressions as parents, inFig. 1.
2.2. Standard mutation
The mutation operation traditionally introduces random changes in the structure of the individuals in the population. While there are many different mutation operators, here subtree muta-tion (that is the most well-known one and also the one used in this work) is described. Subtree mutation begins by selecting a point at random within the ‘‘parent’’ tree. Then, it removes whatever is cur-rently at the selected point and whatever is below the selected point and inserts a randomly generated subtree at that point. This process is shown in Fig. 2, where an arbitrary simple boolean expression is mutated by replacing one of its subtrees with a ran-dom tree.
3. Geometric semantic operators
In the last few years, GP has been extensively used both in Industry and Academia (Arcuri & Yao, 2010; Chan, Kwong, & Fogarty, 2010; Choi & Choi, 2012; dos Santos, Ferreira, Torres, Gonçalves, & Lamparelli, 2011; Koza, Streeter, & Keane, 2008; Moreno-Torres, Llorá, Goldberg, & Bhargava, 2013; Ravisankar, Ravi, & Bose, 2010; Trujillo, Legrand, Olague, & Lévy-Véhel, 2012; Yeun, Suh, & Yang, 2000; Wongseree, Chaiyaratana, Vichittumaros, Winichagoon, & Fucharoen, 2007) and it has produced a wide set of results that have been defined human-competitive (Koza, 2010). While these results have demonstrated the appropriateness of GP in tackling real-life problems, research has recently focused on developing new variants of GP in order to further improve its per-formance. In particular, efforts have been dedicated to an aspect that was only marginally considered up to some years ago: the def-inition of methods based on the semantics of the solutions (Beadle & Johnson, 2009; Krawiec & Lichocki, 2009,; Uy, Hoai, O’Neill, McKay, & Phong, 2010; Uy et al., 2013). Although there is no uni-versally accepted definition of semantics in GP, this term often re-fers to the behavior of a program, once it is executed on a set of
data. For this reason, in many references, including here, the term semantics is intended as the vector of outputs a program produces on the training data (Moraglio, Krawiec, & Johnson, 2012). Although semantics determines what a program actually does, the traditional GP operators, like crossover and mutation described so far ignore this knowledge and manipulate programs only con-sidering their syntax. Abstraction from semantics allows them to rely on simple, generic search operators, but the main consequence of this choice is that it is difficult to predict how modifications of programs will affect their behaviour, and thus their quality in solv-ing the problem. Recently, new genetic operators, called geometric semantic genetic operators have been proposed inMoraglio et al. (2012). These operators, that manipulate programs considering di-rectly their semantic information, have a number of theoretical advantages, compared to the their counterparts in standard GP, the most important one being the fact that they induce a unimodal
fitness landscape(otherwise callederror surface) (Stadler & Insti-tute, 1995) on any problem consisting in finding the match be-tween a set of input data and a set of expected targets. This should relevantly improve GP’s evolvability (i.e. the ability of ge-netic operators to produce offspring that are fitter than their par-ents) (Vanneschi, 2004) on all these problems. In this section we report the definition of geometric semantic operators for real func-tions domains, since these are the operators we will use in the experimental phase. For applications that consider other kinds of data, the reader is referred toMoraglio et al. (2012).
3.1. Geometric semantic crossover
Given two parent functionsT1;T2:Rn!R, the offspring of the
geometric semantic crossover in the tree represented in Fig. 3, whereTRis a random real function whose output values range in the interval½0;1.
The interested reader is referred toMoraglio et al. (2012)for a demonstration of the fact that this operator corresponds to a geometric crossover on the semantic space, in the sense that it produces an offspring whose semantic vector stands on the seg-ment joining the semantic vectors of its parents. We can have an intuition of it by considering that the offspring generated by this
Fig. 1.An example of standard GP (subtree swapping) crossover.
Fig. 2.An example of standard GP (subtree) mutation.
crossover has a semantic vector that is a linear combination of the semantic vectors of the parents with random coefficients included in½0;1and whose sum is equal to 1. The authors ofMoraglio et al. (2012)also show an interesting consequence of this fact: the fit-ness of the offspring cannot be worse than the fitfit-ness of the worst of its parents. Also in this case we do not report a proof here, but we limit ourselves to give a visual intuition of this property: in
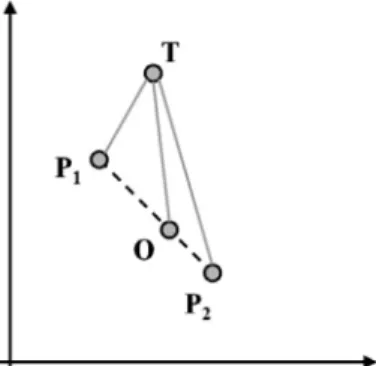
Fig. 4we report a simple two-dimensional semantic space in which we draw a targetT, the semantics of two parentsP1andP2and of one of their offspringO (which by construction is included be-tween its parents). InFig. 4, it is immediately clear thatOis closer toTthanP2(which is the worst parent in this case). The generality of this property is proven inMoraglio et al. (2012). To constrainTR in producing values in ½0;1 we use the sigmoid function:
TR¼1þe1Trand whereTrand is a random tree with no constraints on the output values.
3.2. Geometric semantic mutation
Given a functionT:Rn!R, the geometric semantic mutation
with mutation stepmscreates the real function shown inFig. 5, whereTR1andTR2are random real functions.
ReferenceMoraglio et al. (2012)shows that this operator corre-sponds to a ball mutation on the semantic space and induces a uni-modal fitness landscape. It is not difficult to have an intuition of it, considering that each element of the semantic vector of the off-spring is a ‘‘weak’’ perturbation of the corresponding element in the parent’s semantics. We informally define this perturbation as ‘‘weak’’ because it is given by a random expression centered in zero (the difference between two random trees). Nevertheless, by changing parameterms, we are able to tune the ‘‘step’’ of the muta-tion and thus the importance of this perturbamuta-tion. In this work, as in several previous contributions (like for instanceVanneschi, Cas-telli, Manzoni, & Silva, 2013), also the random treesTR1 andTR2 used by mutation have been constrained to assume values in
½0;1, using exactly the same method as for the treeTR used by crossover.
It is important to point out that at every step of one of these operators, offspring contain the complete structure of the parents, plus one or more random trees and some arithmetic operators: the size of each offspring is thus clearly much larger than the one of their parents. The rapid growth of the individuals in the population (demonstrated in Moraglio et al., 2012) makes these operators unusable in practice: after a few generations the population comes unmanageable because the fitness evaluation process be-comes unbearably slow. The solution suggested inMoraglio et al. (2012) consists in performing an automatic simplification step
after every generation, in which the programs are replaced by (hopefully smaller) semantically equivalent ones. However, this additional step adds to the computational cost of GP and is only a partial solution to the progressive program size growth. Last but not least, according to the particular language used to code individuals and the used primitives, automatic simplification can be a very hard task. The work proposed in Vanneschi et al. (2013)explained how the growth of the individuals can be ad-dressed, with a simple and efficient implementation of GP. This is the implementation we adopt here.
4. Experimental study
4.1. Data set
This study makes use of the recordings described inGoetz et al. (2009) and inTsanas et al. (2010), where 52 subjects with idio-pathic PD were recruited. A subject was diagnosed with PD if he had at least two of the following: rest tremor, bradykinesia (slow movement) or rigidity, without evidence of other forms of parkin-sonism. The study was supervised by six US medical centers: Geor-gia Institute of Technology (7 subjects), National Institutes of Health (10 subjects), Oregon Health and Science University (14 subjects), Rush University Medical Center (11 subjects), Southern Illinois University (6 subjects) and University of California Los Angeles (4 subjects). As inTsanas et al. (2010), we disregarded data from 10 recruits (two that dropped out the study early and a fur-ther eight that provided insufficient test data). The selected sub-jects had at least 20 valid study sessions during the trial period. We used data from the remaining 42 persons affected by PD (28 of which males) with diagnosis within the previous five years at trial onset, with an age range expressed as mean ± std. equal to 64:49:24, min. 36, max. 85, median 65 years. All subjects re-mained un-medicated for the six-month duration of the study. The UPDRS was assessed at baseline (onset of trial) and after three and six months. At baseline the scores were 19:428:12, min. 6, max. 36, median 18 points for motor-UPDRS and 26:3910:80, min. 8, max. 54, median 25:5 points for total-UPDRS. After three months: 21:699:18, min. 6, max. 38, median 21 points for mo-tor-UPDRS and 29:3611:82, min. 7, max. 55, median 28 points for total-UPDRS and after six months: 29:579:17, min. 5, max. 41, median 20 points for motor-UPDRS and 29:5711:92, min. 7, max. 54, median 26 points for total-UPDRS. The dataset is freely available on the UCI ML Repository (http://archive.ics.uci.edu/ml/).
Table 1reports the considered features.
As described inGoetz et al. (2009), the data was collected using the Intel At-Home Testing Device (AHTD), which is a telemonitor-ing system designed to facilitate remote, Internet-enabled measurement of a variety of PD-related motor impairment symp-toms. The data were collected at the patient’s home, transmitted over the internet and processed appropriately in the clinic to pre-dict the UPDRS score. The AHTD contains a docking station for measuring tremor, paddles and pegboards for assessing upper body dexterity, a high-quality microphone headset for recording patient voice signals and a USB data stick to store test data. A liquid-crystal display (LCD) displays instructions for taking the
Fig. 4.A visual intuition of the fact that geometric semantic crossover produces an offspring that is at least not worse than the worst of its parents. In this simple case, offspringO(which stands between parentsP1andP2by construction) is clearly closer to targetTthan parentP2.
Fig. 5.Geometric semantic mutation of an individualT, using random programsTR1 andTR2.
tests. Typical audible prompts instruct the patient to undertake tasks to measure tremor, bradykinesia, complex coordinated motor function, speech and voice. As part of a trial to test the effective-ness of the AHTD system in practice, people affected by PD were recruited and trained to use the device. Subsequently, an AHTD was installed in their home and they performed tests on a weekly basis. Each patient specified a day and time of the week during which they had to complete the protocol, prompted with an auto-matic alarm reminder on the device. The collected data was en-crypted and transmitted to a dedicated server automatically when the USB stick was inserted in a computer with internet con-nection. The audio recordings are of two types: sustained phona-tions and running speech tests in which the subject is instructed to describe static photographs displayed on the AHTD’s screen. They were recorded using a head-mounted microphone placed 5 cm from the patient’s lips. The AHTD software was devised such that an initial audible, spoken instruction followed by a ‘‘beep’’ prompted the subject to begin phonation: an audio amplitude threshold detector triggered the capture of audio and subsequently the capture was stopped one second after the detected signal amplitude dropped below that threshold, or 30 s of audio had been captured. Further details about the AHTD system and trial protocol can be found inGoetz et al. (2009).
4.2. Experimental settings
We tested the proposed implementation of GP with geometric semantic operators (GS-GP from now on) against a standard GP system (ST-GP). A total of 50 runs were performed with each tech-nique. In each run a different partition between training and test data has been considered. In particular, at the beginning of each different run, 70% of the data instances, selected randomly with uniform distribution, has been used for the training phase, while the remaining 30% has been used to test the performance of the model found at the end of the training. All the runs used popula-tions of 200 individuals and the evolution stopped after 200 gener-ations. Trees initialization was performed with the Ramped Half-and-Half method (Koza, 1992) with a maximum initial depth equal to 6. The function set contained the four binary arithmetic operatorsþ; ; and=protected as inKoza (1992). Fitness was calculated as the mean absolute error (MAE) between predicted and target values. The terminal set contained 18 variables, each one corresponding to a different feature in the dataset. To create new individuals, ST-GP used standard (subtree swapping) crossover (Koza, 1992) and (subtree) mutation (Koza, 1992) with
probabilities equal to 0:9 and 0:1 respectively. For GS-GP, geomet-ric semantic crossover rate is 0:7, while geometric semantic muta-tion rate is 0:3. The motivation for this different mutation rate for the two GP systems is that a preliminary experimental study has been performed (independently for the two systems) for finding the parameter setting able to return the best results. The mutation step parameter was 0:1. Survival from one generation to the other was always guaranteed to the best individual of the population (elitism). No maximum tree depth limit has been imposed during the evolution.
In the next section, experimental results are reported using curves of MAE on the training and test set. In particular, at each generation the best individual in the population (i.e. the one that has the smaller training MAE) has been chosen and the value of its MAE on the training and test has been stored. The reported curves finally contain the median of all these values collected at each generation. The median was preferred over the mean in the reported plots because of its higher robustness to outliers.
4.3. Experimental results: GS-GP vs ST-GP
Plots inFig. 6(a) and (b) report training and test error for the motor-UPDRS, at each generation, for ST-GP and GS-GP respec-tively and clearly show that GS-GP outperforms ST-GP on both training and test sets. The same qualitative results have been achieved with the total-UPDRS as shown inFig. 7(a) and (b). Plots inFig. 6(c) and (d) report a statistical study of the results achieved by ST-GP and GS-GP for the motor-UPDRS, considering the same 50 runs. Denoting byIQRthe interquartile range, the ends of the whis-kers represent the lowest datum still within 1:5IQRof the lower quartile and the highest datum still within 1:5IQRof the upper quartile. As it is possible to see, GS-GP outperforms ST-GP both on training and test data. To analyze the statistical significance of these results, a set of tests has been performed on the median er-rors. As a first step, the Kolmogorov–Smirnov test has shown that the data are not normally distributed and hence a rank-based sta-tistic has been used. Successively, the Wilcoxon rank-sum test for pairwise data comparison has been used under the alternative hypothesis that the samples do not have equal medians. Thep -va-lue obtained was 7:0661018when results on training data have been considered, while we obtained a p-value of 7:0661018 when we considered results on test data. Therefore, also in this case, when using the usual significance level
a
¼0:01, we can clearly state that GS-GP produces solutions that are significantlyTable 1
Features in the considered dataset. MDVP stands for (Kay Pentax) Multidimensional Voice Program.
Feature Description
Age Subject age
Sex Subject gender ‘‘0’’ – male, ‘‘1’’ – female
MDVP:Jitter (ABS) Kay Pentax MDVP absolute jitter in microseconds (Boersma, 2001) MDVP:RAP Kay Pentax MDVP relative amplitude perturbation (Boersma, 2001) MDVP:PPQ Kay Pentax MDVP five-point period perturbation quotient (Boersma, 2001)
Jitter:DDP Average absolute difference of differences between cycles, divided by the average period (Boersma, 2001) MDVP:Shimmer Kay Pentax MDVP local shimmer (Boersma, 2001)
MDVP:Shimmer (dB) Kay Pentax MDVP local shimmer in decibels (Boersma, 2001) Shimmer:APQ3 Three-point amplitude perturbation quotient (Boersma, 2001) Shimmer:APQ5 Five-point amplitude perturbation quotient (Boersma, 2001)
MDVP:APQ Kay Pentax MDVP 11 point amplitude perturbation quotient (Boersma, 2001)
Shimmer:DDA Average absolute difference between consecutive differences between the amplitudes of consecutive periods (Boersma, 2001) NHR Noise to harmonies ratio (Boersma, 2001)
HNR Harmonies to noise ratio (Boersma, 2001)
better than the ones produced by ST-GP both on training and test data for the motor-UPDRS target.
The same analysis has been performed for the results related to the total-UPDRS. Results of this analysis have been reported in
Fig. 7(c) and (d). Also in this case GS-GP produces better solutions with respect to the ones obtained with ST-GP. Thep-value obtained was 7:0671018when results on training data have been consid-ered, while ap-value of 7:501018has been obtained considering the results on out of samples data. Therefore, when using the sig-nificance level
a
¼0:01, we can state that GS-GP produces solu-tions that are better than the ones produced by ST-GP with respect to the total-UPDRS target.4.4. Experimental results: GS-GP vs state-of-the-art machine learning techniques
Besides comparing GS-GP with ST-GP, we are also interested in comparing GS-GP with other well-known state-of-the-art ML methods, to have an idea of the competitiveness of the obtained re-sults. To perform the comparison, we used the implementations provided by the Weka public domain software (Weka Machine Learning Project, 2013). As done for the previous experimental phase, a preliminary study has been performed in order to find the best tuning of the parameters for the considered techniques. Moreover, we compare our results with the ones obtained by the
0 50 100 150 200
5 6 7 8
Number of Generations
Train Error (Motor UPDRS)
ST−GP GS−GP
0 50 100 150 200
5.5 6 6.5 7 7.5 8 8.5
Number of Generations
Test Error (Motor UPDRS)
ST−GP GS−GP
(a)
(b)
ST−GP GS−GP
5.5 6 6.5 7
Train Error (Motor UPDRS)
ST−GP GS−GP
5.5 6 6.5 7 7.5
Test Error (Motor UPDRS)
(c)
(d)
Fig. 6.GS-GP vs ST-GP: results obtained for the Motor-UPDRS. Evolution of (a) training and (b) test errors for each technique, median over 50 independent runs. Boxplots of (c) training and (d) test fitness at the end of the evolution.
0 50 100 150 200
7 8 9 10 11
Number of Generations
Train Error (Total UPDRS)
ST−GP GS−GP
0 50 100 150 200
7 8 9 10 11 12
Number of Generations
Test Error (Total UPDRS)
ST−GP GS−GP
ST−GP GS−GP
7 7.5 8 8.5
Train Error (Total UPDRS)
ST−GP GS−GP
7 7.5 8 8.5 9 9.5
Test Error (Total UPDRS)
(a)
(b)
(c)
(d)
Fig. 7.GS-GP vs ST-GP: results obtained for the Total-UPDRS. Evolution of (a) training and (b) test errors for each technique, median over 50 independent runs. Boxplots of (c) training and (d) test fitness at the end of the evolution.
two best techniques proposed inTsanas et al. (2010)in which ex-actly the same dataset used in our work has been used.
The results of the comparison we performed are reported in
Figs. 8 and 9, whileTable 2 summarizes all the results. In the
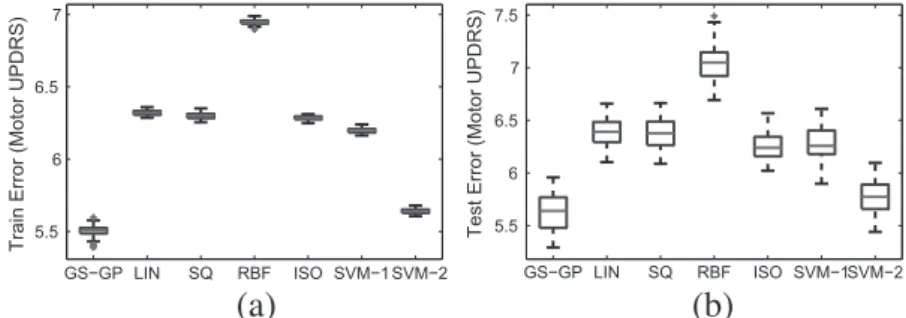
two figures LIN stands for linear regression, SQ stands for least square regression, RBF stands for radial basis function network, ISO stands for isotonic regression, SVM-1 refers to the support vec-tor machines with polynomial kernel of first degree and SVM-2
GS−GP LIN SQ RBF ISO SVM−1 SVM−2 5.5
6 6.5 7
Train Error (Motor UPDRS)
GS−GP LIN SQ RBF ISO SVM−1SVM−2 5.5
6 6.5 7 7.5
Test Error (Motor UPDRS)
(a)
(b)
Fig. 8.GS-GP vs other state-of-the-art ML methods. Results obtained for the Motor-UPDRS. Boxplots of (a) training and (b) test fitness for the 50 runs of the considered ML techniques.
GS−GP LIN SQ RBF ISO SVM−1SVM−2 7
7.5 8 8.5
Train Error (Total UPDRS)
GS−GP LIN SQ RBF ISO SVM−1SVM−2 7
7.5 8 8.5 9
Test Error (Total UPDRS)
(a)
(b)
Fig. 9.GS-GP vs other state-of-the-art ML methods. Results obtained for the Total-UPDRS. Boxplots of (a) training and (b) test fitness for the 50 runs of the considered ML techniques.
Table 2
Experimental comparison between different non-evolutionary ML techniques for UPDRS prediction. Median of training error and test error calculated over 50 runs of each ML technique. For the techniques used inTsanas et al. (2010)the values found in the paper have been reported. CART stands for classification and regression trees, while IRLS stands for iteratively re-weighted least squares.
Method Training (motor) Test (motor) Training (total) Test (total)
Linear regression (Weisberg, 2005) 6.32 6.39 8.02 8.15
(5.86%) (5.92%) (4.56%) (4.63%)
Least square regression (Seber & Wild, 2003) 6.30 6.38 7.93 8.09
(5.83%) (5.91%) (4.51%) (4.6%)
Radial basis function network (Haykin, 1999) 6.95 7.05 8.65 8.80
(6.44%) (6.53%) (4.91%) (5%)
Isotonic regression (Hoffmann, 2009) 6.29 6.24 8.03 8.08
(5.82%) (5.78%) (4.56%) (4.59%)
SVM polynomial kernel (1°) (lkopf & Smola, 2002) 6.20 6.26 7.87 8.06
(5.74%) (5.8%) (4.47%) (4.58%)
SVM polynomial kernel (2°) 5.64 5.77 7.21 7.47
(5.22%) (5.34%) (4.1%) (4.24%)
CART based method proposed inTsanas et al. (2010) N.A. 5.95 N.A. 7.52
N.A. (5.51%) N.A. (4.27%)
IRLS based method proposed inTsanas et al. (2010) N.A. 6.80 N.A. 8.47
N.A. (6.3%) N.A. (4.81%)
Table 3
GS-GP vs other state-of-the-art ML methods. Results obtained for the Motor-UPDRS.p-values given by the statistical test.
Motor-UPDRS
LIN SQ RBF ISO SVM-1 SVM-2
GS-GP TRAIN 7.06E18 7.06E18 7.07E18 7.07E18 7.06E18 7.07E18
refers to the support vector machines with polynomial kernel of second degree. From these figures it is possible to see that GS-GP performs better than all the considered ML methods.
To assess the statistical significance of these results, the same set of tests performed in the previous section has been performed. In this case, a Bonferroni correction for the value of
a
has been con-sidered. All thep-values are reported inTables 3 and 4. According to the results reported in the two tables, the differences in terms of training and test error between GS-GP and the considered ML tech-niques are statistically significant, except when GS-GP and SVM-2 are compared considering the total-UPDRS on the test set. Finally, results obtained with GS-GP outperform the best results obtained inTsanas et al. (2010)in which the same dataset has been consid-ered and several ML techniques have been applied.5. Conclusions
The process of tracking Parkinson’s disease (PD) symptoms pro-gression is very complex and new and powerful computational methods are needed to automatize it and make it faster and more reliable. The objective of this paper was to present a computational intelligence method that could outperform the state-of-the-art ones in terms of prediction accuracy of the PD symptoms progres-sion, automatically discovering insightful relationships between dysphonia measures and the well known Unified Parkinson’s Dis-ease Rating Scale (UPDRS). In particular, we have studied the asso-ciation strength of these measures and (motor and total) UPDRS. The computational method we presented is new and quite promis-ing. It is a recently introduced version of Genetic programming (GP) that makes use of geometric semantic operators, and that is called Geometric Semantic GP (GS-GP). Among several different as-pects, in recent contributions GS-GP has been shown to induce, by construction, a unimodal error surface for any supervised learning problem like regression and classification. This allows us, in a rather straightforward way, to overcome the problem of getting stuck into local minima, typical of the majority of the existing Ma-chine Learning (ML) methods.
The main contribution of this paper consisted in showing how GS-GP can improve the state-of-the-art performance in the predic-tion of PD symptoms progression, thus fostering GS-GP as a new concrete support tool for PD treatments. The comparatively small errors returned by GS-GP with respect to other state-of-the-art methods was notable and demonstrated that the sustained vowel phonations convey sufficient information to predict UPDRS to clin-ically useful accuracy. It has been shown that motor-UPDRS can be estimated within approximately 5.5 points (the full range spans 108 points) and total-UPDRS within 7 points (the full range spans 176 points). These predictions are comparable to, and in some con-ditions even better than the clinicians’ observations and pave the way to relevant practical implications in the future, which, for in-stance, will involve the development of an embedded system working on the currently used At-Home Testing Devices (AHTD).
All in all, the advantage of GS-GP is that it is able to return re-sults with a significantly smaller error than the state-of-the-art methods on the studied application, both on training and test data. On the other hand, GS-GP also has some clear drawbacks, that deserve investigation in the future. The major drawback clearly
consists in the fact that the final model it generates has usually large size. Even when GS-GP is implemented efficiently, like in the study presented here, this drawback clearly compromises one of the traditional strengths of GP, i.e., its ability to produce solu-tions that are readable and interpretable by humans. Another pos-sible weakness of GS-GP is that it currently relies on a template transformation. A general purpose transformation for a Turing complete GP language does not exist yet. One possible implication is that standard GP may be more general, in the sense that it may be able to explore solutions that GS-GP cannot generate (because the structure of those solutions does not match the template transformation).
Acknowledgments
This work was supported by national funds through FCT under contract PEst-OE/EEI/LA0021/2013 and by projects MassGP (PTDC/ EEI-CTP/2975/2012), EnviGP (PTDC/EIA-CCO/103363/2008) and InteleGen (PTDC/DTP-FTO/1747/2012), Portugal.
References
Arcuri, A., & Yao, X. (2010). Co-evolutionary automatic programming for software development.Information Sciences.
Beadle, L., & Johnson, C. G. (2009). Semantically driven mutation in genetic programming. In A. Tyrrell (Ed.),2009 IEEE congress on evolutionary computation. IEEE computational intelligence society(pp. 1336–1342). Trondheim, Norway: IEEE Press.
Boersma, P. (2001). Praat, a system for doing phonetics by computer. Glot International, 5, 341–345.
Caap-Ahlgren, M., & Dehlin, O. (2002). Factors of importance to the caregiver burden experienced by family caregivers of parkinson’s disease patients.Aging Clinical and Experimental Research, 14, 371–377.
Chan, K., Kwong, C., & Fogarty, T. (2010). Modeling manufacturing processes using a genetic programming-based fuzzy regression with detection of outliers. Information Sciences, 180, 506–518.
Choi, W. J., & Choi, T. S. (2012). Genetic programming-based feature transform and classification for the automatic detection of pulmonary nodules on computed tomography images.Information Sciences, 212, 57–78.
de Rijk, M. C., Launer, L. J., Berger, K., Breteler, M. M., Dartigues, J. F., Baldereschi, M., et al. (2000). Prevalence of Parkinson’s disease in Europe: A collaborative study of population-based cohorts. Neurologic diseases in the elderly research group. Neurology, 54, S21–S23.
dos Santos, J., Ferreira, C., Torres, R. daS., Gonçalves, M., & Lamparelli, R. (2011). A relevance feedback method based on genetic programming for classification of remote sensing images.Information Sciences, 181, 2671–2684.
Goetz, C. G., Stebbins, G. T., Wolff, D., DeLeeuw, W., Bronte-Stewart, H., Elble, R., et al. (2009). Testing objective measures of motor impairment in early Parkinson’s disease: Feasibility study of an at-home testing device.Movement Disorders, 24, 551–556.
Haykin, S. (1999).Neural networks: A comprehensive foundation. Prentice Hall. Hoffmann, L. (2009). Multivariate isotonic regression and its algorithms, Wichita
State University, College of Liberal Arts and Sciences, Department of Mathematics and Statistics.
Huse, D. M., Schulman, K., Orsini, L., Castelli-Haley, J., Kennedy, S., & Lenhart, G. (2005). Burden of illness in Parkinson’s disease. Movement Disorders, 20, 1449–1454.
Jackson, D. (2010). Promoting phenotypic diversity in genetic programming. InPPSN 2010 11th international conference on parallel problem solving from nature.Lecture notes in computer science(Vol. 6239, pp. 472–481). Krakow, Poland: Springer. Type = Book.
Kantz, H., & Schreiber, T. (2004).Nonlinear time series analysis. Cambridge University Press.
Koza, J. R. (1992).Genetic programming: On the programming of computers by means of natural selection. Cambridge, MA, USA: MIT Press.
Koza, J. R. (2010). Human-competitive results produced by genetic programming. Genetic Programming and Evolvable Machines, 11, 251–284.
Table 4
GS-GP vs other state-of-the-art ML methods. Results obtained for the Total-UPDRS.p-values given by the statistical test.
Total-UPDRS
LIN SQ RBF ISO SVM-1 SVM-2
GS-GP TRAIN 7.06E18 7.06E18 7.07E18 7.06E18 7.06E18 5.02E14
TEST 3.74E17 7.12E17 7.07E18 8.00E17 2.40E16 3.58E02
Koza, J. R., Streeter, M. J., & Keane, M. A. (2008). Routine high-return human-competitive automated problem-solving by means of genetic programming. Information Sciences, 178, 4434–4452.
Krawiec, K., & Lichocki, P. (2009,). Approximating geometric crossover in semantic space. InGECCO ’09: Proceedings of the 11th annual conference on genetic and evolutionary computation(pp. 987–994). Montreal: ACM.
Lang, A. E., & Lozano, A. M. (1998). Parkinson’s disease. Second of two parts.The New England Journal of Medicine, 339, 1130–1143.
Little, M., McSharry, P., Hunter, E., Spielman, J., & Ramig, L. (2009). Suitability of dysphonia measurements for telemonitoring of parkinson’s disease. IEEE Transactions on Biomedical Engineering, 56, 1015.
Little, M., McSharry, P., Roberts, S., Costello, D., & Moroz, I. (2007). Exploiting nonlinear recurrence and fractal scaling properties for voice disorder detection. BioMedical Engineering OnLine, 6, 1–19.
lkopf, B., & Smola, A. (2002). Learning with kernels: Support vector machines, regularization, optimization and beyond, adaptative computation and machine learning series. MIT Press.
Moraglio, A., Krawiec, K., & Johnson, C. G. (2012). Geometric semantic genetic programming. InParallel problem solving from nature, PPSN XII (part 1).Lecture notes in computer science(Vol. 7491, pp. 21–31). Springer.
Moreno-Torres, J. G., Llorá, X., Goldberg, D. E., & Bhargava, R. (2013). Repairing fractures between data using genetic programming-based feature extraction: A case study in cancer diagnosis.Information Sciences, 222, 805–823.
Movement disorder society task force on rating scales for Parkinson’s disease. (2003). The Unified Parkinson’s Disease Rating Scale (updrs): Status and recommendations.Movement Disorders, 18, 738–750.
Poli, R., Langdon, W. B., Mcphee, N. F. (2008). A field guide to genetic programming. Available from:<http://www.gp-field-guide.org.uk>.
Ramaker, C., Marinus, J., Stiggelbout, A. M., & Van Hilten, B. J. (2002). Systematic evaluation of rating scales for impairment and disability in Parkinson’s disease. Movement Disorders, 17, 867–876.
Ravisankar, P., Ravi, V., & Bose, I. (2010). Failure prediction of dotcom companies using neural network-genetic programming hybrids.Information Sciences, 180, 1257–1267.
Seber, G., & Wild, C. (2003).Nonlinear regression.Wiley series in probability and statistics. Wiley.
Singh, N., Pillay, V., & Choonara, Y. E. (2007). Advances in the treatment of Parkinson’s disease.Progress in Neurobiology, 81, 29–44.
Stadler, P., & Institute, S. (1995). Towards a theory of landscapes. InComplex systems and binary networks.Lecture notes in physics(Vol. 461–461, pp. 78–163). Berlin/ Heidelberg: Springer.
Trujillo, L., Legrand, P., Olague, G., & Lévy-Véhel, J. (2012). Evolving estimators of the pointwise holder exponent with genetic programming.Information Sciences, 209, 61–79.
Tsanas, A., Little, M. A., McSharry, P. E., & Ramig, L. O. (2010). Accurate telemonitoring of Parkinson’s disease progression by noninvasive speech tests.IEEE Transactions on Biomedical Engineering, 57, 884–893.
Uy, N. Q., Hoai, N. X., O’Neill, M., McKay, R., & Phong, D. N. (2013). On the roles of semantic locality of crossover in genetic programming.Information Sciences, 235, 195–213.
Van Den Eeden, S. K., Tanner, C. M., Bernstein, A. L., Fross, R. D., Leimpeter, A., Bloch, D. A., et al. (2013). Incidence of Parkinson’s disease: Variation by age, gender, and race/ethnicity.American Journal of Epidemiology, 157, 1015–1022. Vanneschi, L. (2004).Theory and practice for efficient genetic programming(Ph.D.
thesis). Switzerland: Faculty of Sciences, University of Lausanne.
Vanneschi, L., Castelli, M., Manzoni, L., & Silva, S. (2013). A new implementation of geometric semantic gp and its application to problems in pharmacokinetics. In EuroGP.Lecture notes in computer science(Vol. 7831, pp. 205–216). Springer. Weisberg, S. (2005).Applied linear regression.Wiley series in probability and statistics.
Wiley.
Weka Machine Learning Project. (2013). Weka. Available from: <http:// www.cs.waikato.ac.nz/ml/weka>.
Wongseree, W., Chaiyaratana, N., Vichittumaros, K., Winichagoon, P., & Fucharoen, S. (2007). Thalassaemia classification by neural networks and genetic programming.Information Sciences, 177, 771–786.