Patricia Mendes dos Santos(1), Ana Carolina Campana Nascimento(1),
Moysés Nascimento(1), Fabyano Fonseca e Silva(2), Camila Ferreira Azevedo(1),
Rodrigo Reis Mota(3), Simone Eliza Facioni Guimarães(2) and Paulo Sávio Lopes(2)
(1)Universidade Federal de Viçosa, Departamento de Estatística, Avenida P.H. Rolfs, s/no, CEP 36570-000 Viçosa, MG, Brazil. E-mail:
[email protected], [email protected], [email protected], [email protected] (2)Universidade Federal
de Viçosa, Departamento de Zootecnia, Avenida P.H. Rolfs, s/no, CEP 36570-000 Viçosa, MG, Brazil. E-mail: [email protected],
[email protected], [email protected] (3)Université de Liège, Gembloux Agro-Bio Tech, Passage des Déportés 2, B5030 Gembloux, Belgium.
E-mail: [email protected]
Abstract – The objective of this work was to evaluate the use of regularized quantile regression (RQR) to predict the genetic merit of pigs for asymmetric carcass traits, compared with the Bayesian lasso (Blasso) method. The genetic data of the traits carcass yield, bacon thickness, and backfat thickness from a F2 population composed of 345 individuals, generated by crossing animals from the Piau breed with those of a
commercial breed, were used. RQR was evaluated considering different quantiles (τ = 0.05 to 0.95). The RQR
model used to estimate the genetic merit showed accuracies higher than or equal to those obtained by Blasso, for all studies traits. There was an increase of 6.7 and 20.0% in accuracy when the quantiles 0.15 and 0.45 were considered in the evaluation of carcass yield and bacon thickness, respectively. The obtained results are indicative that the regularized quantile regression presents higher accuracy than the Bayesian lasso method for the prediction of the genetic merit of pigs for asymmetric carcass variables.
Index terms: Sus scrofa, Blasso, shrinkage.
Uso da regressão quantílica regularizada para predição de mérito
genético em suínos quanto a características assimétricas de carcaça
Resumo – O objetivo deste trabalho foi avaliar o uso da regressão quantílica regularizada (RQR) para predição do mérito genético em suínos quanto a características assimétricas de carcaça, em comparação ao método do lasso bayesiano (Blasso). Foram utilizados dados genéticos das características rendimento de carcaça, espessura de bacon e espessura de toucinho de uma população F2 composta por 345 indivíduos, obtida pelo cruzamento de animais da raça Piau com os de raça comercial. A RQR foi avaliada tendo-se considerado diferentes quantis (τ = 0,05 a 0,95). O modelo de RQR utilizado para estimar o mérito genético apresentou acurácias maiores ou iguais àquelas obtidas pelo Blasso, para todas as características estudadas. Houve incremento de 6,7 e 20,0% na acurácia, quando se consideraram os quantis 0,15 e 0,45 na avaliação do rendimento de carcaça e da espessura de bacon, respectivamente. Os resultados obtidos são indicativos de que a regressão quantílica regularizada apresenta maior acurácia que o método lasso Bayesiano para predição do mérito genético de variáveis assimétricas de carcaça.
Termos para indexação: Sus scrofa, Blasso, shrinkage.
Introduction
In Brazil, the pork market stands out, with a production of approximately 3.6 million tons of meat in 2015 (ABPA, 2015). This total represents about 3% of the world production, classifying the country as the fourth largest producer of this type of meat (ABPA, 2015). According to Ministério da Agricultura, Pecuária e Abastecimento (Brasil, 2014), the investments in research and in the genetic evolution of the species over the last 20 years have been responsible for the
great increase in meat production and quality, with emphasis on the importance of breeding programs.
impossible to predict all distributions of phenotypic values, may under- or overestimate the marker effects. This occurs because, in these situations, the mean may not be the best measure to represent data distribution and, consequently, the generated estimates may lead to mistakes in the selection of animals.
Although innumerable statistical methods for genomic selection – such as random regression of the best linear unbiased prediction (RR-Blup), Bayesian lasso (Blasso), Bayesian alphabet (Bayes A, Bayes B...), partial least squares, Kernel-based regression, among others – deal with multicollinearity and dimensionality issues, the problem of asymmetry in the distribution of phenotypic values is not commonly considered.
In this sense, Nascimento et al. (2017), in a simulation study, proposed the use of regularized quantile regression (RQR) in genomic selection. According to the authors, this method, besides overcoming the problems of multicollinearity and dimensionality, also takes into account the possibility of asymmetry in the distribution of the evaluated phenotype. In addition, it increases the accuracy of marker effects and, consequently, the genomic estimated breeding values for traits whose distributions show asymmetry. Such traits are commonly found in plant and animal breeding, such as, for example, number of days to flowering (Tuberosa, 2012) and hormone concentrations (Mathur et al., 2012).
In a genomic association and prediction analysis, Barroso et al. (2017) used RQR to estimate single nucleotide polymorphism (SNP) marker effects, considering as traits pig growth curve parameters. The authors identified the genomic regions that showed the most relevant marker effects and also estimated the genetic individual growth trajectory of the animals over time (genomic growth curves) under different quantiles.
RQR allows a more complete study of the relationships between the response (phenotype) and the explanatory (markers) variables. This is possible because, unlike traditional methods based on conditional expectations, it is based on conditional quantiles, which allows assessing these relationships for different phenotype levels and not only regarding their mean value.
The objective of this work was to evaluate the use of regularized quantile regression (RQR) to predict the genetic merit of pigs for asymmetric carcass traits, compared with the Bayesian lasso (Blasso) method.
Materials and Methods
The phenotypic data used in the present study were obtained from the pig breeding farm of the Department of Animal Science of Universidade Federal de Viçosa (UFV) and refer to the period from November 1998 to July 2001. These data came from an F2 population
composed of 345 individuals, generated by crossing animals of the Piau breed with those of a commercial breed (Large White x Landrace and Pietrain).
DNA was extracted at the animal biotechnology laboratory of the Department of Animal Science of UFV, and the procedures used are described in Peixoto et al. (2006). The genotyping of 384 SNPs was performed at the animal genetics laboratory of Embrapa Recursos Genéticos e Biotecnologia, by applying the GoldenGate assay with the VeraCode technology, using the BeadXpress reader from Illumina, as in Hidalgo et al. (2013).
The SNPs used for fine mapping were selected according to their spacing between the chromosomes where
quantitative trait loci
(
QTLs)
had previously been detected in the population and were distributed over Sus scrofachromosomes as follows: 85 on SSC1, 71 on SSC4, 84 on SSC7, 42 on SSC8, 36 on SSC17, and 66 on SSCX. From these 384 SNPs, 66 were discarded due to the absence of amplification, and, of the remaining 318 SNPs, 81 were discarded because they presented minor allele frequency lower than 0.05. After these procedures, the SNP markers were distributed as follows: 56 on SSC1, 54 on SSC4, 59 on SSC7, 31 on SSC8, 25 on SSC17, and 12 on SSCX, which corresponds to a total of 237 markers identified in the population (Hidalgo et al., 2013).The traits carcass yield (CY), bacon thickness (BT), and backfat thickness immediately after the last rib in the dorsal-lumbar line (LRBF) were analyzed. The phenotypic values were corrected for fixed effects of sex, batch, and halothane genotype. In order to evaluate the asymmetry of the distribution of the studied traits, the D’Agostino-Pearson test was used (D’Agostino & Pearson, 1973).
The general model adopted for the prediction of genomic breeding values was proposed by Meuwissen et al. (2001) and is described as:
y
ix g
ij je
j 1237
i
=
+
+
=
∑
where yi is the phenotypic value of the ith animal; µ is the
mean of the trait; gj is the jth SNP effect (j=1,2,...,237);
xij are the elements of the incidence matrix of each
marker j with 0.1 and 2.0 parameterization; and ei is
the vector of random errors, ei ~ N(0,σ2e).
To obtain the genomic estimated breeding values (GEBVs) of the animals, both RQR (Li & Zhu, 2008)
considering different quantiles (τ = 0.05 to 0.95) and
the Bayesian lasso (Blasso) method (de los Campos et al., 2009) were applied.
With the use of RQR, the estimation of the coefficients in the different quantiles of interest consists in solving the following optimization problem:
min yi x gij j g
j 1 p i 1 n j j 1 p
ρτ − −µ λ + = =
∑
=∑
∑
where Σp
j=1 |gj| is the sum of the absolute values
of the regression coefficients; λ is the smoothing
parameter that controls regularization strength,
with n = 345, p = 237; and ρτ ( ) is the denoted check
function (Koenker & Bassett Jr., 1978), defined by:
ρ µ
τ µ µ
τ y x g
y xg if y x
i ij j
j 1
p i j 1 ij j
p i i − − = − − − − = =
∑
∑
, jj j
j 1 p
i ij j
j 1 p
g 0
(1- ) y x g ,
= =
∑
∑
> − − τ µ
otherwise τ indicates the quantile of interest.
After estimating the parameters (marker effects), the GEBVs were obtained through the following expression:
GEBV ( )
iy ( )
ix g ( )
ij jj 1 p
τ
=
τ
=
τ
=
∑
where GEBVi (τ) is the genomic estimated breeding
value for the ith animal; and ĝ
j (τ) is the effect
of the jth SNP marker, defined by the functional
relationship obtained for 100τ% quantile of interest.
The GEBVs were also determined via Blasso by:
GEBVi i j 1xij j p = = =
∑
y gTo compare the methods, for RQR fit, the values of
the shrinkage parameter (λ) estimated from the Blasso
method, as well as a grid with values varying from 0 to those provided by Blasso, with an interval of 0.5, were considered.
After obtaining the GEBVs, the studied methods were compared considering accuracy, which was calculated according to the following expression:
r
y,g=
r
y,y/ h
2where ry,ŷ, is the predictive capacity of the model, given
by
ry g,=cov( , )y y var( ) var( );y y
and h2 is the heritability trait estimated by the
restricted maximum likelihood (REML) method using
a single-trait model, defined by h2 = v
g/vf, where vg is
the additive genetic variance and vf is the phenotypic
variance (Resende et al., 2010).
To check the degree of agreement between the methods for animal classification, Spearman’s correlation coefficient between GEBVs from the RQR and Blasso fitting models was calculated, as well as the percentage of agreement among 10% of the individuals that presented the highest genomic breeding values predicted by RQR and Blasso, using Cohen’s kappa coefficient.
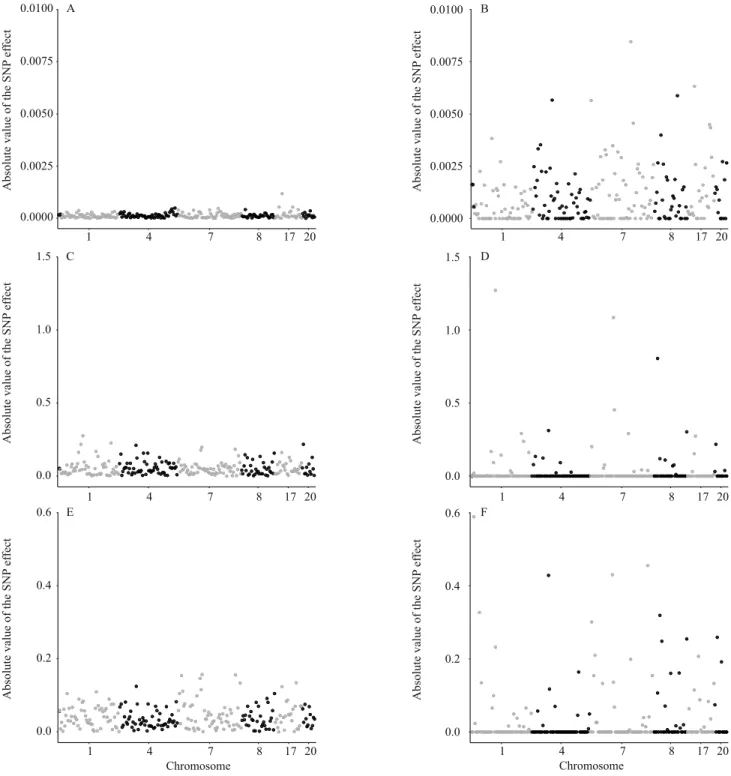
Finally, Manhattan plots were constructed to verify the behavior of SNP marker effects on chromosomes in both methods.
The entire described process was performed with the use of cross-validation. As in Teixeira et al. (2016), the pig population was divided into three distinct populations: two were used to estimate the marker effects and one to validate the estimates obtained from the prediction equations. The three possible combinations for this situation were used, and the final result refers to the mean values of accuracy.
Results and Discussion
The studied traits presented distribution with asymmetric behavior at 5% probability (Table 1).
In this case, the median (τ = 0.5) or another quantile
(T) is possibly more suitable to explain the functional relationship between markers and the assessed variables, since the mean is not the best measure to represent asymmetric distributions (Hao & Naiman, 2007).
The heritabilities of the evaluated traits, estimated via REML, were of low to moderate magnitude, with values equal to 0.20 for CY, 0.34 for BT, and 0.35 for LRBF. These values were similar to those found by Azevedo et al. (2013) for CY and by Miar et al. (2014) for BT and LRBF; the two last traits showed heritabilities of 0.45 and 0.38, respectively, considering a dataset of pigs from a Landrace × Large White crossing.
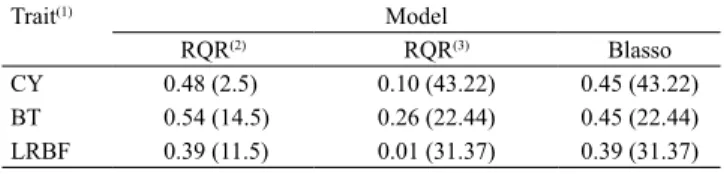
When the best combination between the quantile
(τ) and the regularization parameters (λ) for obtaining
the GEBVs was considered for each trait (CY, BD, and LRBF), accuracy ranged from 0.39 to 0.54 (Table 2). RQR presented better or equal results, compared with those of the Blasso method, which indicates that RQR is as a good alternative for the analysis. There was an increase of 6.7, 20.0, and 0.0% in accuracy for CY, BT, and LRBF, respectively, considering RQR0.15 (τ = 0.15),
RQR0.45 (τ = 0.45), and RQR0.50 (τ = 0.50). These results
make sense, because, unlike traditional methods, which are based on conditional means, E(Y|X), RQR allows to fit the model to different parts of the Y distribution and enables a more complete study of the phenomenon of interest (Koenker & Basset, 1978; Cade & Noon, 2003).
The estimates of the RQR model obtained with the λ
values from the Blasso method show that using identical
λ values in the fittings, via RQR and Blasso, is not a
good strategy for RQR, because the accuracy values obtained with this regression were lower than those with Blasso and the RQR models presented (Table2). This result may be explained by the differences in the regularization strengths (shrinkage) between the two methods. In quantile regression, shrinkage causes a greater shortening of the parameter estimates than
in Blasso. As an alternative, the λ value can also be
defined through cross-validation (Silva et al., 2011) or Bayesian inference (Alhamzawi et al., 2012).
The Spearman’s correlation and Cohen’s kappa coefficients ranged from low to moderate (Table 3). The obtained values for CY and BT were, respectively:
0.57 and 0.38; and 0.35 and 0.32. These results allow inferring that different animals were selected with the used models, since both coefficients were low. According to McHugh (2012), Cohen’s kappa coefficient values below 0.39, as observed for CY and BT, are indicative of a minimum agreement between methods. For LRBF, the values of Spearman’s correlation and Cohen’s kappa coefficients were, respectively, 0.69 and 0.54. The greater similarity between these values for LRBF may be due to the better performance of
the median (τ = 0.5) in obtaining the GEBVs for this
Table 1. Test statistics and p-values associated with the D’Agostino-Pearson test.
Variable(1) Asymmetry Kurtosis Omnibus test(2)
CY -15.82*** 12.10*** 396.75***
BT 3.48*** 1.18ns 14.29***
LRBF 2.58*** 2.35** 12.19***
(1)CY, carcass yield; BT, bacon thickness; and LRBF, backfat thickness
immediately after the last rib in the dorsal-lumbar line. (2)Normality
test. *, **, and ***Significant at 10, 5, and 1% probability, respectively.
nsNonsignificant.
Table 2. Accuracies obtained by the Bayesian lasso (Blasso) and the regularized quantile regression (RQR) methods for the traits under study.
Trait(1) Model
RQR(2) RQR(3) Blasso
CY 0.48 (2.5) 0.10 (43.22) 0.45 (43.22) BT 0.54 (14.5) 0.26 (22.44) 0.45 (22.44) LRBF 0.39 (11.5) 0.01 (31.37) 0.39 (31.37)
(1)CY, carcass yield; BT, bacon thickness; and LRBF, backfat thickness
immediately after the last rib in the dorsal-lumbar line. (2)Model with
shrinkage parameter value from the grid of values. (3)Model with shrinkage
parameter value from Blasso. Values between parentheses were used as
shrinkage parameters in the fit of the models.
Table 3. Estimates of Spearman’s correlation coefficient (rs) between the genomic estimated breeding values of the animals and Cohen’s kappa coefficient (k) for the traits under study, both obtained by the Bayesian lasso (Blasso) and the regularized quantile regression (RQR) methods.
Trait(1) r
s k(2)
CY 0.57*** 0.38
BT 0.35*** 0.34
LRBF 0.69*** 0.54
(1)CY, carcass yield; BT, bacon thickness; and LRBF, backfat thickness
immediately after the last rib in the dorsal-lumbar line. (2)Refers to the
agreement among 10% of the individuals that presented the highest
genomic breeding values predicted by RQR and Blasso. ***Significant
trait. It should be noted that the values for LRBF were higher than those for the other traits and show a greater agreement between the methods in the classification of animals. However, for Cohen’s kappa coefficient, the
level of agreement is still considered weak according to McHugh (2012).
The SNP effects were higher in the RQR models than in Blasso for the three evaluated traits (Figure1).
Moreover, the greater strength of the shrinkage parameter on the estimation of SNP effects in quantile regression allows better discriminating these effects, which improves the definition of important regions for QTL search. The results obtained for RQR are indicative that, for CY, a higher marker effect is observed on chromosome 7. This is in alignment with Sanchez et al. (2014), who identified a significant QTL in Large White pigs for this trait in the same chromosome.
For the trait BT, it is possible to notice that the SNP with the greatest effect was found on chromosome 1 (Figure 1). Rückert & Bennewitz (2010) identified two significant QTLs for this trait on the same chromosome in a wide range of F2 pig populations.
Regarding LRBF, the SNPs with greatest effects were found on chromosomes 1, 4, and 7. Similarly to the present study, a QTL on chromosome 1 was found in a population from a cross between Erhualian and Duroc pigs (Ai et al., 2012), on chromosome 4 in an F2 Iberian
x Meishan pig population (Tomás et al., 2011), and on chromosome 7 in an F2 Pietrain x commercial breed
pig population (Cherel et al.,2011).
Conclusion
Regularized quantile regression has better accuracy than the Bayesian lasso method for the prediction of the genetic merit of pigs for asymmetric variables associated with carcass traits.
Acknowledgments
To Fundação Arthur Bernardes (Funarbe), to Conselho Nacional de Desenvolvimento Científico e Tecnológico (CNPq), to Fundação de Amparo à Pesquisa do Estado de Minas Gerais (Fapemig, APQ 00825), and to Coordenação de Aperfeiçoamento de Pessoal de Nível Superior (Capes), for financial support.
References
ABPA. Associação Brasileira de Proteína Animal. Relatório anual 2016. São Paulo, 2015. 133p. Available at: <http://abpa-br. com.br/storage/files/versao_final_ para_envio_digital_1925a_ f inal_ abpa _ relator io_ anual_ 2016_ por t ug ues_web1.pdf >. Accessed on: June 10 2016.
AI, H.; REN, J.; ZHANG, Z.; MA, J.; GUO, Y.; YANG, B.; HUANG, L. Detection of quantitative trait loci for growth- and fatness-related traits in a large-scale White Duroc × Erhualian
intercross pig population. Animal Genetics, v.43, p.383-391, 2012. DOI: 10.1111/j.1365-2052.2011.02282.x.
ALHAMZAWI, R.; YU, K.; BENOIT, D.F. Bayesian adaptive Lasso quantile regression. Statistical Modelling, v.12, p.279-297, 2012. DOI: 10.1177/1471082X1101200304.
AZEVEDO, C.A.; SILVA, F.F. e; REZENDE, M.D.V. de ; PETERNELLI, L.A.; GUIMARÃES, S.E.F.; LOPES, P.S. Quadrados mínimos parciais uni e multivariado aplicados na seleção genômica para características de carcaça em suínos.
Ciência Rural, v.43, p.1642-1649, 2013. DOI: 10.1590/S0103-84782013000900017.
BARROSO, L.M.A.; NASCIMENTO, M.; NASCIMENTO, A.C.C.; SILVA, F.F.; SERAO, N.V.L.; CRUZ, C.D.; RESENDE, M.D.V.; SILVA, F.L.; AZEVEDO, C.F.; LOPES, P.S.; GUIMARÃES, S.E.F. Regularized quantile regression for SNP marker estimation of pig growth curves. Journal of Animal Science and Biotechnology, v.8, p.1-9, 2017. DOI: 10.1186/ s40104-017-0187-z.
BRASIL. Ministério da Agricultura, Pecuária e Abastecimento. 2014. Available at: <http://www.agricultura.gov. br/animal/especies/suinos>. Accessed on: June 22 2016.
CADE, B.S.; NOON, B.R. A gentle introduction to quantile regression for ecologists. Frontiers in Ecology and the Environment, v.1, p.412-420, 2003. DOI: 10.1890/1540-9295(2003)001[0412:AGITQR]2.0.CO;2.
CHEREL, P.; PIRES, J.; GLÉNISSON, J.; MILAN, D.;
IANNUCCELLI, N.; HÉRAULT, F.; DAMON, M.; LE ROY, P. Joint analysis of quantitative trait loci and major-effect causative mutations affecting meat quality and carcass composition traits in pigs. BMC Genetics, v.12, art.76, 2011. DOI: 10.1186/1471-2156-12-76.
D’AGOSTINO, R.; PEARSON, E.S. Tests for departure from
normality. Empirical Results for the distributions of b2 and √ b1.
Biometrika, v.60, p.613-622, 1973.
DE LOS CAMPOS, G.; NAYA, H.; GIANOLA, D.; CROSSA, J.; LEGARRA, A.; MANFREDI, E.; WEIGEL, K.; COTES, J.M. Predicting quantitative traits with regression models for dense molecular makers and pedigree. Genetics, v.182, p.375-385, 2009. DOI: 10.1534/genetics.109.101501.
DE LOS CAMPOS, G.; RODRIGUEZ, P.P. BGLR: Bayesian generalized linear regression. R package version 1.0.3. 2014.
Available at: <http://CRAN.R-project.org/package=BGLR>.
Accessed on: Mar. 14 2016.
HAO, L.; NAIMAN, D.Q. Quantile regression. New Delhi: Sage publications, 2007. 126p. DOI: 10.4135/9781412985550.
HIDALGO, A.M.; LOPES, P.S.; PAIXÃO, D.M.; SILVA, F.F.; BASTIAANSEN, J.W.M.; PAIVA, S.R.; FARIA, D.A.; GUIMARÃES, S.E.F. Fine mapping and single nucleotide polymorphism effects estimation on pig chromosomes 1, 4, 7, 8, 17 and x. Genetics and Molecular Biology, v.36, p.511-519, 2013. DOI: 10.1590/S1415-47572013000400009.
Received on April 21, 2017 and accepted on November 24, 2017
KOENKER, R.; BASSET JR., G. Regression quantiles.
Econometrica, v.46, p.33-50, 1978. DOI: 10.2307/1913643. LI, Y.; ZHU, J. L1-norm quantile regression. Journal of
Computational and Graphical Statistics, v.17, p.163-185, 2008. DOI: 10.1198/106186008X289155.
MATHUR, P.K.; NAPEL,J. ten; BLOEMHOF, S.; HERES, L.; KNOL, E.F.; MULDER, H.A. A human nose scoring system for boar taint and its relationship with androstenone and skatole. Meat Science, v.91, p.414-422, 2012. DOI: 10.1016/j. meatsci.2012.02.025.
MCHUGH, M.L. Interrater reliability: the kappa statistic.
Biochemical Medicine, v.22, p.276-282, 2012. DOI: 10.11613/ BM.2012.031.
MEUWISSEN, T.H.E.; HAYES, B.J.; GODDARD, M.E. Prediction of total genetic value using genome-wide dense marker maps. Genetics, v.157, p.1819-1829, 2001.
MIAR, Y.; PLASTOW, G.; BRUCE, H.; MOORE, S.; MANAFIAZAR, G.; KEMP, R.; CHARAGU, P.; HUISMAN, A.; VAN HAANDEL, B.; ZHANG, C.; MCKAY, R.; WANG, Z. Genetic and phenotypic correlations between performance traits with meat quality and carcass characteristics in commercial crossbred pigs. PLoS ONE, v.9, e110105, 2014. DOI: 10.1371/ journal.pone.0110105.
NASCIMENTO, M.; SILVA, F.F. e; RESENDE, M.D.V. de; CRUZ, C.D.; NASCIMENTO, A.C.C.; VIANA, J.M.S.; AZEVEDO, C.F.; BARROSO, L.M.A. Regularized quantile regression applied to genome-enabled prediction of quantitative traits. Genetics and Molecular Research, v.16, p.1-12, 2017. DOI: 10.4238/gmr16019538.
PEIXOTO, J. de O.; GUIMARÃES, S.E.F.; LOPES, P.S.; SOARES, M.A.M.; PIRES, A.V.; BARBOSA, M.V.G.; TORRES, R. de A.; SILVA, M. de A. e. Associations of leptin gene polymorphisms with production traits in pigs. Journal of Animal Breeding and Genetics, v.123, p.378-383, 2006. DOI: 10.1111/j.1439-0388.2006.00611.x.
R CORE TEAM. R: a language and environment for statistical computing. Vienna: R Foundation for Statistical Computing, 2017. RESENDE, M.D.V. de; RESENDE JÚNIOR, M.F.R.; AGUIAR, A.M.; ABAD, J.I.M.; MISSIAGGIA, A.A.; SANSALONI, C.; PETROLI, C.; GRATTAPAGLIA, D. Computação da Seleção Genômica Ampla (GWS). Colombo: Embrapa Florestas, 2010. 79p. (Embrapa Florestas. Documentos, 210). Disponível em:
<https://ainfo.cnptia.embrapa.br/digital/bitstream/item/31426/1/ Doc210.pdf>.
RüCKERT, C.; BENNEWITZ, J. Joint QTL analysis of three connected F2-crosses in pigs. Genetics Selection Evolution, v.42, p.1-40, 2010. DOI: 10.1186/1297-9686-42-40.
SANCHEZ, M.-P.; TRIBOUT, T.; IANNUCCELLI, N.; BOUFFAUD, M.; SERVIN, B.; TENGHE, A.; DEHAIS, P.; MULLER, N.; DEL SCHNEIDER, M.P.; MERCAT, M.-J.; ROGEL-GAILLARD, C.; MILAN, D.; BIDANEL, J.-P.; GILBERT, H. A genome-wide association study of production traits in a commercial population of Large White pigs: evidence of haplotypes affecting meat quality. Genetics Selection Evolution, v.46, p.1-12, 2014. DOI: 10.1186/1297-9686-46-12.
SILVA, F.F.; ROSA, G.J.M.; GUIMARÃES, S.E.F.; LOPES, P.S.; CAMPOS, G. de los. Three-step Bayesian factor analysis applied to QTL detection in crosses between outbred pig populations.
Livestock Science, v.142, p.210-215, 2011. DOI: 10.1016/j. livsci.2011.07.012.
TEIXEIRA, F.R.F.; NASCIMENTO, M.; NASCIMENTO, A.C.C.; SILVA, F.F. e; CRUZ, C.D.; AZEVEDO, C.F.; PAIXÃO, D.M.; BARROSO, L.M.A.; VERARDO, L.L.; RESENDE, M.D.V. de; GUIMARÃES, S.E.F.; LOPES, P.S. Factor analysis applied to genome prediction for high-dimensional phenotypes in pigs. Genetics and Molecular Research, v.15, p.1-10, 2016. DOI: 10.4238/gmr.15028231.
TOMáS, A.; RAMíREZ, O.; CASELLAS, J.; MUñOZ, G.; SáNCHEZ A.; BARRAGáN, C.; ARQUÉ, M.; RIART, I.; óVILO, C.; NOGUERA, J.L.; AMILLS, M.; RODRíGUEZ, C. Quantitative trait loci for fatness at growing and reproductive stages in Iberian × Meishan F2 sows. Animal Genetics, v.42, p.548-551, 2011. DOI: 10.1111/j.1365-2052.2010.02169.x.
TUBEROSA, R. Phenotyping for drought tolerance of crops in the genomics era. Frontiers in Physiology, v.3, art.347, p.1-26, 2012. DOI: 10.3389/fphys.2012.00347.
ZANGERONIMO, M.G.; FIALHO, E.T.; LIMA, J.A. de F.; GIRÃO, L.V.C.; AMARAL, N. de O.; SILVEIRA, H. Desempenho e características de carcaça de suínos dos 20 aos 50 kg recebendo rações com reduzido teor de proteína bruta e diferentes níveis de lisina digestível verdadeira. Ciência Rural, v.39, p.1507-1513, 2009. DOI: 10.1590/S0103-84782009005000069.