Scale of satisfaction with teachers
dynamics: development and validation
Cristina Costa-Lobo a,bMarta Abelha a,b
Themys Carvalho b
a Universidade Portucalense, Portugal
b Portucalense Institute for Human Development, Portugal
Recebido em 25 nov. 2016 Aceito em 19 abr. 2017
Abstract
This paper explains the validity and reliability of the Scale of Satisfaction with Teachers Dynamics (ESDTD). The ESDTD evaluates the conceptual representation of teachers with their curriculum conceptions, curriculum development, curriculum management, educational project and collaborative work; also, the satisfaction of teachers with the work done by direction, by sub-departments, through direct coordination and class councils and by heads of educational units. In the inal items of ESDTD, it is assessed the perceptions of teachers about the grouping culture, signaling the aspects considered positive and problematic. It was tested the possibility of making a factor analysis and subsequently assessing the psychometric data and the reliability of each dimension, in order to test the internal validity of the scale. There is evidence of the appropriateness of factor analysis. More speciically, the adequacy measured sample of Kaiser-Meyer-Olkin, and the value of the Bartlett’s sphericity test revealed highly signiicant. It was rated the variance explained by the main components analysis, previously setting the analysis in six factors with values greater than 1. When setting the analysis in six main components, the dimensions explained more than 55% of the total variability. The analysis of the reliability of the size and the assessment of the homogeneity of the items allows obtaining positive and very high internal consistency values for all items and for all of the dimensions. The values found permit to maintain the structure and distribution of initial items. The scale shows good validity and reliability, it is expected other studies to be developed, complementing its psychometric analysis.
1 Introduction
In the lasts decades, there has been a massive access to school in Portugal, with a deep impact in schools. The transformation of the families’ structures, the multicultural diversity and the increase of violence have created a changing reality that forces teachers to change their practices and ways of being. Although there has been a great evolution in Portuguese schools, the national curriculum to which they are tied and the very individualistic work of teachers hind collaboration and a shared thought. Teacher´s interactions are very dependent on the socialization, that is to say, dependent on the integration in the schools they are allocated, which depends on formal and informal aspects. Nevertheless, the informal aspects inluence more in the relationship between teachers and often go farther than formal deinitions, what may have as consequence a distortion of the rolls that end up creating conlicts of diferent types.
higher education is structured in accordance with the principles of the Bologna Declaration and is organized in: University Higher Education that confers the degrees of graduate, master and doctor; and polytechnic higher education that confers the degrees of graduate and master.
The Portuguese educational policies have been based, mainly, in the “equal opportunities” principle. Meanwhile, according to Ferreira and Teixeira (2010, p.347), we are living a period of contradictory events because “more democratic access to higher levels of schooling is parallel with more social inequalities”. To diminish the diferences, sometimes very high, between students coming from diferent socioeconomic and cultural backgrounds, arises in 1996 the irst Educational Territories of Priority Intervention (TEIP), following the ZEP (Priority Educational Areas) created by the French government in 1981. The TEIP were created by the Portuguese Ministry of Education as a way to improve basic schools, based in the equal opportunities idea, with rigor and requirement, combating the social and scholar exclusion, with a criterion of positive discrimination in the allocation of resources, centered mainly in the School Project of each school (BARBIERI, 2003).
in promoting collaboration between schools, social partnership and institutions of current training in the educational territory. This way, the underlying ideology of the TEIP concretes in association with other present entities in the community that school inserts, demanding a hinge of spaces and of resources, developing, simultaneously, the educational and formative paper at the same time that the community development. One of the positive efects of the policy TEIP was to make more visible, legitimate and to positively reinforce practical and innovative initiatives in the construction of the autonomy, through projects of educational action in association with diferent mates at local level, particularly the families of students that take part more actively in specify diferent initiatives.
The teaching career is permanently questioned in its usefulness and in the educational practices and strategies used. According to Abelha, Machado and Costa-Lobo (2014), several studies have shown that, in fact, the teacher’s work remains mostly single and lonely. Collaborative work “implies shared responsibility and relection on the teaching action, a commitment and collective improvement and availability and a critical attitude towards work” (ABELHA, 2011, p. 125). Costa-Lobo (2011) adds that there is only true collaboration in work among peers. This is because all collaborative work is underpinned by the idea that all elements of the working group maintain a relationship of equality with regard to the status and where reciprocity exists and is decisive for “deining the degree of involvement and positive interdependence among individuals” (p. 48). For these reasons, the collaborative cultures give greater professional conidence, which enhances the feeling of self-eicacy among teachers, developing in them the capacity to initiate change. It also ensures that changes do not disappear with one or two individuals who have implemented them, causing the maintenance of the changes over time and permitting efective and lasting modiications (HARGREAVES et al., 2002).
Following studies of several authors (ABELHA, 2011; ABELHA, MACHADO, & COSTA-LOBO, 2014; ALVES FIGUEIREDO, 2011; HARGREAVES, 1998; HARGREAVES, EARL, & RYAN, 2011; HARGREAVES et al., 2002; MILHEIRO, 2013), the Teaching Satisfaction Scale with Educational Work (ESDTD) was built.
Speciically, this work is oriented to the conceptual representation of teachers in the pedagogical ield, namely through the Scale of Satisfaction with Teachers Dynamics. The work is structured in four sections, in the irst, introductory, a brief review of the related literature is presented, followed by another section articulated to the methodological aspects related to the study. The third section exposes the analysis of the data so that, after the discussion is established, the inal conclusions of the article are signaled.
2 Materials and Methods
The initial version of the Scale was submitted to analysis to a panel of 22 experts in school management and administration, for validation of the content. Teachers with postgraduate training and experience in management and school administration with two or more years of service in the area constituted this group. There were also researchers with two or more years of service in the area. It was veriied, among other aspects, if all the questions were understood, if there were unsuitable questions for the information pretended, or repetitive questions, or missing important items, and if they considered the Scale too long or diicult. This procedure allowed, also, to ind out the conditions in which the scale would have to be applied, his graphic quality and the suitability of the instructions that went along with it. This group of 22 professors was encouraged to do observations and suggestions about the structure of the Scale and about each item.
After analyzing the answers and suggestions of the experts, it was created a pilot version that was validated by ten members of the panel that had the required training and experience in school management and school administration. The consensus version took to the Scale of Satisfaction with Teachers Dynamics (ESDTD). In order to validate the clarity and understanding of items and to identify diiculties in illing it in, it was made a pre-test with 12 subjects not included in the study. The analysis of the psychometric properties of the Scale was made in a second time after the positive appraisal of the Ethics Committee and the authorization of Administrations of the involved schools. The data collection occurred at 4 Portuguese schools, between January 2015 and May 2015, covering 498 teachers of Portuguese public (55.9%) and private (44.1%) schools.
The guarantee of conidentiality for the data and the anonymity of respondents was assured. The sample size took into account the recommendations for the further factorial analysis of principal components proposed by Pestana and Gajeiro (2005).
Teachers who voluntarily wanted to take part in the study composed the sample. Specifically, teachers between 25 and 61 years old with an age average of 42.4 ± 13.13 years and a median of 43 years. The most represented age group was 41 or older (59.0%) and the least represented group was younger than 28 years (7.5%). The participants were predominantly male (52.0%), married or living in de facto union (65.2%), followed by single (13.8%). Concerning to education, most had the bachelor’s degree (58.5%) having 41.5% upper studies.
The information collected was submitted to statistical analysis, with the support of SPSS calculation software tool (Statistical Package for Social Sciences), version 22. The originated items would establish six diferent dimensions, being previously established which items would make up each dimension.
The ESDTD had only four possible answers per item, using the ordinal scale of 1 (Strongly Disagree) to 4 (Strongly Agree) to simplify answering and prevent “the temptation” of the middle position, neither agree nor disagree. Scale part I intended to evaluate personal and professional characteristics of respondents. In ESDTD part II was evaluated conceptual representation of the teachers with regard to their curriculum conceptions, curriculum development, curriculum management, projects work and collaborative work. The ESDTD part III aimed to assess the teaching work dynamics, considering the teachers’ perception about the work done by the direction, by sub-departments and the year of coordination, the class councils and the heads of the leadership of courses, and aimed to assess the perceptions of these teachers about the grouping culture, its positive aspects and its problems.
3 Results
The analyses that were made are described below. The appropriateness of factor analysis test, more speciically the adequacy of the sample, was tested by the Kaiser-Meyer-Olkin (KMO) test. Another criterion was the variance explained by the main components, settled in 6 factors with eigenvalues greater than 1. After, it was necessary to complement the analysis by examining the reliability of the size and by assessing the homogeneity of items of each of the sub-scales of this instrument.
Likewise, it was found as shown in Table 1, that the value of Bartlett’s sphericity test is highly signiicant, conirming that performing factor analysis would be perfectly appropriate.
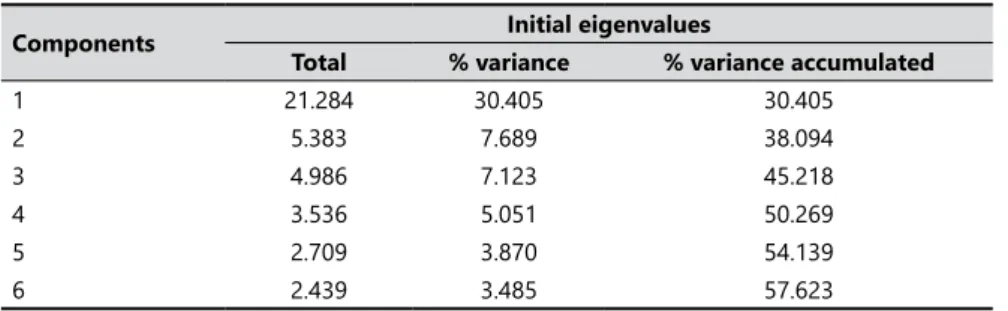
Another criterion was rating the variance explained by the principal components analysis, previously setting the analysis in 6 factors with eigenvalues greater than 1 (factors with eigenvalue - eigenvalue - less than 1 - criterion Keiser). Thus, it was found that, by proceeding to the ixing of the analysis to the 6 theoretical dimensions, these factors are presented as suicient to group items and to meet one of the criteria for the validity of factor analysis - the percentage of variance explained by factors retained must be at least 40% (LISBOA, AUGUSTO, & FERREIRA, 2012). Thus, by setting the analysis in getting six main components, as shown in Table 2, the six dimensions explained a percentage quite positive of total variability.
After conirming that completion of factor analysis was adequate, it was necessary to complement the analysis by examining the reliability of the size and assessing the homogeneity of items. I.e. advanced to the veriication of internal consistency using the alpha Cronbach, and hoping for values greater than 0.7, value set by Lisboa, Augusto, and Ferreira (2012), as the reference value for the internal consistency would be considered quite acceptable.
Table 1. Values of KMO test and Bartlett’s sphericity test.
Kaiser-Meyer-Olkinmeasure of sampling adequacy .629 Bartlett’s Test of Sphericity
Approx. Chi-Square 6.558.120
Df 241
Sig. .000
Source: Produced by the authors (2016).
Table 2. ESDTD dimensions- total variance explained.
Components Initial eigenvalues
Total % variance % variance accumulated
1 21.284 30.405 30.405
2 5.383 7.689 38.094
3 4.986 7.123 45.218
4 3.536 5.051 50.269
5 2.709 3.870 54.139
6 2.439 3.485 57.623
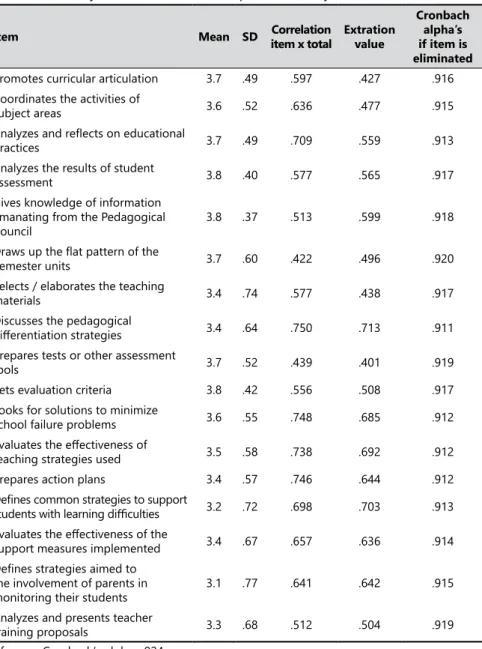
The dimension of satisfaction with the Sub Department and Year Coordination consists of seventeen items, and the whole dimension, as expressed in Table 4, shows a very high internal consistency. In this dimension, in Table 4, there is the item “discusses the pedagogic diferentiation strategy” and the item “Deines common strategies to support students with learning diiculties”. In turn, the item with less weight on the scale is what refers to “Elaborates tests or other assessment tools”.
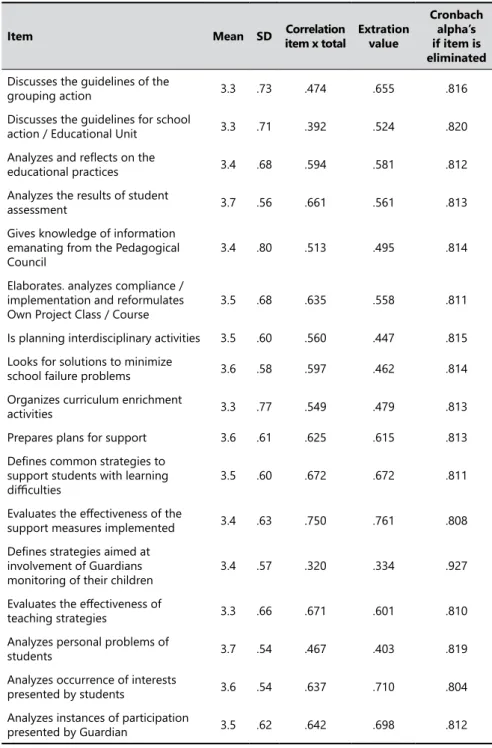
The dimension of satisfaction with the dynamics of the Class and with directors of educational units includes nineteen items, and according with the values obtained and shown in Table 5, it appears that none of them have very strong reasons to be eliminated.
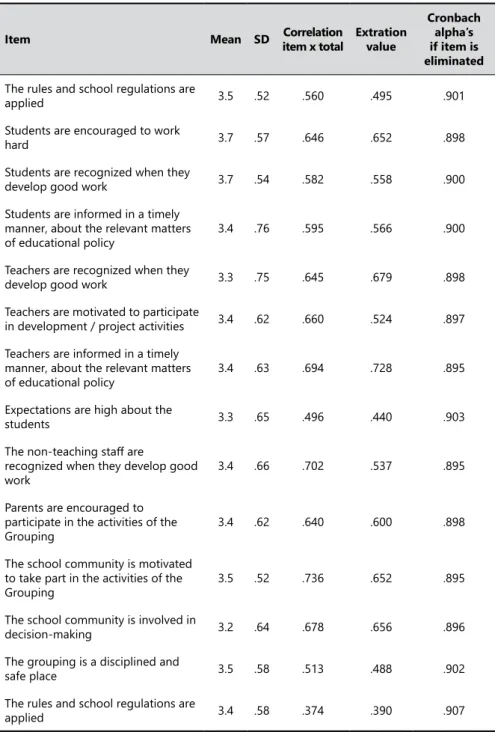
Regarding the dimension of satisfaction with the Grouping Culture, analyzed in Table 6, and that consists of fourteen items, it appears very high internal consistency was reached.
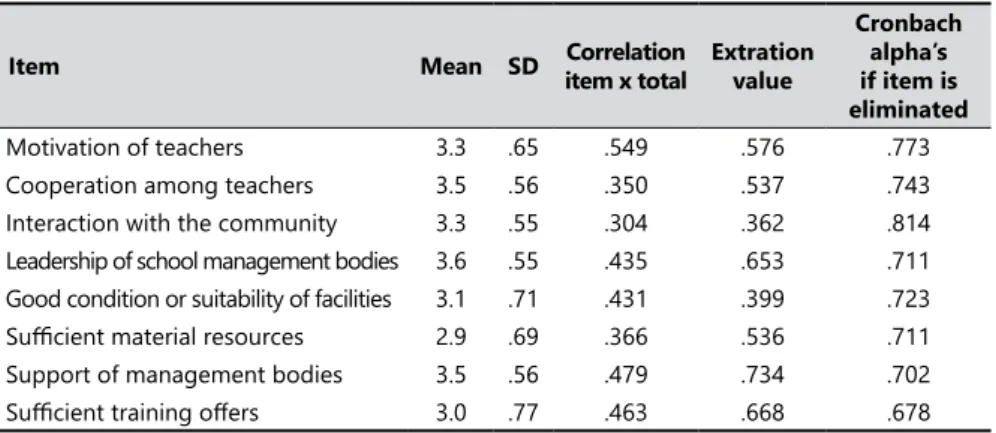
Regarding the identiication of positives aspects of educational environment, exposed in Table 7, the dimension consists of eight items. The Cronbach’s Alpha is somewhat lower than in the previous dimensions, but still acceptable, at high internal consistency level.
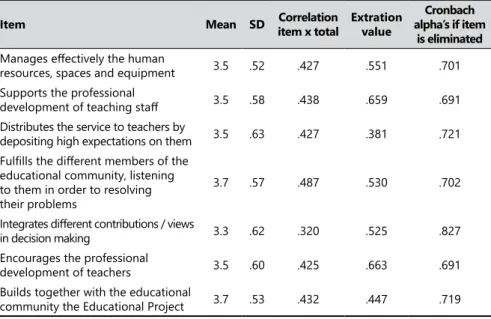
Table 3. Reliability satisfaction with direction.
Item Mean SD Correlation
item x total
Extration value
Cronbach alpha’s if item
is eliminated Manages efectively the human
resources, spaces and equipment 3.5 .52 .427 .551 .701 Supports the professional
development of teaching staf 3.5 .58 .438 .659 .691 Distributes the service to teachers by
depositing high expectations on them 3.5 .63 .427 .381 .721 Fulills the diferent members of the
educational community, listening to them in order to resolving their problems
3.7 .57 .487 .530 .702
Integrates diferent contributions / views
in decision making 3.3 .62 .320 .525 .827
Encourages the professional
development of teachers 3.5 .60 .425 .663 .691 Builds together with the educational
community the Educational Project 3.7 .53 .432 .447 .719 Reference Cronbach’s alpha=.799.
Table 8 shows the degree of reliability regarding the inal dimension presented in the survey, which concerns the identiication of grouping problems. It reached very high internal consistency.
Table 4. Reliability satisfaction with sub department and year coordination.
Item Mean SD Correlation
item x total
Extration value
Cronbach alpha’s if item is eliminated
Promotes curricular articulation 3.7 .49 .597 .427 .916 Coordinates the activities of
subject areas 3.6 .52 .636 .477 .915
Analyzes and relects on educational
practices 3.7 .49 .709 .559 .913
Analyzes the results of student
assessment 3.8 .40 .577 .565 .917
Gives knowledge of information emanating from the Pedagogical Council
3.8 .37 .513 .599 .918
Draws up the lat pattern of the
Semester units 3.7 .60 .422 .496 .920
Selects / elaborates the teaching
materials 3.4 .74 .577 .438 .917
Discusses the pedagogical
diferentiation strategies 3.4 .64 .750 .713 .911 Prepares tests or other assessment
tools 3.7 .52 .439 .401 .919
Sets evaluation criteria 3.8 .42 .556 .508 .917 Looks for solutions to minimize
school failure problems 3.6 .55 .748 .685 .912 Evaluates the efectiveness of
teaching strategies used 3.5 .58 .738 .692 .912
Prepares action plans 3.4 .57 .746 .644 .912 Deines common strategies to support
students with learning diiculties 3.2 .72 .698 .703 .913 Evaluates the efectiveness of the
support measures implemented 3.4 .67 .657 .636 .914 Deines strategies aimed to
the involvement of parents in monitoring their students
3.1 .77 .641 .642 .915
Analyzes and presents teacher
training proposals 3.3 .68 .512 .504 .919
Table 5. Reliability satisfaction with class councils and boards of curriculum units.
Item Mean SD Correlation
item x total
Extration value
Cronbach alpha’s if item is eliminated
Discusses the guidelines of the
grouping action 3.3 .73 .474 .655 .816
Discusses the guidelines for school
action / Educational Unit 3.3 .71 .392 .524 .820 Analyzes and relects on the
educational practices 3.4 .68 .594 .581 .812
Analyzes the results of student
assessment 3.7 .56 .661 .561 .813
Gives knowledge of information emanating from the Pedagogical Council
3.4 .80 .513 .495 .814
Elaborates. analyzes compliance / implementation and reformulates
Own Project Class / Course 3.5 .68 .635 .558 .811 Is planning interdisciplinary activities 3.5 .60 .560 .447 .815
Looks for solutions to minimize
school failure problems 3.6 .58 .597 .462 .814
Organizes curriculum enrichment
activities 3.3 .77 .549 .479 .813
Prepares plans for support 3.6 .61 .625 .615 .813 Deines common strategies to
support students with learning
diiculties 3.5 .60 .672 .672 .811
Evaluates the efectiveness of the
support measures implemented 3.4 .63 .750 .761 .808 Deines strategies aimed at
involvement of Guardians monitoring of their children
3.4 .57 .320 .334 .927
Evaluates the efectiveness of
teaching strategies 3.3 .66 .671 .601 .810
Analyzes personal problems of
students 3.7 .54 .467 .403 .819
Analyzes occurrence of interests
presented by students 3.6 .54 .637 .710 .804
Analyzes instances of participation
presented by Guardian 3.5 .62 .642 .698 .812
Table 6. Reliability satisfaction with the culture.
Item Mean SD Correlation
item x total
Extration value
Cronbach alpha’s if item is eliminated
The rules and school regulations are
applied 3.5 .52 .560 .495 .901
Students are encouraged to work
hard 3.7 .57 .646 .652 .898
Students are recognized when they
develop good work 3.7 .54 .582 .558 .900
Students are informed in a timely manner, about the relevant matters of educational policy
3.4 .76 .595 .566 .900
Teachers are recognized when they
develop good work 3.3 .75 .645 .679 .898
Teachers are motivated to participate
in development / project activities 3.4 .62 .660 .524 .897
Teachers are informed in a timely manner, about the relevant matters of educational policy
3.4 .63 .694 .728 .895
Expectations are high about the
students 3.3 .65 .496 .440 .903
The non-teaching staf are
recognized when they develop good work
3.4 .66 .702 .537 .895
Parents are encouraged to participate in the activities of the Grouping
3.4 .62 .640 .600 .898
The school community is motivated to take part in the activities of the Grouping
3.5 .52 .736 .652 .895
The school community is involved in
decision-making 3.2 .64 .678 .656 .896
The grouping is a disciplined and
safe place 3.5 .58 .513 .488 .902
The rules and school regulations are
applied 3.4 .58 .374 .390 .907
4 Discussion
By analyzing the items, it can be seen that all of them have a positive correlation value with the total (between 0.320 and 0.487) and very acceptable extraction values indicates when treating items with favorable factor weight to dimension - for some authors is acceptable when it is less than 0.400 (PESTANA; GAGEIRO, 2005). Similarly, it appears that the internal consistency of the size would decrease if these items were removed. There is, however, an item with lower values: “integrates diferent contributions / views in decision making”. If it is eliminated, the reliability of the scale increases slightly (to 0.827); but since the correlation value and extraction
Table 7. Reliability of positive aspects identiication of the educational environment.
Item Mean SD Correlation
item x total
Extration value
Cronbach alpha’s if item is eliminated Motivation of teachers 3.3 .65 .549 .576 .773 Cooperation among teachers 3.5 .56 .350 .537 .743 Interaction with the community 3.3 .55 .304 .362 .814 Leadership of school management bodies 3.6 .55 .435 .653 .711 Good condition or suitability of facilities 3.1 .71 .431 .399 .723 Suicient material resources 2.9 .69 .366 .536 .711 Support of management bodies 3.5 .56 .479 .734 .702 Suicient training ofers 3.0 .77 .463 .668 .678 Reference Cronbach’s alpha=.799.
Source: Produced by the authors (2016).
Table 8. Reliability of negative aspects identiication of the educational environment.
Item Mean SD Correlation
item x total
Extration value
Cronbach alpha’s if item is eliminated Demotivation of teachers 2.3 1.05 .599 .604 .934 Lack of collaboration among teachers 1.9 .93 .759 .841 .898 Lack of interaction with the
community Grouping 1.9 .91 .825 .882 .885
Lack of leadership of school
management bodies 1.8 .97 .857 .897 .877
Insuicient support of the
management bodies 1.8 .91 .888 .911 .872
are acceptable (0.320 and 0.525 respectively), it was decided to keep the item in the dimension structure. A very high internal consistency is observed in Table 4, all items obtained correlation values item x total more than 0,400, and extracting values ranging between 0.401 and 0.713; also all items to attend to a decrease in internal consistency subscale if the item was deleted. The internal consistency of the dimension of satisfaction with the dynamics of the Class and with directors of educational units is quite high, Alpha Cronbach’s 0.925. It seems that only in one of the situations the consistency would be slightly higher if the item were deleted; it speciically mentions the item “Set strategies aimed at involvement of Guardians monitoring of their children “(would rise to 0.927). However, as the correlation and extraction values are admissible (0.320 and 0.334), and increased internal consistency would not be very signiicant, we believe that item can be kept in the initial structure of the scale. In this group of problematic items, in Table 5, stands out the item “evaluates the efectiveness of the implemented support measures”, because it has a very strong correlative value (0.750) and a very high factor weight (0.761). The same happens with the item “analyzes occurrence of interests submitted by students “(0.637 and 0.710 respectively). After that, there are items where there would be the greatest decrease in Alpha Cronbach’s if they were eliminated; regarding dimension of satisfaction with the Grouping Culture, almost all items internal consistency decreases slightly if the item is deleted. For one of them, Alpha remains the same maintaining or not the item; this is the same item that presented the lower weight factor (“the rules and school regulations are applied” = 0.374 and 0.390, respectively). In other items, the correlation and extraction values are quite signiicant, showing a strong association between the items and the total size. Regarding the identiication Aspects Grouping positives there is the item “Grouping Interaction with the community” that has correlational values and lower extraction (0.304 and 0.362); the internal consistency increases if the item is eliminated from dimension. However, this is not a signiicant rise to alter the reliability of the dimension, and the values obtained are not considered fully unacceptable, so that it will maintain the integrated item in the dimension. The last dimension, related to the Grouping Problem Identiication and covering 5 items, has a very high alpha of 0.917, and it appears that if the item “Lack of motivation of teachers” is eliminated, the internal consistency of the scale surface increases (0.934). However, the values of correlation and extraction of this item are high enough to justify maintaining the item subscale, so it will not change its original structure.
The school organization still does not favor teamwork, so it should be questioned the traditional forms with a view to a reorganization that will allow and encourage critical relection, sharing of experiences and teaching practices. Unfortunately, the national curriculum to which they are subject and the individualistic work to which teachers are accustomed, hinder collaboration and shared relection. In this type of work, which should be dynamic, lively and creative, it is necessary sometimes to stop, relect and decide the best way forward and make the necessary adjustments. To know how to manage the diference can be considered another embarrassment because each participant has his own goals and priorities that sometimes may hit with the goals and priorities of other persons. Thus, if the characteristics of each individual, the diferent ways of working and the relationship between the members of the working group are not handled well, they can be an impediment for the suitable functioning of the collaborative work.
Escala de Satisfação com a Dinâmica de Trabalho
Docente: Desenvolvimento e Validação
Resumo
Este artigo explica os procedimentos de estudo de validade e de confiabilidade da Escala de Satisfação com a Dinâmica de Trabalho Docente (ESDTD). A ESDTD avalia a representação conceptual dos professores em relação às suas concepções de currículo, ao desenvolvimento curricular, à gestão curricular, ao projeto e ao trabalho colaborativo; a satisfação dos professores em relação ao trabalho realizado pela direção, pelos sub-departamentos, pela coordenação direta, pelos conselhos de turma e pelos responsáveis
de unidades educacionais. Nos itens inais da ESDTD, são avaliadas as percepções
dos professores sobre a cultura de agrupamento, sinalizando os aspectos considerados positivos e considerados problemáticos. Foi testada a possibilidade de realizar uma
análise fatorial e posteriormente avaliar os dados psicométricos e a coniabilidade de
cada dimensão, para testar a validade interna da escala. Há evidências da adequação
da análise fatorial, mais especiicamente da pertinência da prova de Kaiser-Meyer-Olkin
e do teste de esfericidade de Bartlett. Foi avaliada a variância explicada pela análise de
componentes principais, deinindo previamente a análise em seis fatores, com valores próprios superiores a 1. Ao deinir seis componentes principais, as dimensões explicaram mais de 55% da variabilidade total. A análise da coniabilidade do tamanho e a avaliação
da homogeneidade dos itens permitem obter valores de consistência interna muito
elevados para todos os itens e para todas as dimensões. Os valores encontrados foram
adequados para manter a estrutura e a distribuição dos itens iniciais. A escala mostra
bons níveis de validade e de coniabilidade. Antecipa-se a utilidade de outros estudos
serem desenvolvidos, complementando a sua análise psicométrica.
Palavras-chave: Dinâmica docente; Satisfação de Docentes; Escala; Validade;
Escala de Satisfacción con la Dinámica de trabajo
Docente: Desarrollo y Validación
Resumen
Este artículo explica los procedimientos de análisis de la validez y iabilidad de la
Escala de Satisfacción con la Dinámica de Trabajo Docente (ESDTD). La ESDTD evalúa la representación de los maestros con respecto a sus concepciones curriculares,
desarrollo curricular, gestión curricular, proyecto educativo y trabajo colaborativo,
así como la satisfacción de los maestros respecto al trabajo realizado por la dirección,
los sub-departamentos, la coordinación directa, los consejos de clase y los jefes de las unidades educativas. En los ítems inales de la ESDTD se evalúan las percepciones
de los profesores sobre la cultura de agrupamiento escolar, señalando los aspectos
considerados positivos y los considerados problemáticos. Se testó la posibilidad de realizar un análisis factorial y posteriormente se evaluaron los datos psicométricos y la iabilidad de cada dimensión, para probar la validez interna de la escala. Hay evidencias de la adecuación del análisis factorial, más especíicamente de la signiicatividad de la prueba Kaiser-Meyer-Olkin y del valor de la prueba de esfericidad de Bartlett, que revelaron ser altamente signiicativas. Se evaluó la varianza explicada por el análisis de componentes
principales, estableciendo previamente el análisis en seis factores con valores propios
mayores a 1. Al establecer el análisis en seis componentes principales, las dimensiones explicaron más del 55% de la variabilidad total. El análisis de la iabilidad del tamaño y la evaluación de la homogeneidad de los ítems permiten obtener valores positivos de consistencia interna muy altos para todos los elementos y para todas las dimensiones. Los valores encontrados son acordes con el mantenimiento de la estructura y distribución de los ítems iniciales. La escala muestra buena validez y iabilidad. Se espera que se
desarrollen otros estudios, complementando los análisis psicométricos.
References
ABELHA, M. C. L. Trabalho colaborativo docente na gestão do currículo do Ensino Básico: do discurso às práticas. 2011. 927 f. Tese (Doutorado em Didática) — Universidade de Aveiro, Aveiro, 2011
ABELHA, M.; MACHADO, E.; COSTA-LOBO, C. Colaboração
docente em contexto educativo angolano: potencialidades e constrangimentos. In: ENCONTRO LUSO-BRASILEIRO SOBRE O TRABALHO DOCENTE E FORMAÇÃO, 2., Porto, 2014. Atas... Porto: Universidade do Porto, 2014. p. 5368-80.
ALVES, P.; FIGUEIREDO, L. A avaliação de desempenho docente: quanto vale o que fazemos? Educação, Sociedade & Culturas, Porto, n. 33, p. 123-40, 2011.
BARBIERI, H. Os TEIP, o projecto educativo e a emergência de ‘peris de território’. Educação, Sociedade & Culturas, v. 20, p. 43-75. 2003.
COSTA LOBO, C. Abordagem sociocognitiva do ajustamento à carreira no ensino superior: o papel das atividades em grupo, da autoeicácia e dos interesses. 2011. 194 f.Tese (Doutorado em Psicologia) — Escola de Psicologia, Universidade do Minho. Braga, 2011.
FERREIRA, I.; TEIXEIRA, A. R. Territórios educativos de intervenção prioritária: breve balanço e novas questões. Sociologia, v. 20, p. 331-50, 2010.
HARGREAVES, A. Os professores em tempos de mudança. 4. ed. Lisboa: Mc Graw-Hill, 1998.
HARGREAVES, A. et al. Aprendendo a mudar: o ensino para além dos conteúdos e da padronização. Porto Alegre: Artmed, 2002.
HARGREAVES, A.; EARL, L. M.; RYAN, J. O. Educação para a mudança: reinventar a escola para os jovens adolescentes. 10. ed. Porto: Porto Editora, 2001. (ciências da educação; século XXI, 11).
LISBOA, J. V; AUGUSTO, M. G.; FERREIRA, P. L. Estatística aplicada à gestão. Lisboa: Vida Económica Editorial S.A. 2012.
Informações dos autores
Cristina Costa-Lobo: Doutorada, Portucalense Institute for Human Development,
Universidade Portucalense, Portugal. Investigadora auxiliar, Docente e Diretora do Departamento de Psicologia e Educação. Contato: [email protected]
Marta Abelha: Doutorada, Portucalense Institute for Human Development, Universidade
Portucalense e CEIS20, Universidade de Coimbra, Portugal. Investigadora auxiliar e Docente. Contato: [email protected]
Themys Carvalho: Doutoranda, Portucalense Institute for Human Development, Portugal.
Investigadora assistente. Contato: [email protected]