Introduction
5-Nitroimidazoles, such as metronidazole, are extensively used as antiamoebic, antiproto-zoal and antibacterial drugs. The discovery of the antibacterial and antitrichomonal properties of the antibiotic azomycin led to the investigation of nitroimidazoles as antiparasitic agents [1, 2]. The discovery of the antitrichomonal properties of metronidazole revolutionized the treatment of disease. Although the amoebicidal properties of metronidazole were studied, it was not clinically tested until some years later. In laboratory tests, metronidazole is effective against intestinal
www.scielo.br/eq www.ecletica.iq.unesp.br
Volume 33, número 4, 2008
Spectrophotometric determination of metronidazole
through Schiff’s base system using vanillin and PDAB
reagents in pharmaceutical preparations
K. Siddappa*, M. Mallikarjun, P. T. Reddy and M. Tambe
Department of Studies and Research in Chemistry Gulbarga University, Gulbarga-585 106, India
Abstract: Two simple sensitive and reproducible spectrophotometric methods have been developed for the determination of metronidazole either in pure form or in their tablets. The proposed methods are based on the reduction of the nitro group to amino group of the drug. The reduction of metronida-zole was carried out with zinc powder and 5 N hydrochloric acid at room temperature in methanol. The resulting amine was then subjected to a condensation reaction with aromatic aldehyde namely, vanillin and p-dimethyl amino benzaldehyde (PDAB) to yield yellow colored Schiff’s bases. The formed Schiff’s bases are quantified spectrophotometrically at their absorption maxima at 422 nm for vanillin and 494 nm for PDAB. Beer’s law was obeyed in the concentration ranges 10 to 65 µg mL-1 and 5 to 40 µg mL-1 with a limit of detection (LOD) of 0.080 µg mL-1 and 0.090 µg mL-1 for vanillin and PDAB, respectively. The mean percentage recoveries were found to be 100.05 ± 0.37 and 99.01 ± 0.76 for the two methods respectively. The proposed methods were successfully applied to determine the metronidazole in their tablet formulations and the results compared favorably to that of reference meth-ods. The proposed methods are recommended for quality control and routine analysis.
Keywords:spectrophotometry; vanillin; PDAB; metronidazole; pharmaceutical analysis.
amoebiasis in rats and hepatic amoebiasis in hamsters and is also active against Entamoeba histolytica in vitro [3, 4]. The initial clinical tests of metronidazole indicated that it was capable of curing invasive amoebic dysentery and amoebic liver abscess [5] Subsequent clinical tests have established metronidazole as the drug of choice in the treatment of all forms of amoebiasis in humans[6, 7].
metronidazole. British Pharmacopoeia [9] descri-bes potentiometric and non-aqueous titration meth-ods using perchloric acid as titrant. United States Pharmacopoeia [10] describes HPLC and non-aqueous titration methods for the assay of metron-idazole. Visible spectrophotometry, because of sim-plicity and cost effectiveness, sensitivity and selec-tivity, and fair accuracy and precision, has remained competitive in an era chromatographic techniques for pharmaceutical analysis. Several methods have been reported for the determination of metronidazole, including spectrophotometry [11, 13], polarography [14]. Most of the spectrophoto-metric methods found in the literature for the deter-mination of metronidazole in the visible region involve initial reduction by treatment with Zinc powder and HCl [15, 22] followed by the diazoti-zation and coupling of the resulting amine. All these methods are less sensitive, involve tedious procedures such as heating and extraction, utilize costly reagents and involve an additional diazotiza-tion step. In the present study, two spectrophoto-metric methods for the quantitative estimation of metronidazole have been developed after convert-ing it to its reduced form by usconvert-ing zinc powder and HCl, as well as the reaction of its reduced product with vanillin and PDAB was studied to establish the optimum reaction conditions, optical character-istics, precision and accuracy of the proposed meth-ods. The methods are simple, rapid, sensitive and are successfully applied to determine the metron-idazole in their pharmaceutical formulations. Furthermore, they do not need costly instrumenta-tion required for published HPLC methods.
Experimental details
Apparatus
An Elico model SL 164 UV-Visible dou-ble beam spectrophotometer with 1 cm matched quartz cell was used for recording spectra and absorbance measurements.
Reagents
All reagents used were of analytical grade and were obtained from Qualigens fine chemi-cals, Mumbai. Metronidazole was kindly sup-plied by Sarabhai Pharmaceuticals Ltd., Baroda,
India. Metronidazole tablets were purchased from a local market. Distilled water was used for the preparation of HCl solution.
Sample preparation
Mehanolic solution of vanillin (4%) and PDAB (3%) was prepared by dissolving 3 and 4 g in a 100 mL volumetric flask containing methanol. A 5 N HCl was prepared by dissolving 43.1 mL of concentrated hydrochloric acid and was diluted to 100 mL with water.
Reduction of the nitro group and preparation of standard drug solution
About 100 mg of metronidazol pure or equivalent tablet powder was accurately weighed and dissolved in 20 mL of methanol. The methanolic solution of metronidazole was treated with 10 mL of 5 N Hydrochloric acid and 0.5 g of zinc powder was added in portions while shaking. After standing for 1hour at room temperature, the solution was filtered using a Whatman filter paper No 41 filter paper to remove the insoluble matter. The residue was washed with 10 mL por-tions of methanol three times, and the total vol-ume of the filtrate was made up to 100 mL with methanol. The final working standard solution of reduced metronidazole containing 100 µg mL-1 was prepared by further dilution.
General procedure
Method A
Method B
In method B, fresh aliquots (0.5- 4.0 mL) of standard 100 µg mL-1reduced metronidazole solution were accurately measured and trans-ferred in to a series of 10 mL volumetric flasks by means of a micro burette. To each of the above aliquots, 0.5 mL of 3% (w/v) of PDAB solution in methanol prepared above were added and mixed thoroughly, and then the solution was heated in a water bath at 60-70°C for 15 min, and cooled to room temp. After cooling, the volume was brought up to the mark with methanol, mixed well and the absorbance of each yellow colored species was measured after 10 min. at 494 nm against reagent blank. A calibration graph was constructed by plotting the absorbance against the concentration of the drug.
Assay procedure
Twenty tablets of metronidazole were pow-dered. An accurate quantity of powder equivalent to 100 mg of metronidazole was weighed. The reduc-tion of metronidazole was carried out by using hydrochloric acid and zinc powder. The resulting filtrate was transferred to a 100 ml volumetric flask and made up to the mark with methanol and an aliquot of this solution was treated as described above for the determination of metronidazole. The amount of metronidazole present in the sample was computed from calibration curve.
Results and discussion
Determination of absorption maximum
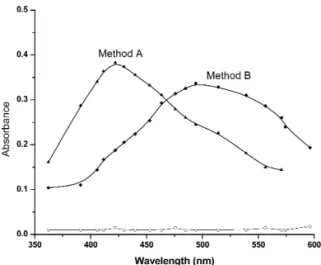
Reduced metronidazole when treated with vanillin and PDAB form a yellow product (Schiff’s base) in acidic medium. To determine the absorp-tion maxima, 35 µg mL-1 (Method A) and 15 µg mL-1 (Method B) of the metronidazole was added in a 10 mL volumetric flasks. Then each drug solu-tion was reacted with 2.0 mL vanillin (4%) and 0.5 mL PDAB (3%). The solution was heated in a water bath at 60-70°C for 15 min. After cooling, the volume was brought up to the mark with methanol and mixed well After 10 min., absorption spectra were taken against reagent blank in the range 350-650 nm. The maximum absorption wavelength for metronidazole was found to be 422
nm for method A and 494 nm for method B. The absorption spectrums of the colored product against reagent blank of both the methods are shown in Figure 1. Under the experimental condi-tions each colorless reagent blank showed a negli-gible absorbance at the corresponding λmax.
Figure 1. Absorption spectra of Metronidazole
(35mg mL-1) with vanillin and Metronidazole
(15mg mL-1) with PDAB against reagent blank.
Reaction Sequence
Scheme 1. The proposed reactions involved in formation of colored Schiff’s bases in acidic medium.
measured at 422 and 494 nm., it was found that 2.0 mL of 4% vanillin solution for method A and 0.5 mL of 3% PDAB for method B was optimal for the formation of color with maximum intensi-ty. Therefore, 2.0 mL of 4% vanillin and 0.5 mL of 3% PDAB were selected for all measurements.
After optimization of chemical variables, the influence of temperature on the colored prod-uct was studied at different temperature (50-80 0C); it was observed that the obtained colored
product were stable up to 700C. However, no considerable improvements were occurred above 800C therefore 60-700C was selected as optimum temperature for both the methods.
Optical characteristics and validation of the method
Optical characteristics such as Beer’s law limits, molar absorptivity and Sandell’s sensitivity, for metronidazole, are given in Table 1. Data of the regression analysis using the least squares method made for the calibration curves are also given in the same table. The accuracy and precision of the method were checked by analyzing six replicate samples within the Beer’s law range containing the same amount of each drug. The lower values of RSD indicate the good precision and reproducibili-ty of the method. The validireproducibili-ty of the proposed
pro-Determination of effective reagents concentration
cedure for the determination of metronidazole in their pure state was checked by analyzing this drug using the proposed method. The results obtained for pure drug were reproducible with low relative stan-dard deviations (RSD). The limit of quantification (LOQ) was determined by taking the ratio of the standard deviation (SD) of the blank with respect to water and the slope of the calibration curve multi-plied by the factor ten. This means that LOQ is
approximately four times greater than LOD. LOD is well below the lower limit of the Beer’s law range.
Applicability of the method
The applicability of the proposed spec-trophotometric methods for the assay of metron-idazole was tested by analyzing various available commercial formulations. The samples were also analyzed using the official method. The results given in Table 2 of the analysis showed that the data are consistent with the label claim of the for-mulations. The calibration curves showed a linear response over the concentration ranges used in the general procedures as shown in Figures 2 and 3. The RSD values for the reproducibility and recov-ery studies show that the method is precise and accurate. In addition it is observed that there is no interference (Table 3) from the excipients used in the formulations. Hence, this method can be adopted for the routine quality control of metron-idazole in bulk as well as in formulations.
Table 1.Analytical parameters of
spectrophotomet-ric methods.
Parameters
λmax (nm)
Beer’s Law limits (µg mL-1) Molar absorptivity (L mol-1 cm-1)
Sandell’s sensitivity (µg mL-1) Regression equation** (Y = bx + c)
Slope(b) Intercept(c)
Correlation coefficient ( r ) % Relative Standard Deviation (R.S.D)* % Range of error (Confidence)* 0.05 level 0.01 level
Limit of Detection (µg mL-1) Limit of Quantification (µg mL-1)
Stability (hr.) Color
Method A
422 10-65
1.775 x 10⁴ 0.0096 0.1027 0.0010 0.9997 0.2169 0.0086 0.00125 0.0800 0.3160 2 yellow Method B 494 5-40
0.3505 x 10⁴ 0.0488 0.1866 0.0439 0.9998 0.2561 0.0010 0.0014 0.0900 0.2997 2 yellow
**Y = bX+c, where Y is the absorbance and X is the concentration of drug in µg mL-1.
*Average of six determinations.
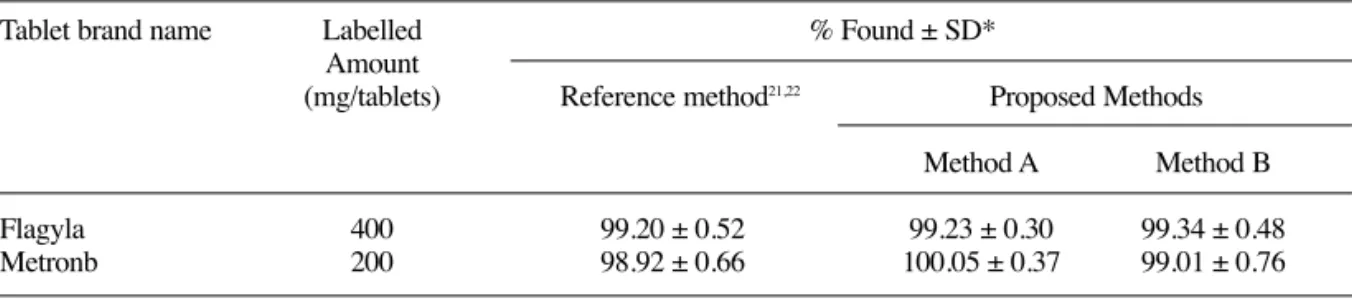
Table 2.Determination of Metronidazole in Formulations by the Proposed and Reference Method.
Tablet brand name Labelled % Found ± SD*
Amount
(mg/tablets) Reference method21,22 Proposed Methods
Method A Method B
Flagyla 400 99.20 ± 0.52 99.23 ± 0.30 99.34 ± 0.48
Metronb 200 98.92 ± 0.66 100.05 ± 0.37 99.01 ± 0.76
*Average of six determinations ± SD Marketed by Nicholas Piramalaand Alkemb
Table 3. Determination of Metronidazolea in the
presence of excipients.
Excipients Glucose Sucrose Lactose Dextrose Talc Starch Sodium alginate Amount taken (µg mL-1)
20 20 25 20 25 20 15
% Recovery + %RSDb
99.5 + 0.54 99.47 + 0.25 99.64 + 0.56 100.1 + 0.21 98.96 + 0.82 99.20 + 0.38 100.25 + 0.64
Conclusions
The proposed spectrophotometric meth-ods for the determination of metronidazole are simple, accurate, precise and cheap. The statisti-cal analyses show that the data from the proposed method are in good agreement with those of the reported methods. The color reaction does not require stringent conditions nor any specific reagent or buffer. The colored species was stable for more than two hours, which is sufficient time for the analyst to perform the analysis. Moreover they do not require any pretreatment of the drug and tedious extraction procedure. Hence, the data presented in the manuscript by spectrophotomet-ric methods for the determination of metronida-zole in its pure and dosage form demonstrate that the proposed methods are accurate, precise and linear. Thus it can be extended for routine analy-sis of metronidazole in pharmaceutical indus-tries, hospitals and research laboratories.
Acknowledgements
The authors are grateful to Sarabhai Pharmaceutical Ltd., India, for providing gift sam-ple of Metronidazole drug and Principal, H.K.E Society’s College of Pharmacy, Gulbarga for pro-viding library and other necessary facilities.
Thanks are also to the Professor and Chairman, Department of Studies and Research in Chemistry, Gulbarga University, Gulbarga for providing laboratory facilities to carry out the present work.
Received April 22 2008 Accepted September 30 2008
References
[1] M. E. Wol, John Wiley and Sons, “Text book of Burgers Medicinal Chemistry,” fourth ed., New York, 1979. [2] C. Cosar, L. Julon, Ann. Inst. Pasteur. 96 (1959) 238. [3] C. Cosar, P. Ganter, L. Julion, Presse Meed. 69 (1961) 1069. [4] C. Cosar, C. Cusan, R. Horclois, R. M. Jacob, J. Robert, J. S. Tchelitche, R. Vaupre, Arzneim –Forsch. 16 (1966) 23. [5] S.J. Powell, I. McLeod, A. J. Wilmot, R. Elsdon-Dew, Lancet. 2 (1966) 1329.
[6] S.J. Powell, Bull. N.Y. Acad. Med 47 (1971) 469. [7] R.B. Khambatta, Ann. Trop. Med. Parasitol. 62 (1968) 139. [8] Indian Pharmacopoeia,Controller of Publications, New Delhi, 2 (1996) p 764.
[9] British Pharmacopoeia, Her Majesty’s Stationery Office, London, 2 (2003) p 1257.
[10] The United States Pharmacopoeial Convention, Rockville, MD, The United States Pharmacopoeia 24th edn. The National Formulary 19 (2000) p 1104.
[11] P. D. Panzade, K. R. Mahadlik, East Pharm. 43 (2000) 115. [12] P. Nagaraja, K. R. Sunitha, R. A. Vasantha, H. S. Yathirajan, J. Pharm. Biomed. Anal. 28 (2002) 527. [13] T. Saffaj, A. Charrouf, Y. Abourriche, A. abboud, M. B. Bennamara, Formaco.59 (2004) 843.
[14] D. M. Joshi, A. P. joshi, J. Indian. Chem. Soc.74 (1997) 585. [15] B. A. Moussa, Int. J. Pharm. 10 (1982) 199.
[16] T.P. Gandhi, P. R. Patel, V. C. Patel, S. K. Patel, J. Inst. Chem. 56 (1984) 127.
[17] C.S.P. Sastry, M. Aruna, A. R. M. Rao, Talanta.35 (1988) 23. [18] C.S.P. Sastry, M. Aruna, A. R. M. Rao, A. S. R. P. Tipirneni, Chem. Anal. 36 (1991) 153.
[19] A. S.Amin, Anal. Lett. 30 (1997) 2503.
[20] P. Nagaraja, K. R. Sunitha, R. A. Vasantha, H. S. Yathirajan, J. Pharm. Biomed. Anal. 28 (2002) 527. [21] N. D. Dinesh, P. Nagaraj, K. S. Rangappa, Turk. J. Chem. 28 (2004) 335.
[22] A. Rehaman, A. S. Ijaz, A. Raza, J. Iran. Chem. Soc. 2 (2005) 197.
[23] F. Bluemenhal, Biochem.Z. 28 (1956) 1321.
[24] G. O. Burr, R. A. Gartner, J. Am. Chem. Soc. 46 (1924) 1224.
[25] W. Frieber, Centr.Baktenol. Parasitenk. 87 (1922) 254. [26] Chem. Rev. 26 (1940) 324.
[27] R. Wasicky, Z.Anal. Chem. 54 (1915)
[28] Raymond-Hamlet, Bull. Sci. Pharmacol. 33 (1926) 447. [29] A. E. A. Werner, Sci. Proc, Roy. Dulbin Soc. 23 (1944) 214. [30] K. Kapse, G. Prabhakar, S. Appala raju, Indian. J. Pharm. Sci. 3 (2006) 403.
[31] B. H. Ahmed, O.O. Johnson, J. Pharmacy and Bioresources. 1(2004) 1.