Conductometric determination of propranolol hydrochloride in pharmaceuticals
Elen Romão Sartori, Nathália Vieira Barbosa, Ronaldo Censi Faria and Orlando Fatibello-Filho*
Centro de Ciências Exatas e de Tecnologia, Departamento de Química, Universidade Federal de São Carlos - UFSCar, P.O. Box 676, CEP 13.560-970, São Carlos, SP, Brazil.
* Address correspondence to this author at the Departamento de Química, Universidade Federal de São Carlos, C.P. 676, 13.560-970 São Carlos – SP, Brazil; Tel.: +55 16 33518098; fax: +55 16 33518350;
E-mail: [email protected] (O. Fatibello-Filho)
Abstract:
______________________________________________________________________________
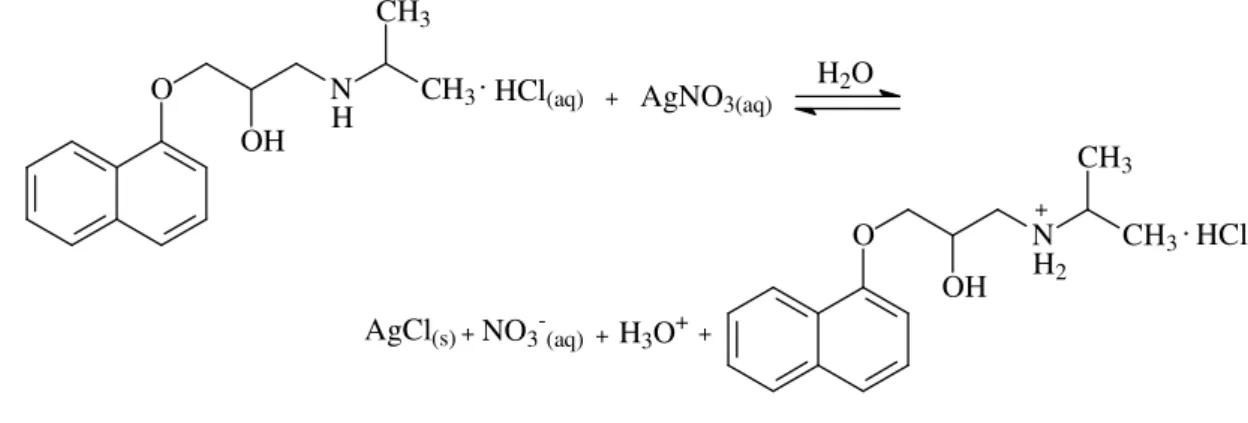
In this paper the conductometric titration of propranolol hydrochloride in pharmaceutical formulations using silver nitrate as titrant is proposed. The method was based on the formation of an insoluble salt (AgCl(s)) between the chloride of propranolol hydrochloride molecule and Ag(I) ions of the titrant AgNO3. The effect of the PROP-AgNO3 concentrations and the interval of time
between the successive additions of the titrant on the shape of the titration curve were studied. The obtained recoveries for four samples ranged from 96.8 to 105%. The proposed method was successfully applied in the determination of propranolol hydrochloride in several pharmaceutical formulations, with results in close agreement at a 95 % confidence level with those obtained using official spectrophotometric method.
WWW.SCIELO.BR/EQ
Keywords: Conductometric titration, propranolol hydrochloride, silver nitrate, pharmaceutical formulations.
Introduction
Propranolol hydrochloride (PROP) (Figure 1), is a cardioselective β-adrenergic receptor blocking agent, which is orally used in the form of chlorhydrates. It is generally prescribed for the treatment of various cardiovascular disorders, such as angina pectoris, hypertension, cardiac arrhythmias, and myocardial infarction [1].
. HCl O
OH
N CH3
CH3
H
Figure 1. Chemical structure of propranolol hydrochloride.
The British [2] and Brazilian [3] Pharmacopoeias described a potentiometric and a spectrophotometric method of assay, respectively. Several other analytical methods involving
colorimetry [4], spectrophotometry [5-9], atomic absorption spectrometry [9],
There is only one conductometric method described for the determination of PROP in pharmaceutical formulations [24]. In this method, Issa and Amin determined PROP by conductometric titration using ammonium reineckate and potassium tetracyanonickelate as titrant in an ethanol-water (50% v/v) mixture. The use of ammonium reineckate should be avoided because of its toxicity.
In this study, a simple, precise, rapid, and low-cost conductometric titration method for the determination of PROP in pharmaceuticals is proposed using silver nitrate as titrant. The same reagent has been employed with success in many analytical methods for pharmaceuticals’ quality control [25-31]. The obtained results in this work were compared with those obtained from an official spectrophotometric method [3].
Experimental
Apparatus
Conductometric measurements were carried out in a thermostated glass cell employing an automatic microburet Methrom/Herisau, model E274, a conductivimeter Micronal, model B330 and a conductometric cell Digimed DMC-010. The solution was kept under constant agitation during all measures at a temperature of 25 + 1 °C.
The PROP determinations by the spectrophotometric reference method [3] were carried out using a Hewlett Packard UV-visible spectrophotometer, model 8452A, coupled to a microcomputer.
Propranolol and AgNO3 were obtained from Sigma-Aldrich. All solutions were prepared
using chemical reagents of analytical grade and ultra-purified water supplied by a Milli-Q system (Millipore®) with resistivity higher than 18 M cm.
The stock solution of 5.0 × 10⁻² mol L-1 AgNO3 was prepared by dissolving an
appropriate mass of this salt in Milli-Q water and the solutions in concentrations varying from 5.0 × 10⁻⁴ to 1.0 × 10⁻² mol L-1 were obtained by adequate dilution of the stock solution.
Conductometric titration
In a thermostated glass cell, a 10-mL aliquot of pharmaceutical solution (reference or sample) was titrated with silver nitrate solution in the same concentration. For each addition of the titrant, in intervals of 15 s, the conductance was determined, and each Lexp obtained was
corrected using Lcorr= Lexp× ((Vi + Va) / Vi), where Lcorr is the corrected conductance, Lexp is the
experimental conductance, Vi is the initial volume, and Va is the titrant added volume. The
equivalence volume was obtained in the inflexion point of conductance graph (Lcor) versus
volume of AgNO3 solution.
Determination of propranolol hydrochloride in commercial samples
Samples containing different amounts of propranolol hydrochloride were purchased from a local drugstore. To prepare the solutions of the PROP commercial samples, a representative number of tablets (10) of each different pharmaceutical dosage was reduced to a homogeneous fine powder in a mortar with a pistil. An adequate amount of the resulting powders was weighed and transferred to a 100-mL calibrated flask, which was dissolved in 100 mL of Milli-Q water. The solutions were filtered in filter paper to remove undissolved solids and then aliquots of 10 mL of filtered solution were titrated with AgNO3 solution.
accurate representative amount of powder from each PROP commercial sample in the different dosages was dissolved in methanol. Appropriate dilutions were made from this solution and then the absorbance was measured at 290 nm, in a quartz cell.
Results and discussion
Preliminary Studies
The method was based on the chemical reaction between the chloride of PROP molecule and Ag(I) ions of the titrant AgNO3, yielding the precipitate AgCl(s) of low solubility (1.1 × 10⁻⁵
mol L-1) [32].
The interval of time (10, 15, and 20 s) between the successive additions of the titrant
using a 1.0 × 10⁻² mol L-1PROP and AgNO3 solutions at the same concentration was investigated
first. The smaller relative standard deviation and better resolution in the conductometric titration curve was obtained with the interval of time of 15 s between the measurements, which was consequently selected for further studies.
Secondly, the effect of the concentration of the PROP solution from 5.0 × 10⁻⁴ to 1.0 ×
10-2 mol L-1 using the titrant AgNO3 solution, at the same concentration of PROP solution on the
shape of the titration curve was investigated. For the PROP concentrations lower than 5.0 × 10⁻⁴ mol L-1 the addition of the AgNO3 caused small variations in the conductance, due to which the
determination of the final point of the titration became unreliable. Hence, taking into account this result, the determination of the equivalence point can be determined until a minimum concentration of 5.0 × 10⁻⁴ mol L-1 of the PROP solution. It occurs due to the dilution of the solutions and the AgCl(s) solubility formed. As can be seen in Table 1, results obtained using the
Table 1. Comparison between reference solutions of propranolol hydrochloride and the results
obtained by proposed method, at 25 oC
Standard PROP solutions (mol L-1) Experimental (mol L-1) Relative error (%)a
5.00 × 10⁻⁴ (5.03 ± 0.01) × 10-4 0.6
1.00 × 10⁻³ (1.02 ± 0.01) × 10-3 2.0
5.00 × 10⁻³ (4.99 ± 0.05) × 10-3 -0.2
1.00 × 10⁻² (9.94 ± 0.03) × 10-3 -0.4
a
Experimental versus theoretical values.
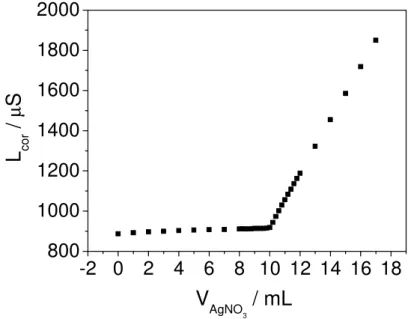
Figure 2 presents a typical conductometric curve obtained for a10 mL of 1.0 × 10⁻³ mol L
-1
PROP solution using AgNO3 solution at the same concentration. The conductance measured
before the addition of the titrant (volume of AgNO3 solution equal zero) is related to the PROP
solution. Until the equivalence point, the titration involves the precipitation of the ions Cl- with Ag+.
-2 0
2
4
6
8 10 12 14 16 18
800
1000
1200
1400
1600
1800
2000
V
AgNO3
/ mL
L
cor
/
µ
Figure 2. Conductometric titration of 1.0 × 10⁻³ mol L-1 PROP solution using a 1.0 × 10⁻³ mol L
-1
AgNO3 solution.
Because of high ionic conductivity of the ions H+ (H3O+) it was expected that the first
branch of the titration curve would have a slope higher than that observed experimentally (Figure 3). These results indicate that while chloride ions are being titrated, the ions H+ (H3O+) were not
released into the solution and the amino group of PROP molecule been protonated. Thus, the low slope of the conductometric curve is due to the increase of the nitrate concentration from titrant solution. After the equivalence point, as volumes of the titrant solution are added, a sharp rise occurs in the conductance because of the excessive volume of the AgNO3(aq) solution added. The
increase of the concentrations of Ag+(aq) and NO3-(aq) in the remaining solution promotes the
increase of the second branch slope of the titration curve. The end-point was determined by the intersection point of the two straight lines.
. O
OH
N CH3
CH3
H HCl(aq) + AgNO3(aq)
H2O
AgCl(s) +NO3-(aq) +H3O++
. HCl O
OH
N CH3
CH3
H2
+
The repeatability of the conductometric method was determined by successive titrations (n = 5) of 1.0 × 10⁻³ mol L-1 PROP solution with a 1.0 × 10⁻³ mol L-1 AgNO3 solution, when
relative standard deviations smaller than 0.5% were obtained.
Interferences and recovery study
The effect of some potential interferent compounds was investigated by addition of the
different concentrations of these compounds to standard solutions containing 1.0 × 10⁻³ mol L-1 of PROP solution. The excipients, hydrochlorothiazide (associated with PROP), manithol, lactose, starch, povidone, magnesium stearate, and magnesium carbonate, present in the analyzed pharmaceutical samples were tested. The obtained responses showed that these compounds do not interfere in the determination of PROP at the used working conditions.
To evaluate the recovery of the PROP from pharmaceutical products, four commercial samples were used. Recoveries of the analytes were examined by adding standard solution of PROP at three concentrations (1.0 × 10⁻³ mol L-1, 3.0 × 10⁻³ mol L-1 and 5.0 × 10⁻³ mol L-1) to pharmaceutical products and the results obtained were compared with the added concentrations. The results showed good recoveries for the commercial tablets, ranging from 96.8 to 105%, indicating that there is not any important matrix interference for the samples analyzed by the proposed conductometric method.
Analytical Application
using the conductometric titration proposed method and the spectrophotometric reference method [3].
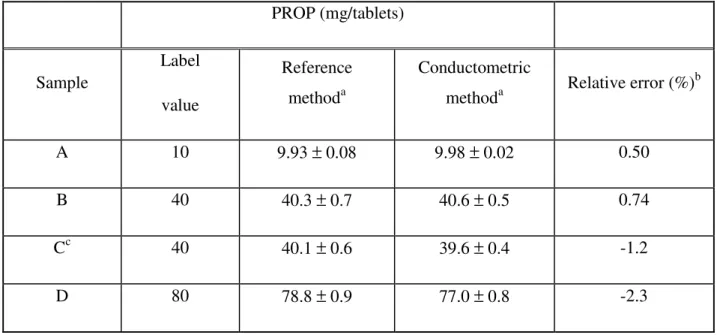
Table 2. Determination of propranolol hydrochloride (PROP) in pharmaceutical formulations by
spectrophotometric reference method and by the proposed conductometric method
PROP (mg/tablets)
Sample
Label
value
Reference methoda
Conductometric
methoda Relative error (%)
b
A 10 9.93 ± 0.08 9.98 ± 0.02 0.50
B 40 40.3 ± 0.7 40.6 ± 0.5 0.74
Cc 40 40.1 ± 0.6 39.6 ± 0.4 -1.2
D 80 78.8 ± 0.9 77.0 ± 0.8 -2.3
a
Average of 3 measurements.
b
[100 × (conductometric value – reference method)] / reference method.
c
Containing 25 mg hydrochlorothiazide.
Beside, the paired t-test [33] was applied to the results obtained for PROP using both methods; since the calculated t value (0.9015) is smaller than the critical value (3.182, α = 0.05), it may conclude that the results obtained with the proposed procedure are not statistically different from those from the comparative method, at a 95 % confidence level.
The proposed conductometric procedure for PROP determination in pharmaceutical products is simple, precise, of low cost, faster than the conductometric method reported in the literature [24] and, could be implemented in laboratories for routine analysis.
Acknowledgements
The authors gratefully acknowledge the financial support from the Brazilian foundations (FAPESP (Proc. 2009/14454-8; 2009/04048-2), CAPES and CNPq).
References
[1] J.G. Hardman, L.E. Limbird, A.G. Gilman, Goodman & Gilman´s – The Pharmacological Basis of Therapeutics, McGraw-Hill, New York, 9th ed., 1996.
[2] British Pharmacopoeia, HMSO, London, 2009.
[3] Farmacopéia Brasileira, Atheneu Editora, São Paulo, 4th ed., Part II, 2002.
[4] O.S. Idowu, O.A. Adegoke, A.A. Olaniyi, J. AOAC Inter. 87 (2004) 573.
[5] C.S.P. Sastry, K.R. Srinivas, K.M.M.K, Prasad, Microchim. Acta 122 (1996) 77.
[6] B.G. Gowda, J. Seetharamappa, M.B. Melwanki, Anal. Sci. 18 (2002) 671.
[7] A.J. Gölcü, Anal. Chem. 63 (2008) 538.
[8] H.J. Salem, Pharm. Biomed. Anal. 29 (2002) 527.
[10] A.M. Delapena, F. Salinas, M.S. Duran, Anal. Chim. Acta 255 (1991) 317.
[11] T.P. Ruiz, C. Martínez-Lozano, V. Tomás, J. Carpena, Talanta 45 (1998) 969.
[12] K.C. Ramesh, B.G. Gowda, J. Seetharamappa, J. Keshavayya, J. Anal. Chem. 58 (2003) 933.
[13] A.B. Tabrizi, J. Food Drug Anal. 15 (2007) 242.
[14] M.A. Gotardo, J.O. Tognolli, H.R. Pezza, L. Pezza, Spectrosc. Acta Part A 69 (2008) 1103.
[15] I.C. Rapado-Martínez, M.C. García-Alvarez-Coque, R.M. Villanueva-Camañas, J. Chromatogr. A 765 (1997), 221.
[16] Y.S. El-Saharty, J. Pharm. Biomed. Anal. 33 (2003) 699.
[17] V.N. Pathak, M.S.R. Shukla, I.C. Shukla, Analyst, 107 (1982) 1086.
[18] A. Townshend, J.A.M. Pulgarín, M.T.A. Pardo, Anal. Chim. Acta 488 (2003) 81.
[19] G.Z. Tsogas, D.V. Stergiou, A.G. Vlessidis, N.P. Evmiridis, Anal. Chim. Acta 541 (2005) 151.
[20] S.S.M. Hassan, M.M. Abou-Sekkina, M.A. El-Ries, A.A. Wassel, J. Pharm. Biomed. Anal. 32 (2003), 175.
[21] M.A. El-Ries, M.M. Abou-Sekkina, A.A. Wassel, J. Pharm. Biomed. Anal. 30 (2002) 837.
[22] A. Radi, A.A. Wassel, M.A. El-Ries, Chem. Anal. 49 (2004) 51.
[23] E.R. Sartori, R.A. Medeiros, R.C. Rocha-Filho, O. Fatibello-Filho, Talanta 81 (2010) 1418.
[24] Y.M. Issa, A.S. Amin, Mikrochim. Acta 118 (1995) 85.
[25] W.T. Suarez, H.J. Vieira, O. Fatibello-Filho, J. Braz. Chem. Soc. 18 (2007) 1028.
[26] M.S. Elezazy, M.Y. El-Mammli, A. Shalaby, M.M. Ayad, Chem. Anal. 53 (2008), 725.
[28] E.R. Sartori, W.T. Suarez, O. Fatibello-Filho, Quim. Nova 32 (2009), 1947.
[29] W.T. Suarez, E.R. Sartori, E.F. Batista, O. Fatibello-Filho, Quim. Nova 32 (2009) 2396.
[30] K. Basavaiah, P. Nagegowda, J. Iran. Chem. Soc. 1 (2004) 106.
[31] Y. Ni, A. Wu, Anal. Chim. Acta 390 (1999) 117.
[32] G.H. Jeffery, J. Basset, J. Mendham, R.C. Denney, Vogel’s Textbook of Quantitative Chemical Analysis, Longman Scientific & Technical, England, 5th ed.,1989.
[33] R.L. Anderson, Practical Statistics for Analytical Chemists, Van Nostrand Reinhold, New York, 1987.
Determinação condutométrica de cloridrato de propranolol em farmacêuticos
Resumo: Neste trabalho descreve-se a titulação condutométrica do cloridrato de propranolol em
formulações farmacêuticas usando nitrato de prata como titulante. O método é baseado na formação de um sal insolúvel (AgCl(s)) entre o cloreto da molécula do cloridrato de propranolol e
os íons Ag(I) do titulante AgNO3. O efeito das concentrações PROP-AgNO3 e o intervalo de
tempo entre adições sucessivas de titulante no formato da curva de titulação foram estudados. Recuperações para quatro amostras variaram de 96,8 a 105%. O método proposto foi aplicado na determinação do cloridrato de propranolol em diversas formulações farmacêuticas, com
resultados concordantes com àqueles obtidos empregando-se o método oficial
espectrofotométrico, a um nível de confiança de 95 %.