Full Terms & Conditions of access and use can be found at
http://www.tandfonline.com/action/journalInformation?journalCode=tciv20
Download by: [213.22.88.153] Date: 07 June 2017, At: 14:18
Computer Methods in Biomechanics and Biomedical
Engineering: Imaging & Visualization
ISSN: 2168-1163 (Print) 2168-1171 (Online) Journal homepage: http://www.tandfonline.com/loi/tciv20
Cell-free layer measurements of in vitro blood
flow in a microfluidic network: an automatic and
manual approach
D. Bento, A. I. Pereira, J. Lima, J. M. Miranda & R. Lima
To cite this article: D. Bento, A. I. Pereira, J. Lima, J. M. Miranda & R. Lima (2017): Cell-free layer measurements of in vitro blood flow in a microfluidic network: an automatic and manual approach, Computer Methods in Biomechanics and Biomedical Engineering: Imaging & Visualization, DOI: 10.1080/21681163.2017.1329029
To link to this article: http://dx.doi.org/10.1080/21681163.2017.1329029
Published online: 31 May 2017.
Submit your article to this journal
Article views: 4
View related articles
https://doi.org/10.1080/21681163.2017.1329029
Cell-free layer measurements of
in vitro
blood flow in a microfluidic network: an
automatic and manual approach
D. Bentoa,b, A. I. Pereiraa,c, J. Limaa,d, J. M. Mirandab and R. Limaa,e
aschool of technology and management (estig), polytechnic institute of Bragança (ipB), Bragança, portugal; bCeFt, Faculdade de engenharia da universidade do porto (Feup), porto, portugal; calgoritmi r & d Centre, university of minho, Braga, portugal; dinesC teC – Centre for robotics in industry and intelligent systems, porto, portugal; emetriCs, mechanical engineering department, university of minho, guimarães, portugal
ABSTRACT
In microcirculation, the cell-free layer (CFL) is a well-known physiological phenomenon that plays an important role in reducing the flow resistance and in balancing nitric oxide (NO) production by endothelial cells and NO scavenging by red blood cells. To better understand this phenomenon, several blood flow studies have been performed in simple geometries at both in vivo and in vitro environments. However, to date little information is available regarding the effects imposed by a complex branching network on the CFL. The present study shows the CFL layer variation at a microchannel network. The images were captured using a high-speed video microscopy system and the thickness of the CFL was measured using both manual and automatic image analysis techniques. Using this methodology, it was possible to visualise the in vitro blood flowing through the network and to identify several flow phenomena that happen in microcirculation. Overall, the results have shown that the concentration of cells and the geometrical configuration of the network have a major impact on the CFL thickness. In particular, the thickness of the CFL decreases as the fluid flows through a microchannel network composed with successive smaller channels. It was also clear that, for the full length of the network, the CFL thickness tends to decrease with the increase of the concentration of cells. The automatic method developed becomes inaccurate for high haematocrit and needs be calibrated by manual methods for Hcts bigger than 10%. The results obtained from this study could help the development and validation of multiscale numerical models able to take into account the CFL for simulating microvascular blood flow.
ARTICLE HISTORY
received 7 december 2016 accepted 8 may 2017
KEYWORDS
Cell-free layer; microfluidic network; red blood cells; blood flow; microcirculation
© 2017 informa uK limited, trading as taylor & Francis group
CONTACT r. lima [email protected]
1. Introduction
Experimental blood flow studies at the microscale level have been extensively active from the beginning of the twenty-first century (Popel & Johnson 2005; Lima et al. 2012). The great interest in this field was in part due to developments in the microscopy technology, image analysis techniques and numeri-cal models for blood flow simulation (Wereley & Meinhart 2010; Williams et al. 2010; Lima et al. 2012; Kim 2013; Nakamura et al. 2013; Yin et al. 2013; Bento et al. 2015; Gambaruto 2015; Oulaid & Zhang 2015). For instance, the application of the confocal micro-PIV system to study the blood in microfluidic devices has led to not only obtain three-dimensional velocity profiles of the blood flow (Lima et al. 2006, 2008) but also to measure in detail the motion of individual red blood cells (RBCs) flowing through moderate and high concentration of blood cells, i.e. concentra-tions bigger than 10% (Lima et al. 2009; Saadatmand et al. 2011; Pinho et al. 2016). Therefore, the progress of the high-speed video microscopy systems has yielded valuable information on several blood flow phenomena happening in microcirculation. The cell-free layer (CFL) is a well-known physiological phenome-non that was studied both in vivo (Tateishi et al. 1994; Kim et al.
2 D. BENTO ET AL.
the RBCs tracking trajectories tend to fail at moderate and high haematocrits and as a consequence these methods are not suit-able to measure the CFL thickness. Hence, in this work, a simple and fast automatic image-processing method was developed, in a MATLAB environment, to measure the CFL thickness along a microchannel network.
The main purpose of this work is to measure and characterise the CFL in a polydimethylsiloxane (PDMS) microchannel network fabricated by soft lithography. In particular, we intend to quan-tify how flow conditions, cells concentration, channel size and topology affect the dynamic behaviour of the CFL layer varia-tion along a microfluidic network composed of several divergent and convergent bifurcations. To accomplish it, a well-established manual method was first used to measure the CFL thickness. Additionally, the experimental data obtained by the manual method was compared with the measurements performed by an automatic image-processing method developed in a MATLAB environment. Due to its simplicity and high-speed image process-ing, the suggested automatic method may prove to be an appro-priate method to automatically determine the CFL thickness in a network of microfluidic channels.
2. Materials and methods
2.1. Working fluids and network geometry
The working fluid used in the current study was fresh and healthy ovine RBCs suspended with dextran 40 (Dx40). Ethylenediaminetetraacetic acid was added to the collected blood to prevent coagulation. All samples were centrifuged twice with physiological saline in order to separate the RBCs from the other blood elements. The washed RBCs were then suspended in Dx 40 to obtain the planned hematocrits (Hct). In this study, we have used RBCs concentration by volume of 5 and 10% that can also be observed in in vivo microvascular environ-ments (Fung 1997).
The microchannel network composed of several divergent and convergent bifurcations fabricated for the proposed assays have been produced in PDMS by a conventional soft-lithography technique. More detailed information about the microfabrication technique used in this work can be found elsewhere (Lima et al. 2008; Faustino et al. 2016).
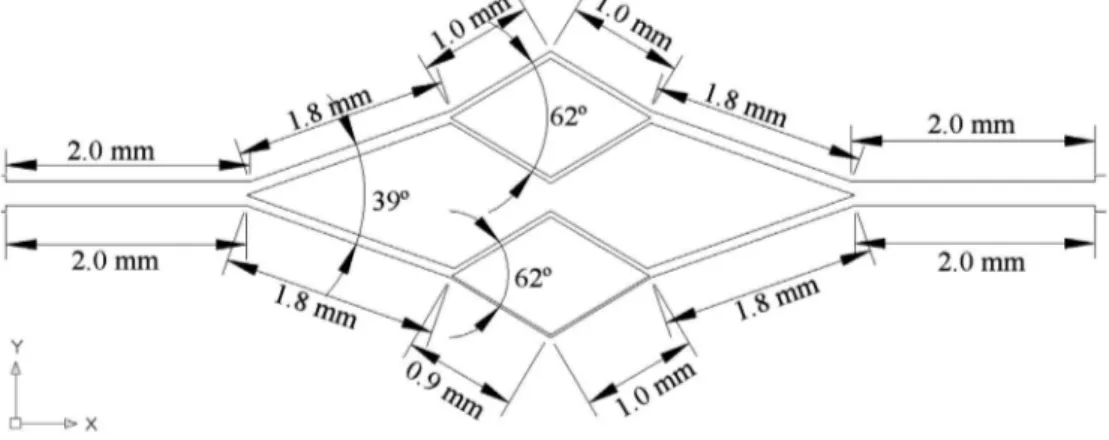
The geometry and dimensions of the microchannel network is shown in Figure 1. The network consists of three divergent and convergent bifurcations with microchannels of widths ranging from 221.6 μm down to 32.2 μm (see Figure 2). The microchannels have a constant depth of about 58 μm throughout the PDMS microfluidic device. The depth of the microchannel was measured by performing microscopic visualisations of the channel’s cross section along the full length of the network.
2.2. Experimental set-up
The experimental set comprises an inverted microscope (IX71, Olympus, Japan) combined with a high-speed camera (i-SPEED LT, Olympus, Japan) (see Figure 3). The PDMS microchannel net-work was placed on the stage of the inverted microscope where a syringe pump (PHD ULTRA, Harvard Apparatus) was used to control the flow rate (1 μL/min) of the working fluids.
performed in straight microvessels (Tateishi et al. 1994; Kim et al. 2006, 2009; Dietzel et al. 2014; Namgung et al. 2014), in micro-channels with simple geometries (Lima et al. 2009; Garcia & Lima 2012; Sampaio et al. 2015) and microfluidic devices with artificial geometries to perform blood plasma and cells separation (Pinho et al. 2013; Rodrigues et al. 2015; Tripathi et al. 2015). Overall, those studies have found that the CFL always forms around the walls and its thickness depends mainly on the haematocrit, size and geometry of the vessel or microchannel. In addition, experimental studies performed at both in vivo and in vitro con-ditions have shown the RBC aggregation tend to promote the increase of the CFL thickness (Mchedlishvili & Maeda 2001; Ong et al. 2011; Namgung et al. 2015). Mehri et al. (2014) have also investigated the effect of RBC aggregation at different flow rates and haematocrits. They have observed that the aggregates tend to be larger at low flow rates and high haematocrits. Recently, several research studies have found that bifurcations and con-fluences may also have a strong impact on the CFL and conse-quently on the blood flow velocities (Ishikawa et al. 2011; Leble et al. 2011; Pinto et al. 2014; Sherwood et al. 2014). Leble and his colleagues (2011) have observed that trace particles tend to flow to locations just after the confluence apex. However, at this location labelled RBCs were not able to be measured due to the formation of a CFL around the confluence apex. These results have revealed that parameters such as topology and geometry are likely to influence the blood flow behaviour in microvascu-lar networks. However, to best of our knowledge, there are no CFL quantitative studies at microfluidic network composed of several divergent and convergent bifurcations. In this study, measurements of the CFL thickness were performed along a microchannel network using both manual and automatic methods.
2.3. Image analysis and processing
The images were captured around the midplan of the micro-channel at a rate of 50 frame/s and with a resolution of 600 × 800 pixels. Additionally, all the recorded images were transferred to a computer and then evaluated using two different image
analysis approaches, i.e. a manual and an automatic method. For both methods, the ratio to convert pixels to microns was 1.45 Px/μm.
2.3.1. The manual method
MTrackJ plugin (Meijering et al. 2006), available on the Image J software (Abramoff et al. 2004), was used to track individual RBCs flowing around the edge of the cells core (Point 2 in Figure 4). Using the MTrackJ plugin, the centroid of the selected cell was automatically calculated and the nearest wall position was measured (Point 1 in Figure 4). Hence, the CFL thickness was measured as the distance between the tracked RBCs flowing around the edge of the cells core and the nearest microchannel wall (see Figure 4).
2.3.2. The automatic method
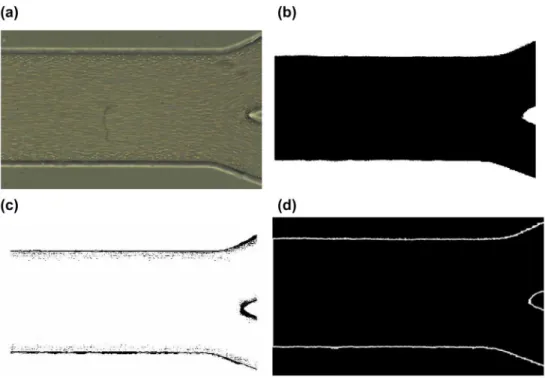
The automatic method approach was based on the movement of the RBCs. Sequences of frames were acquired and processed using image processing techniques in Matlab. Figure 5(a)) shows a frame of this sequence.
Initially, an image was obtained that represents the sum of the absolute differences of all N frames (
fri, fori=1,…,N), i.e. the difference of each consecutive frame was calculated and then all these absolute differences were summed, as represented in (1).
(1)
diff =
N
∑
i=2 |
|fri−fri−1||.
Figure 1. geometry and dimensions of the microchannel network.
Figure 2. schematic view of the geometry and dimensions of the microchannel network with the following widths: a1 (inlet) = a2 (outlet) = 221.6 μm; B1 = B2 = 117.9 μm; C1 = C2 = 97.6 μm; d1 = d2 = 66.2 μm; e1 = e2 = e1 = e2 = 55.6 μm; F1 = F2 = 32.2 μm. the depth of the microchannels is approximately 58 μm.
Figure 3. high-speed video microscopy system used to control and visualise the
4 D. BENTO ET AL.
The final result of the automatic method is obtained by the multiplication of the image diff by the image prod. This result is shown in Figure 5(d)) where it is possible to measure the CFL.
3. Results and discussion
The results of the dynamic behaviour of the CFL layer variation along a microfluidic network, for in vitro blood with Hcts of 5 and 10% are presented and discussed in this section. The experimen-tal results were obtained not only by a well-established manual method but also by an automatic image-processing method developed in a MATLAB environment.
3.1. In vitro CFL visualisations
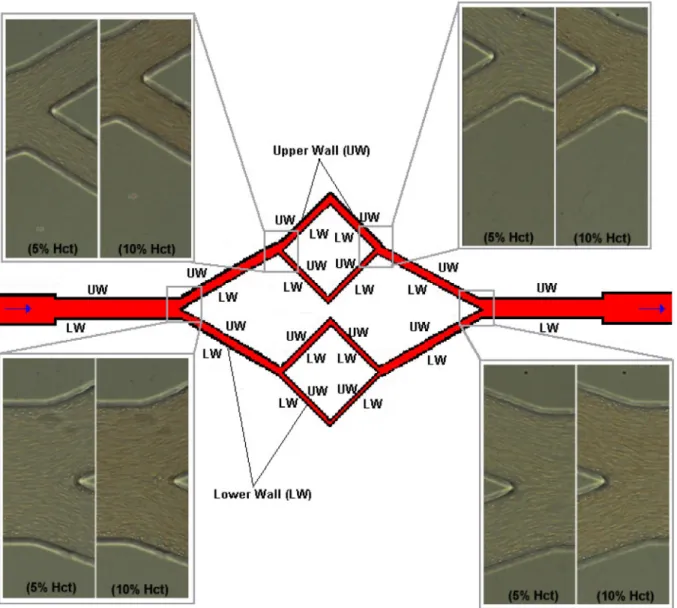
Using the high-speed video microscopy system shown in Figure 3, it was possible to visualise the working fluids flowing through the network and to identify several flow phenomena that happen in microcirculation. Figure 6 shows representative flow visualisations of in vitro blood with 5% Hct and 10% Hct at a complex branching network. Additionally, in Figure 6 it is possible to observe a distinctive CFL along the lower (LW) and upper walls (UW) of the microchannel network. As expected, around the bifurcations apex the RBCs concentration tend to increase and as a result no CFL was observed. Furthermore, it should be noted that in this study no CFL was observed at the regions immediately downstream of the confluences. This latter observation is in contrast not only with the results obtained by Ishikawa et al. (2011), Leble et al. (2011) and Pinto et al. (2014) but also with our recent findings with moving microbubbles in microchannels (Bento et al. 2017). One possible explanation of this divergence could be due to the different dimensions and geometries used in the current study.
The resulting image (see Figure 5(b))) is a threshold of the image diff, yielding an image in which black corresponds to the RBCs flowing within the microchannel (where the movement between frames was detected) and white corresponds to the background of the microchannel.
In order to obtain the position of the channel wall and con-sequently measure the CFL, all the histogram-equalised frames were multiplied (see Equation (2)), where friH is the equalised his-togram of fri, fori=1,…,N. The result of this operation is shown in Figure 5(c)).
(2)
prod= N
∏
i=1
frHi
Figure 4. trajectory of a rBC (point 2) flowing around the edge of the rBCs core. point 1 corresponds to the wall of the microchannel. the trajectory was obtained by using the manual method.
Figure 5. automatic method: (a) one frame of the acquired sequence, this frame was acquired by i-speed lt, olympus camera at 50 frames per second and a resolution of
the parent microchannels, respectively. In this figure, it is also shown the CFL thickness at both lower and upper walls of the network. Overall, we have found a close agreement between both walls. Hence, we have decided for clarity, to only show the CFL average results of the lower and upper walls, for the remaining regions of the network. From these results, it is also clear that the Hct play an important role on the CFL thickness as it decreases by increasing the Hct. This observation is consistent with the data obtained by both manual and automatic methods. It should be noted that the consistency of the values at a low Hct (5%) indi-cates that the automatic method can produce relatively good results of the CFL thickness. However, at a moderate Hct (10%), it seemed to slightly overestimate the CFL thickness as the obtained values were always higher than those measured with the manual method.
Figure 8 shows the calculated values for the CFL thickness at the larger daughter branches of the network, i.e. B1, B2, C1 and C2. For 5% Hct, the results obtained with both methods show an apparent good agreement. Additionally, these measurements
3.2. CFL measurements
To investigate how the CFL thickness can be affected by the microfluidic network manual measurements of the cells flowing around the boundary region of the RBCs core were performed. Although manual methods have the advantage to perform direct measurements of the targeted RBCs, these methods can be also extremely time consuming and may introduce operator errors into the data. In order to reduce the human measurement error, manual measurements were performed by six different users. Note that, each user has tracked at least three RBCs flow-ing around the edge of the cells core which corresponds to the CFL boundary. Additionally, to reduce the measurement time and improve to consistency of the obtained data a simple auto-matic method described in Section 2.3 was also used to meas-ure the CFL thickness along the network. It should be noted that all the CFL measurements were performed in channel locations where the CFL was fully developed.
Figure 7 shows measurements of the CFL thickness at the regions A1 and A2 which corresponds to the inlet and outlet of
6 D. BENTO ET AL.
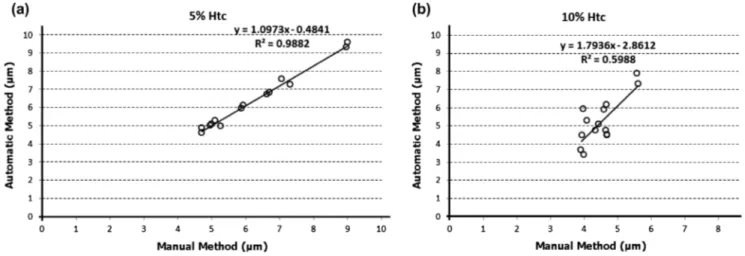
obtained with the automatic method are in good agreement with those determined with the manual method. However, when com-pared with moderate Hct (10%), one can observe small deviations between both methods. In order to investigate the agreement between the two methods, a linear regression analysis was per-formed along the network (see Figure 10).
Overall, the CFL measurements have shown a close agreement between both manual and automatic methods at a low Hct (5%). However, by increasing the Hct it is possible to observe small devi-ations between both methods. By performing a linear regression analyses for both methods at two different Hcts, it is clear that the measurements performed with 5% Hct show the closest slope (1.0973) to the unit and the closest interception (–0.4841) to zero. Hence, these analyses shows that the closest agreement between both methods is observed for the lowest haematocrit studied (5% Hcts). It should be noted that the accuracy of the proposed automatic method to calculate the CFL thickness depends on the acquired image quality, particularly on the contrast and intensity of the pixels between the microchannel wall and RBC core. Hence, automatic methods to measure the CFL thickness require images able to provide a clear distinction of the edge of the wall and RBC core. Overall, the results obtained from the present study indicate that accuracy of the proposed automatic method tends to be reduced by increasing the Hct. In fact, the increment of the amount of RBCs flowing within the microchannels and the conse-quent reduction of the CFL thickness around the wall, have played a crucial role in reducing the quality of the acquired images. As a result, the linear correlation slope has increased to about 1.8 for an Hct of 10% (see Figure 10). Hence, although the proposed automatic method has several advantages such as simplicity and fast image processing, this method may be limited to calculate the CFL thickness with Hcts smaller than 10%.
3.3. Comparison with previews studies
The CFL is a physiological phenomenon that happens at the micro scale level at both in vivo (Tateishi et al. 1994; Kim et al. 2006, 2009; Ong et al. 2012; Dietzel et al. 2014; Namgung et al. 2014) and in vitro (Leble et al. 2011; Garcia & Lima 2012; Sampaio et al. 2015; Bento et al. 2017) environments. Due to its important indicate that the CFL thickness tends to decrease as the width of
the microchannel network reduces. However, for 10% Hct such tendency was not evident, probably due to a compensation promoted by an increase of the local Hct at the larger daughter branches. It should be noted that this compensation did not hap-pen for instance at A1 to B1 and C1. Overall, these results indicate that the bifurcations with different widths promote an uneven distribution of blood cells throughout the microchannel network. Nevertheless, in the network geometry tested in this work, this local Hct heterogeneity tends to recover to its initial feed Hct conditions at the outlet parent microchannel as the CFL thickness for both A1 and A2 has similar values. It is worth mentioning that although at a moderate Hct (10%) the values from the automatic method are slightly overestimated, still possible to conclude that the CFL thickness is smaller than values obtained with a Hct of 5%.
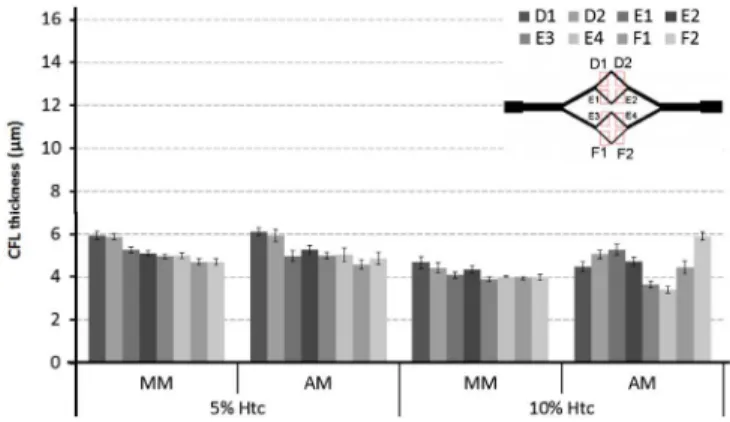
The CFL thickness measurements were also performed at the smaller daughter branches (D, E and F). The results from Figure 9 reinforce the previous results regarding the influence of the Hct on the CFL thickness, i.e. it decreases by increasing the Hct. Here, it is also possible to observe that at a low Hct (5%) the values
Figure 7. CFl thickness obtained by both manual and automatic methods for
blood flows of 5% hct and 10% hct, at the regions a1 and a2 of the microchannel network. the measured values are expressed as the means ± standard deviation according to a t-test analysis at a 95% confidence interval.
Figure 8. CFl thickness obtained by both manual and automatic methods for
blood flows of 5% hct and 10% hct, at the regions B1, B2, C1, C2, of the microchannel network.
note: the measured values are expressed as the means ± standard deviation according to a
t-test analysis at a 95% confidence interval.
Figure 9. CFl thickness obtained by both manual and automatic methods for
blood flows of 5% hct and 10% hct, at the regions d1, d2, e1, e2, e3, e4, F1 and F2 of the microchannel network.
note: the measured values are expressed as the means ± standard deviation according to a
network. Another interesting phenomenon was the clear ten-dency of the CFL to decrease with the increment of the Hct. This latter result corroborates the in vivo CFL measurements per-formed by Tateishi et al. (1994). Hence, this qualitative comparison shows that there are several similar CFL phenomena happening at both simple geometries and complex microchannel network. However, to acquire more detailed insights about the blood rhe-ological properties in microvascular networks, in the future it is important to compare our in vitro flow results with in vivo blood flows happening in micro-networks.
4. Conclusions
In the present work, we reported CFL layer measurements along a microfluidic network composed of several divergent and con-vergent bifurcations. The images were acquired by means of a role in microcirculation, several previous measurements of the
CFL thickness have been performed in microvessels (Kim et al. 2006, 2009) and microchannels (Leble et al. 2011; Garcia & Lima 2012; Sampaio et al. 2015) having simple geometries. Figure 11 shows a comparison between the current CFL measurements and some past results obtained at both in vivo (Tateishi et al. 1994; Kim et al. 2006, 2009; Ong et al. 2012; Dietzel et al. 2014; Namgung et al. 2014) and in vitro (Leble et al. 2011; Garcia & Lima 2012; Sampaio et al. 2015) environments.
Although the previous CFL measurements were not per-formed in micro-networks several similar qualitative features were found. For instance, all past studies have shown that the CFL thickness is diameter dependent as the CFL enhances as the diameter increases. In present study, this phenomenon was also observed along the network. It was found that the lowest CFL values occurred at the smaller dimensions of the microchannel
Figure 10. linear regression analyses for both automatic and manual methods at two different hcts: (a) 5% hct; (b) 10% hct.
Figure 11. Comparison between the CFl manual and automatic measurements obtained by present study and the previews results obtained at in vivo and in vitro
environments.
8 D. BENTO ET AL.
Notes on contributors
D Bento is a PhD student at Porto University in the area of Mechanical Engineering. His principal research interests are microfluidic network and microcirculation.
Ana I Pereira is Coordinator Professor in Department of Mathematics at Polytechnic Institute of Bragança, and she is a member of Algorithm Research Centre – Minho University. Her principal research interests are mathematical models and numerical optimization.
J Lima is an assistant professor in Electrotechnics Department at Polytechnic Institute of Bragança, and he is a member of INESC TEC – Porto Research Centre. His principal research interests are robotics and image analysis.
J M Miranda is a researcher at University of Porto Engineering Faculty and a member of CEFT Research Centre. His principal research interests are micro-fluidics, cell adhesion, multiphase flows and biomimetic fluids.
R Lima is an assistant professor in Mechanical Engineering Department at University of Minho, and he is a member of MEtRiCS and CEFT Research Centre. His principal research interests are biomicrofluidics, nanofluids and thermofluids.
References
Abramoff M, Magelhaes P, Ram S. 2004. Image processing with imageJ. Int J Biophoton. 11:36–42.
Bento D, Lima R, Miranda JM. 2015. Computation of a three-dimensional flow in a square microchannel: a comparison between a particle method and a finite volume method. Micro Nanosyst. 7:142–147.
Bento D, Sousa L, Yaginuma T, Garcia V, Lima R, Miranda JM. 2017. Microbubble moving in blood flow in microchannels: effect on the cell-free layer and cell local concentration. Biomed Microdevices. 19(1):6. Björnmalm M, Yan Y, Caruso F. 2014. Engineering and evaluating drug
delivery particles in microfluidic devices. J Control Release. 190:139–149. D’Apolito R, Taraballi F, Minardi S, Liu X, Caserta S, Cevenini A, Tasciotti E,
Tomaiuolo G, Guido S. 2016. Microfluidic interactions between red blood cells and drug carriers by image analysis techniques. Med Eng Phys. 38:17–23.
Dietzel S, Pircher J, Nekolla AK, Gull M, Brändli AW, Pohl U, Rehberg M.
2014. Label-free determination of hemodynamic parameters in the microcirculation with third harmonic generation microscopy. PLoS ONE. 9:e99615.
Faustino V, Catarino SO, Lima R, Minas G. 2016. Biomedical microfluidic devices by using low-cost fabrication techniques: a review. J Biomechanics. 49(11):2280–2292.
Fedosov DA, Caswell B, Popel AS, Karniadakis GE. 2010. Blood flow and cell-free layer in microvessels. Microcirculation. 17:615–628.
Fung Y. 1997. Biomechanics. 2nd ed. New York (NY): Springer-Verlag. Gambaruto AM. 2015. Computational haemodynamics of small vessels
using the moving particle semi-implicit (MPS) method. J Comput Phys. 302:68–96.
Garcia V, Dias R, Lima R. 2012. In vitro blood flow behaviour in microchannels with simple and complex geometries. In: Naik GR, editor. Applied biological engineering – principles and practice. Rijeka: InTech; p. 393– 416.
Ishikawa T, Fujiwara H, Matsuki N, et al. 2011. Asymmetry of blood flow and cancer cell adhesion in a microchannel with symmetric bifurcation and confluence. Biomed Microdevices. 13:159–167.
Kim KC. 2013. Advances and applications on micro-defocusing digital particle image velocimetry (μ-DDPIV) techniques for microfluidics. J Mech Sci Technol. 26:3769–3784.
Kim S, Kong RL, Popel AS, Intaglietta M, Johnson PC. 2006. A computer-based method for determination of the cell-free layer width in microcirculation. Microcirculation. 13:199–207.
Kim S, Ong PK, Yalcin O, Intaglietta M, Johnson PC. 2009. The cell-free layer in microvascular blood flow. Biorheology. 46:181–189.
Leble V, Lima R, Dias R, et al. 2011. Asymmetry of red blood cell motions in a microchannel with a diverging and converging bifurcation. Biomicrofluidics. 5:044120–4412015.
high-speed video microscopy system and the CFL layer results were obtained from a well-established manual method and an automatic image-processing method developed in a MATLAB environment. The CFL measurements were performed for two different concentrations of RBCs, i.e. 5 and 10% Hct. Overall, the results have shown that the cells concentration, channel size and topology of the tested microfluidic network affect the dynamic behaviour of the CFL layer. It was observed that the CFL thickness decreases as the fluid flows through a microchannel network composed with successive smaller channels. Moreover, measurements with different concentrations have shown that the CFL thickness increases with the decrease of the Hct. These observations obtained by both manual and automatic methods, are in close agreement with in vivo measurements performed in microvessels composed by simple geometries. Additionally, qualitative results have shown that the bifurcations with differ-ent widths promote an uneven distribution of RBCs throughout the microchannel network. However, our results indicate that this local Hct heterogeneity tends to recover to its initial feed Hct conditions at the outlet parent microchannel. A key feature of the present work is the observation of clear and distinctive CFL along the lower and upper walls of the microchannel net-work. However, in contrast with some past in vitro studies, no cell-depleted zone was observed at the regions immediately downstream of the confluences. One possible explanation of this divergence could be due to the different dimensions and geometries used in the current study.
Regarding the proposed automatic method, its simplicity and fast image processing may prove useful to determine the CFL thickness in a fast and automatic way. However, and like other automatic methods the one tested in the present study depends on the image quality, particularly on the contrast and intensity of the pixels between the microchannel wall and RBC core. Hence, we believe that automatic methods need always to be calibrated by manual methods, especially at moderate and high Hct, i.e. for Hcts bigger than 10%.
The influence of the CFL in the microcirculation system needs to be better understood. The results obtained by the present study not only provide new findings related to the CFL variation along a microchannel network but also will help to validate and develop more realistic multiphase numerical models of blood flowing through microvascular networks.
Disclosure statement
No potential conflict of interest was reported by the authors.
Funding
Pinho D, Yaginuma T, Lima R. 2013. A microfluidic device for partial cell separation and deformability assessment. BioChip J. 7:367–374.
Pinho D, Rodrigues RO, Faustino V, Yaginuma T, Exposto J, Lima R. 2016. J Biomech. 49:2293–2298.
Pinto E, Faustino V, Rodrigues R, et al. 2014. A rapid and low-cost nonlithographic method to fabricate biomedical microdevices for blood flow analysis. Micromachines. 6:121–135.
Pitts KL, Fenech M. 2013. High speed versus pulsed images for micro-particle image velocimetry: a direct comparison of red blood cells versus fluorescing tracers as tracking particles. Physiol Measurement. 34:1363– 1374.
Popel AS, Johnson PC. 2005. Microcirculation and hemorheology. Annu Rev Fluid Mech. 37:43–69.
Rodrigues RO, Pinho D, Faustino V, Lima R. 2015. A simple microfluidic device for the deformability assessment of blood cells in a continuous flow. Biomed Microdevices. 17:42.
Rodrigues RO, Bañobre-López M, Gallo J, Tavares PB, Silva AMT, Lima R, Gomes HT. 2016. Haemocompatibility of iron oxide nanoparticles synthesized for theranostic applications: a high-sensitivity microfluidic tool. J Nanoparticle Res. 18(7):034011.
Saadatmand M, Ishikawa T, Matsuki N, et al. 2011. Fluid particle diffusion through high-hematocrit blood flow within a capillary tube. J Biomech. 44:170–175.
Sampaio D, Lopes D, Semiao V. 2015. Horse and dog blood flows in PDMS rectangular microchannels: experimental characterization of the plasma layer under different flow conditions. Exp Thermal Fluid Sci. 68:205–215. Sbalzarini IF, Koumoutsakos P. 2005. Feature point tracking and trajectory
analysis for video imaging in cell biology. J Struct Biol. 151:182–195. Sherwood JM, Kaliviotis E, Dusting J, Balabani S. 2014. Hematocrit, viscosity
and velocity distributions of aggregating and non-aggregating blood in a bifurcating microchannel. Biomech Model Mechanobiol. 13:259–273. Taboada B, Monteiro FC, Lima R. 2015. Tracking red blood cells flowing
through a microchannel with a hyperbolic contraction: an automatic method. Comput Methods Biomech Biomed Eng: Imaging Vis. 19:105– 119.
Tateishi N, Suzuki Y, Soutani M, Maeda N. 1994. Flow dynamics of erythrocytes in microvessels of isolated rabbit mesentery: cell-free layer and flow resistance. J Biomech. 27:1119–1125.
Tripathi S, Bala Varun Kumar YV, Prabhakar A, Joshi SS, Agrawal A. 2015. Passive blood plasma separation at the microscale: a review of design principles and microdevices. J Micromech Microeng. 25:8.
Wereley ST, Meinhart CD. 2010. Recent advances in micro-particle image velocimetry. Ann Rev Fluid Mech. 42:557–576.
Williams SJ, Park C, Wereley ST. 2010. Advances and applications on microfluidic velocimetry techniques. Microfluid Nanofluid. 8:709–726. Yaginuma T, Oliveira MSN, Lima R, Ishikawa T, Yamaguchi T. 2013. Human
red blood cell behavior under homogeneous extensional flow in a hyperbolic-shaped microchannel. Biomicrofluidics. 7:054110.
Yin X, Thomas T, Zhang J. 2013. Multiple red blood cell flows through microvascular bifurcations: cell free layer, cell trajectory, and hematocrit separation. Microvasc Res. 89:47–56.
Lima R, Wada S, Tsubota K-I, Yamaguchi T. 2006. Confocal micro-PIV measurements of three-dimensional profiles of cell suspension flow in a square microchannel. Measurement Sci Technol. 17:797–808.
Lima R, Wada S, Takeda M, Tsubota K, Yamaguchi T. 2007. In vitro confocal micro-PIV measurements of blood flow in a square microchannel: the effect of the haematocrit on instantaneous velocity profiles. J Biomech. 40:2752–2757.
Lima R, Wada S, Tanaka S, Takeda M, Ishikawa T, Tsubota K, Imai Y, Yamaguchi T. 2008. In vitro blood flow in a rectangular PDMS microchannel: experimental observations using a confocal micro-PIV system. Biomed Microdevices. 10:153–167.
Lima R, Ishikawa T, Imai Y, Takeda M, Wada S, Yamaguchi T. 2009. Measurement of individual red blood cell motions under high hematocrit conditions using a confocal micro-PTV system. Ann Biomed Eng. 37:1546–1559. Lima R, Nakamura M, Omori T, Ishikawa T, Wada S, Yamaguchi T. 2009.
Microscale flow dynamics of red blood cells in microchannels: an experimental and numerical analysis. Adv Comput Vision Med Image Process. 203–220.
Lima R, Ishikawa T, Imai Y, Yamaguchi T. 2012. Blood flow behavior in microchannels: past, current and future trends. In: Dias R, Martins AA, Lima R, Mata TM, editors. Single and two-phase flows on chemical and biomedical engineering. Sharjah: Bentham Science; p. 513–547.
Mchedlishvili G, Maeda N. 2001. Blood flow structure related to red cell flow: determinant of blood fluidity in narrow microvessels. Jpn J Physiol. 51:19–30.
Mehri R, Laplante J, Mavriplis C, Fenech M. 2014. Investigation of blood flow analysis and red blood cell aggregation. J Med Biol Eng. 34(5):469–474. Meijering E, Smal I, Danuser G. 2006. Tracking in molecular bioimaging. IEEE
Signal Process Mag. 23:46–53.
Nakamura M, Bessho S, Wada S. 2013. Spring-network-based model of a red blood cell for simulating mesoscopic blood flow. Int J Numer Method Biomed Eng. 29:114–128.
Namgung B, Liang LH, Kim S. 2014. Physiological significance of cell-free layer and experimental determination of its width in microcirculatory vessels. In: Lima R, Imai Y, Ishikawa T, Oliveira MSN, editors. Visualization and simulation of complex flows in biomedical engineering. Dordrecht: Springer; p. 75–87.
Namgung B, Sakai H, Kim S. 2015. Influence of erythrocyte aggregation at pathological levels on cell-free marginal layer in a narrow circular tube. Clin Hemorheol Microcirc. 61:445–457.
Ong PK, Jain S, Namgung B, Woo YI, Kim S. 2011. Cell-free layer formation in small arterioles at pathological levels of erythrocyte aggregation. Microcirculation. 18:541–551.
Ong PK, Jain S, Namgung B, et al. 2011. An automated method for cell-free layer width determination in small arterioles. Physiol Meas. 32:N1–N12. Ong PK, Jain S, Kim S. 2012. Spatio-temporal variations in cell-free layer
formation near bifurcations of small arterioles. Microvasc Res. 83:118– 125.
Oulaid O, Zhang J. 2015. Cell-free layer development process in the entrance region of microvessels. Biomech Model Mechanobiol. 14:783–794. Pinho D, Gayubo F, Pereira AI, Lima R. 2012. Automatic tracking of labeled