_______________________________________________________________________________________________ “NOTICE: this is the author’s version of a work that was accepted for publication in BioChip Journal. Changes resulting from the publishing process, such as peer review, editing, corrections, structural formatting, and other quality control mechanisms may not be reflected in this document. Changes may have been made to this work since it was submitted for publication. A definitive version will be subsequently published in BioChip Journal, [Vol.7(4), pp.367‐374, (2013)].”
_______________________________________________________________________________________
A Microfluidic Device for Partial Cell Separation and Deformability
Assessment
Diana Pinho1, 2, Tomoko Yaginuma1 & Rui Lima*1, 2
1 Polytechnic Institute of Bragança, ESTiG/IPB, C. Sta. Apolonia, 5301-857 Bragança, Portugal.
2 CEFT, Faculdade de Engenharia da Universidade do Porto (FEUP), R. Dr. Roberto Frias, 4200-465 Porto, Portugal. * Correspondence and requests for materials should be addressed to R. Lima ([email protected])
Abstract Blood flow in microcirculation shows several interesting phenomena that can be used to develop microfluidic devices for blood separation and analysis in continuous flow. In this study we present a novel continuous microfluidic device for partial extraction of red blood cells (RBCs) and subsequent measurement of RBC deformability. For this purpose, we use polydimethylsiloxane (PDMS) microchannels having different constrictions (25%, 50% and 75%) to investigate their effect on the cell-free layer (CFL) thickness and separation efficiency. By using a combination of image analysis techniques we are able to automatically measure the CFL width before and after an artificial constriction. The results suggest that the CFL width increases with enhancement of the constriction and contributes to partial cell separation. The subsequent measurements of RBCs deformation index reveal that the degree of deformation depends on the constriction geometries and hematocrit after the cell separation module. The proposed microfluidic device can be easily transformed into a simple, inexpensive and convenient clinical tool able to perform both RBC separation and deformability analysis in one single device. This would eliminate the need for external sample handling and thus reducing associated labor costs and potential human errors.
Keywords: Biomicrofluidics, Microfluidic devices, Microcirculation, Blood on chips, Red blood cells, Cell separation, Cell deformability, Deformation index.
Introduction
Cell separation and identification are essential in a variety of biomedical applications including cell biology, diagnostic and therapeutic methods. Blood is a non-Newtonian fluid containing extremely rich amount of information about the physiological and pathological state of the human body. However, due to its complexity there are few accurate analysis methods. Most of the standard techniques used cell separation and sorting are often labor intensive or require additional external labels to identify cells.
Recently, Ishikawa et al. [10] and Leble et al. [11] have shown the existence of thin CFL in the centre of the microchannel, just downstream of a confluence. This phenomenon is due to the existence of a CFL in both inner walls and a consequent formation of a triangular CFL in the region of the confluence apex [10, 11]. Faivre et al. [12] and Sollier et al. [13] have demonstrated that the CFL could be enhanced by using a microchannel containing a constriction followed by sudden expansion to separate plasma from the whole in vitro blood. However, most of these studies aim at the complete extraction of cells from plasma, which is not the case of the present study.
The main objective of the proposed microfluidic device is to separate certain amount of RBCs from plasma and then measure the deformability of individual RBCs downstream in one single step. RBC deformability is important in a clinical sense as it is related to several diseases such as diabetes, malaria, as well as cardiovascular disorders [14]. These diseases are at times fatal and early detection is crucially preferable. In this sense, RBC deformability can be a new biomarker and the fast and easy measurement methods are required. Former studies on RBC deformability have introduced some methodologies such as micropipette aspiration and optical tweezers where basically RBCs are stretched and the pressure or force for their extension is measured [15, 16]. Whilst these studies have revealed useful RBCs mechanical properties, these methods reqire large amount of preparation and are very time consuming. For fast analysis of vast amount of blood samples, these traditional measurement methods are unlikely to be appropriate. Moreover, since the preceded cell separation process is needed, the microfluidic devices which are easy to manipulate their microchannel geometries are more suitable for our purposes. A typical microdevice for RBC deformation studies uses a microchannel having a shape of sudden constriction in order to elongate cells. Zhao et al. [17] used a straight microchannel with a sudden narrowing and expanding constriction. Lee et al. [18], Yaginuma et al. [19-20] and Faustino et al. [21], on the other hand, used microchannels with a hyperbolic shape contraction followed by a sudden expansion region. These microfluidic experiments showed high deformability of RBCs when travelling through a contraction region. However, those studies did not include the preceded cell separation process as they have solely performed deformability measurements after an additional sample preparation [19-21].
The proposed microfluidic device aims to obtain a CFL with a low enough RBC concentration to perform cell deformability measurements downstream the separation constriction. This study is divided in two main parts. Firstly, a simple microfluidic device with different constrictions (25%, 50% and 75%) is used to test the RBCs separation. Secondly, a more complex device, able to perform in a single step both RBC separation and deformability analysis, was tested. This first tentative to integrate in one single device both tasks of separation and deformation have shown not only the viability of this new clinical strategy but also new findings that will be crucial to optimize the design for this kind of microfluidic device.
Materials and methods
Working fluids
The working fluid used in this study was dextran 40 (Dx40) containing about 9% (i.e. Hematocrit, Hct = 9) by volume of human RBCs. More details can be found in Supplementary Materials.
Microdevice geometries
The microfluidic devices tested in this study were fabricated using a soft lithography technique and consist of two main parts: a cell separation region and a cell deformation region. The microchannel height was measured by a profilometer to be 51 m.
Fabrication of the microfluidic devices
temperat micro-pi slide gla Cell sepa To study different of a strai and 25 test the R Cell sepa To inves microflu tested. N device h different dimensio
Figure
Experime In this s system a Contracti In this st ( ) of t different was defi Note tha respectiv To analy constrict constrict upstream
ture and the ipette tips. F ass, where a r aration(CS) m y the effect o t constriction ight microch
m wide ( RBCs separa aration and de stigate the ab uidic device h Note that thi had feed mic
t kind of co ons can be se
e 1. Schemati
ental set-up study we hav and the imag tion ratio, CFL
tudy we used the constritio t artificial co ined as follow
at, the of vely.
yze the CFL tions, as sho tion, and the m and downs
PDMS was Finally, the P reversible sea microfluidic de
of a single c n sizes was d hannel with 1 ). Figure 6a ation.
eformation (C bility to perfo having a cel s latter regio crochannel o
nstrictions t een in Figure
ic view of th
ve used a hig e analysis pr FL thickness a d microchann ons varying f onstrictions (
ws:
f the constric
L thickness, ow in Figur e CFL to the
tream of the
peeled from PDMS was w al formed sp evice
constriction o developed. T 100 m wide shows the m
CSD) microflu orm in a sing l separation on has a con of 100 m (
o perform R e 1 in supplem
e contraction
gh-speed vid rocedure are
nd deformatio nels with the from 25 m, 25%, 50% a
ctions 25 m
measureme re 7. CFL
e thickness d constriction
∆
m the master. washed with pontaneously
on the cell s This first dev e ( ) with d microfluidic
uidic device gle step both
region follow ncentration o
), a const RBC deform mentary mat
n-expansion
deo microsco explained in on index (DI) e width ( )
50 m, up t and 75%) on
m, 50 m an
ents were tak corresponds downstream n was given b
The input/ou ethanol and y.
separation, a vice had only different cons device with
RBC separa wed by an o of cells lowe triction of 50 mability. Mor terials. geometry, id opy system. n supplement )
of the feed to 75 m. To the CFL thi
(1)
nd 75 m co
ken upstream s to the thic
the constric by:
(2)
utput ports a brought into
a simple mic y a separation
striction regi the different
ation and defo utlet cell def er than the f 0 % ( re detailed in
dentifying the
The details tary material
channel of 1 o examine the
ckness, the c
orresponds to
m and down ckness of the ction. The di
are made by o contact wit
crofluidic dev n region that ions of 75 m t contraction
formability an formation re feed Hct. Th
50 m) foll nformation a
he relevant va
s of the expe ls.
100 m and t e effect of th contraction r
o 0.25, 0.5 a
nstream the he CFL upst difference of
means of th a clean
vice with t consists m, 50 m ns used to
nalysis, a egion was his tested lowed by about the ariables. erimental the width hese three ratio ( )
and 0.75,
artificial tream the
For char
Note tha length er (≪ 1µm
Results
CS micro In the C conseque and 0.75 Quali Furtherm To obtai thicknes rates (se Figure 2 flow rate
r = 0.75 Overa that all t clear tha 0.25 whe show a t results o tendency
racterizing de
at Lmajor and rror which m m) throughout
s
ofluidic device CS device w
ently on the 5), at a Hct of
itative flow more, it is cle
in more det s were taken e Figure 2).
2. CFL thick es (1 μl/min, 5).
all the quant the constrict at the CFL ere CFL is tendency of obtained usin y is more pro
eformability
Lminor are th might be caus t the measure
e: constriction we have ev separation e f 9% and wit w visualizati
ear that the e tail results a n both upstre
kness for both , 5 μl/min an
titative meas tions tested
increases w about three the CFL thi ng a microcha
onounced for
of RBCs, we
he major and sed by the ca ed regions so
n effect in the valuated the
effectiveness th three diffe on results enhancement about the con
am ( CFL ) a
h upstream ( nd 10 μl/min
surements of enhance the with decreasin
orders of ma ickness to de annel with si r r = 0.5 an
e use deform
d minor axis amera’s expo o that these p
e CFL thickne effect of t s. This study erent flow rat show that t is more pro
nstriction ef and downstre
( CFL ) and n) and differe
f the CFL th e CFL thickn ng r and th agnitude grea ecrease with imilar constr nd 0.75. mation index (3)
lengths of t osure time bu possible devi
ess
the constrict y was perfor tes (1 μl/min all constric onounced for ffect, quantit
eam CFL
downstream ent constricti
hickness, pre ness at down
his enhancem ater than the
increasing f rictions and a
(DI) which i
the RBC. W ut the values ation was ign
tion on the rmed with di n, 5 μl/min an ctions enhan
the microch tative measu the constrict
CFL con
ion ratios (r
esented in Fi nstream regi ment is more
CFL . Addi flow rate, wh a Hct of 2.6%
is defined as
We also calcu were suffici nored.
CFL thick different ( nd 10 μl/min nce CFL t hannel with r urements of tions at diffe
nstrictions at = 0.25, r
igure 2, show ion CFL . e pronounced itionally, the
hich corrobo % [12]. Note
follows. ulated the ently low ness and (0.25, 0.5 n). thickness.
r = 0.25. the CFL erent flow
different =0.5 and
CSD mic Downstr microcha different were tes upstream used. The H them sta microcha to be sm axial DI contracti sudden n parachut Figure 3 shear str variable meaning ideal for has to be
Figur for defor type of c more do good im this cond
Figure 3 contracti
crofluidic devi ream the C annel as sho t constriction sted in orde m constrictio Hct at this re art becoming
annel with a maller of the
values of on ion entrance narrowing of te, reaching 3a.) The sud ress. Howev
and the def g for the ellip
r deformation e carefully do re 3b shows
rmability me constriction, ominant over mage analysis dition is idea
3. DI values ion.
ice: constricti CS region, R
own in Figu n regions, on er to examin n (CS region egion should g like a parac width of 7 normal size ne individua (x/Lc=0), th f the flow fi
a low DI va den contract ver, proceede finition of m
psoid shape. n measureme one in the up the DI value easurement.
in the middl r shear force, s results it is al.
s of a single
ion effect and RBC deform ure 1 in sup ne with a su ne efficient n) with = d be around 2 chute or umb
m. This RB of human R al RBC flowi he highest D eld. Then th alue at the e tion is effect ed DI value ajor and min
Besides this ents especial pper stream.
es of one sin It is clear th le of the mic , where RBC s important t
e RBC flow
d deformation mation mea pplementary udden contrac
deformabilit 0.5, an inlet 2.4% and R brella shape w BC deformati RBC (8 m) a
ing through DI was obtain he RBC start
exit of the co tive to obser es are slightl nor axis of t s, overlaps o lly when an
ngle RBC flo hat the high crochannel (y Cs tend to flo to measure R
wing through
measuremen surement re materials. I ction and an ty measurem t Hct of 9%, RBCs tend to when they p on behaviou and to the sh
the sudden c ned due to a ts changing t ontraction (x rve a strong ly unreliable the cell in th of the cells w
automatic m
owing throug hest DI is ob
y=0 and z=0 ow stably wi RBCs flowin
h (a) a sudde nts
egion is fol In this study nother with a ments. For th
, and a flow o flow in line ass through a r is mainly d hear flow. Fi constriction
strong shear their shape f x/Lc=1, see deformation e as parachu his shape doe were often ob method is app
gh the smoo served aroun 0) extensiona
ith no rotatio ng in the sam
en contractio
llowed in t y, two geom a smooth con this examina
rate of 1 μl e and the ma a sudden con due to the con igure 3a show
microchanne r stress cause from an ellip
also the ima n of RBCs w ute shapes a
es not have bserved, whi plied. The Hc
oth contractio nd x/Lc= 0. al force is lik
on or orienta me orientatio
on and (b) a
the same metrically ntraction, ation, the /min was ajority of nstriction nstriction ws the x-el. At the ed by the psoid to a age IV in with high are rather the same ich is not ct control
on region 5. In this kely to be ation. For on so that
Figure 4 flow rate
Figure 5 measure confiden
Discuss
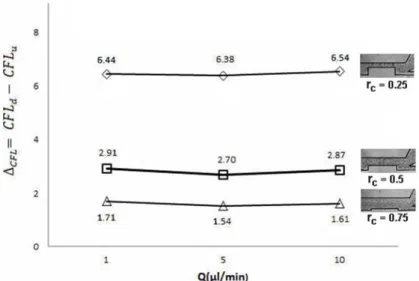
To analy the ∆ increases is about worth m For r = higher fl CFL thic Figur for r = remainin image an consider4. The differ es and differe
5. Separation d values are nce interval.
sion
yse in more d for each co s with decrea
two to four o mentioning th
0.5 and r = low rates. Ho ckness (see F re 5 shows th 0.5 this co ng 27% of c nalysis appro red that all th
rence of the ent constricti
n rate of the expressed as
detail the effe onstriction a
asing the r orders of ma
at the highes = 0.25 for lo owever these Figure 5). he separation onstriction c cells to the d oach used to he white par
CFL upstrea ion ratios (r
RBCs flowi s the mean ±
fect of the art s a function and this en agnitude grea st ∆ cor ow flow rate e results show n rate of cells can efficientl deformation
calculate the rt, upstream
am and down = 0.25, r
ing to the ou ± standard de
tificial constr n of the flow nhancement i
ater than ∆ rresponds to e there is a t w evidence t s flowing to t
ly separate region. This e CFL thickn the constrict
nstream of th 0.5 and r 0
utlet region n eviation acco
rictions on th w rate. These is more pron
for r = 0.
r = 0.25 an tendency to that the const the outlet reg about 73% s separation ness. Briefly, tion, corresp
he constrictio 0.75).
number 2 (up ording to a t-t
he CFL thick e results sho ounced for r 5 and r = 0. nd is indepen decrease bu triction has a gion number
of blood ce estimation i , we have us onds to a un
on (∆ ) at
pper side ou test analysis
kness, Figure ow clearly th
r = 0.25 wh .75, respectiv ndent of the f ut tend to fla a strong imp r 2 (see Figur
ells to regio is based on sed binary im
niform distri
different
tlet). The at a 95%
e 4 shows hat ∆ here ∆
the RBC were abl constrict shown a Hence, w
r = 0.5 decided single st feed Hct recently, contracti rate shou the geom local Hc
Figure 6 separatio
m, resp of deform The heig
Figure 7 contracti
Cs core to be le to estimat tion with hig a significant
we believe th 5 is by decre to use the co ep both sepa t to be abou , by using ions [20]. In uld be aroun metrical para cts less than 1
6. Schematic on part. The pectively. Th mation meas ght of the mic
7. Mean DI ions.
e 100%. Hen te the separa gher efficien difference b hat the most easing the ge onstriction w aration and d ut 9%, the lo
1% Hct we n order to a nd 90% and ameter L2, to
1%.
c drawing of dimensions he different c surement par crochannel i
values of tw
nce, by meas ation rate dep ncy was the between r = effective wa eometrical pa with r = 0.5 t
deformation o ocal Hct in t have succe chieve 1% H
consequentl o a dimensio
f the microflu of L , L , w constrictions rt. The dime s 51 µm.
wo deformatio
suring the CF pending on
one with r = 0.25 and ay to get a co
arameter L2 to test the ab of blood cell
the outlet 3 essfully mea Hct with the ly r must be on less than
uidic device.
w , w , w , were used ( ensions of w
on measurem
FL thickness the size of t
r = 0.25. A
r = 0.75, t onsiderable d
(see Figure bility of the p s. Note that
(deformatio asured the R e proposed m e less than 0 100 µm, it w
. (a) the entir are 300 m,
= 75 m
w and w are
ment module
s downstream he constricti Although stat this is not th difference be 6). In the pr proposed dev for r = 0.5 n region) is RBC deforma microfluidic d 0.25. Alterna
will be possi
re view and 100 m, 10 , 50 m and e 7 m and
es: (a) a sudd
m the constri ion. As expe tistical analy he case for r etween r = resent study vice to perfor and by cons around 2.4% mability in hy
device the s atively, by de
ible to achie
close-up vie 00 m, 80 m
25 m). (b) 10 m, resp
den and (b)
iction we ected, the ysis have
r = 0.5. 0.25 and we have rm in one sidering a %. Very yperbolic eparation ecreasing eve easily
ew of cell m and 20 the view pectively.
In terms of the deformation measurements, Figure 7 shows average DI values of ten RBCs flowing through the two different constriction regions. The maximum DI value is in both cases relatively the same, however, for the sudden contraction case (a) the maximum DI is located close to the constriction entrance whereas for the smooth case (b) the maximum DI is located around the middle of the constriction. In addition, in the constricted region in (a) RBCs tend to flow as parachute like shape and the DI values are not truly comparative in the sequence of cell behaviour throughout the deformation analysis region of the device. At least, the region for measurements has to be carefully selected for a meaningful comparison. On the other hand, the smooth contraction provides less deviation of DI results and indicates clearly an appropriate measurement region (x/Lc=0.5), i. e., middle of constriction. The majority of the cells are flowing with the same orientation at the centreline of the channel where the cells are under an extensional flow dominated regime and as a result they tend to elongate in y direction induced mainly by this extensional force. This stable state of the RBCs makes this geometry suitable to measure small changes of RBC deformability. More detailed studies on RBCs extensional flow effects can be found elsewhere [19-21].
As mentioned before, by using a constriction with r = 0.5, we have observed collisions and the overlap of neighbouring cells flowing within the measurement region. In the CS region, the Hct of the flowing fluid is reduced from 9% to ≈2.4% but ideally it needs to be less than that. Nevertheless, it is worth mentioning that by reducing Hct to less than 2% the number of RBCs to measure may not be large enough to obtain a significant statistical picture of the results. Therefore, an optimization of channel, i.e. change in depth, needs to be done in order to obtain the best representative results of the RBCs DI.
Conclusions
The conventional microfluidic methods for measuring RBC deformability are often labor intensive and require additional sample modification and preparation. In this paper, we present a new, simple microfluidic device able to perform both RBCs separation and deformability assessment in one single step. In general, our results indicate that the proposed device can perform both operations (separation and deformation) successfully. The reported results show evidence that the constriction has a strong impact on the CFL thickness and consequently on separation rate. Moreover, the deformability results show clearly that most appropriate geometry to measure RBC deformability is the microchannel containing a smooth constriction region. In this kind of geometry due to the existence of a dominant extensional force the majority of the RBCs tend to flow with the same orientation. This stable performance of the RBCs may prove to be enough sensitive to detect small changes of RBC deformability and thus it may have the ability to diagnose early stage RBC related diseases such as diabetes, malaria and sickle cell anemia. Therefore, the integrated and simple continuous system operations make the proposed microfluidic device a potential diagnostic technique to be applied to both healthy cells and blood cell diseases.
Acknowledgement
The authors acknowledge the financial support provided by 2007 Global COE Program “Global Nano-Biomedical Engineering Education and Research Network”, Japan and grant-in-Aid for Science and Technology BEB/108728/2008, BEB/105650/2008, PTDC/EME-MFE/099109/2008, PTDC/SAU-ENB/116929/2010 and scholarship SFRH/BD/89077 /2012 from FCT (Science and Technology Foundation), COMPETE, QREN and European Union (FEDER). The authors are also very grateful to Dr. Mónica Oliveira (Strathclyde University), Professor Takuji Ishikawa and Professor Takami Yamaguchi (Tohoku University) for their suggestions and support to this research work.
References
[1] Caro, C., Pedley, T., Schroter, R. & Seed, W. The Mechanics of the Circulation. Oxford University Press, 1978.
[2] Lima, R. et al. Measurement of individual red blood cell motions under high hematocrit conditions using a confocal micro-PTV system. Ann Biomed Eng. 37, 1546-59, (2009).
[4] Lima, R., et al. Axisymmetric polydimethysiloxane microchannels for in vitro hemodynamic studies.
Biofabrication, 1: 1-7, (2009).
[5] Goldsmith, H., & Spain, S. Margination of leukocytes in blood flow through small tubes. Microvasc Res, 27, 2, 204-222, (1984).
[6] Yang, S., Undar, A., & Zahn, J.D. A microfluidic device for continuous, real time blood plasma separation.
Lab Chip6:871, (2006).
[7] Shevkoplyas, S.S., Yoshida, T., Munn, L.L., & Bitensky, M.W. Biomimetic Autoseparation of Leukocytes from Whole Blood in a Microfluidic Device. Anal Chem, 77, 933-937, (2005).
[8] Hou, H.W., et al. Deformability based cell margination - A simple microfluidic design for malaria-infected erythrocyte separation. Lab Chip, 10, 2605–2613, (2010).
[9] Fujiwara, H., et al. Red blood cell motions in high-hematocrit blood flowing through a stenosed microchannel. J Biomech42, 838-843, (2009).
[10] Ishikawa, T., et al. Asymmetry of blood flow and cancer cell adhesion in a microchannel with symmetric bifurcation and confluence. Biomed Microdevices,13, 159, (2011).
[11] Leble, V., et al. Asymmetry of red blood cell motions in a microchannel with a diverging and converging bifurcation. Biomicrofluidics, 5, 044120, (2011).
[12] Faivre, M., Abkarian, M., Bickraj, K. & Stone, H. Geometrical focusing of cells in a microfluidic device: an approach to separate blood plasma. Biorheology,43, 147-159, (2006).
[13] Sollier, E., Cubizolles, M., Fouillet, Y. & Achard J. Fast and continuous plasma extraction from whole human blood based on expanding cell-free layer devices. Biomed Microdevices, 12, 485-97, (2010).
[14] Mokken, F.C., Kedaria, M., Henny, C.P., Hardeman, M.R., & Gelb, A.W. The clinical importance of erythtrocyte deformability, a hemorrheological parameter. Ann Hematol,64, 113-122, (1992).
[15] Musielak, M. Red blood cell deformability measurement: Review of techniques. Clin Hemorheol Micro,42, 47–64, (2009).
[16] Shiga, T., Maeda, N., & Kon, K. Erythrocyte rheology. Crit Rev Oncol Hemat, 10: 9-48, (1990).
[17] Zhao, R., et al. Microscopic investigation of erythrocyte deformation dynamics. Biorheology, 43(6), 747-765, (2006).
[18] Lee, S.S., Yim, Y., Ahn, K.H., & Lee, S.J. Extensional flow-based assessment of red blood cell deformability using hyperbolic converging microchannel. Biomed Microdevices, 11, 1021-1027, (2009).
[19] Yaginuma, T., Oliveira, M.S.N., Lima, R., Ishikawa, T., & Yamaguchi, T. Red blood cell deformation in flows through a PDMS hyperbolic microchannel, Proceedings of NSTI-Nanotech, 2 505-507, (2011).
[20]Yaginuma, T., Oliveira, M.S.N., Lima, R., Ishikawa, T., & Yamaguchi, T. Human red blood cell behavior under homogeneous extensional flow in a hyperbolic-shaped microchannel. Biomicrofluidics, 7:054110, (2013).
[21] Faustino V., Pinho D., Yaginuma T., R. Calhelha, M. Oliveira, I. Ferreira, Lima R., Flow of red blood cells suspensions through hyperbolic microcontractions. Visualization and simulation of complex flows in biomedical engineering. In: R.Lima, T. Ishikawa, Y. Imai & M. S. N. Oliveira (Eds), Springer, 2013 (in press).
[22] Lima, R., Wada, S., Tanaka, S., Takeda, M., Ishikawa, T., Tsubota, K., Imai, Y., Yamaguchi, T., In vitro
blood flow in a rectangular PDMS microchannel: experimental observations using a confocal micro-PIV system.
Biomedical Microdevices, 10: 153-167, 2008.
[23] Lima, R., et al. Microscale flow dynamics of red blood cells in microchannels: an experimental and numerical analysis. In: Tavares and Jorge (Eds) Computational Vision and Medical Image Processing: Recent Trends, Springer 19, 297-309, (2011).
Supplementary Materials
1. MATERIALS AND METHODS
1.1. Working fluids
The working fluid used in this study was dextran 40 (Dx40) containing about 9% (i.e. Hematocrit (Hct = 9%). Briefly, blood was collected from a healthy adult volunteer and heparin was added in order to prevent coagulation. The red blood cells (RBCs) were separated from bulk blood by centrifugation and aspiration of the plasma and buffy coat. The RBCs were then washed twice with a physiological saline solution and diluted with Dx40 to make up the required RBC concentration. All blood samples were stored hermetically at 4ºC until the experiments were performed at controlled temperature of approximately 37ºC.
1.2. Fabrication of the microfluidic devices
The polydimethylsiloxane (PDMS) rectangular microchannels were fabricated using a soft lithographic technique. A detailed description of the fabrication process can be found elsewhere [22,
23]. Briefly, the microchannel geometry was drawn using Autocad, and a high resolution photomask was manufactured. The solid master was then fabricated on a silicon wafer with an ultrathick photoresist (SU-8 50; Kayaku MicroChem, Japan). The PDMS prepolymer was prepared by mixing a
comercial prepolymer and catalyzer (Silpot 184; Dow Corning, USA) at a weight ratio of 10:1. After
the mixture was degassed under vacuum, the PDMS was poured into the SU-8 photo-resist master
mold and cured by baking for about 2h at 70°C. Both master and PDMS were cooled to room
temperature and the PDMS was peeled from the master. The input/output ports are made by means of
micro-pipette tips. Finally, the PDMS was washed with ethanol and brought into contact with a clean
slide glass, where a reversible seal formed spontaneously.
1.3. Experimental set-up
The high-speed video microscopy system used in this study is shown in Figure 1. This system consisted mainly by an inverted microscope (IX71; Olympus, Japan) combined with a high-speed
camera (Phantom v7.1; Vision Research, USA). All the microfluidic devices were placed on the stage
of the inverted microscope and by using a syringe pump (KD Scientific, USA), a constant
Figure devices.
1.4. Ima
Cell sepa
All imag pixels, a with the
L/min. [24].
Figure 2 1 L/min
First, the with ma function region c converte
1. High-spe
age analysis
aration (CS)
ges were cap at a rate of 80
flow of RBC The record
2. Original im n.
e captured v aximum inten n, which resu
corresponds t ed to binary i
ed video m
) microfluidi
ptured around 000 frames/s Cs (halogen ded images w
mage with th
videos were nsity of all ults in a sing
to RBCs cor images with
icroscopy sy
ic device
d the middle s and an expo
illumination were transferr
he flow of RB
converted to the images le image hav re. To obtain thresholding
ystem used
e plane of the osure time o n) through a 2 rred to the co
BCs through
o a sequence in the stack ving a region n quantitativ g (see Figure
to test the
e microchann f 0.125 ms. F 25% constric omputer and
a 75% const
e of static im k was select
n brighter th ve measurem
3).
performance
nels with a re Figure 2 sho ction for a co
then evaluat
triction for a
mages (stack ed by using han the backg ments the gre
e of the mic
esolution of ows an origin onstant flow ated in Image
a constant flo
k). Then, eac g ImageJ “Z ground. This ey scale ima
crofluidic
800304 nal image w rate of 1 e J (NIH)
ow rate of
Figure 3 The chan
Cell sepa
RBC de contracti the regio flowing
Figure 4
Deforma
Deforma
where Lm like shap
3. Binary im nnel dimensi
aration and
eformation a ion region o on. Ten cell cells were m
4. Schematic
ation Index
ation Index (
major and Lmin
pe RBCs, we
mage obtaine ions are: w1 =
deformation
analysis has f the microc s were selec measured man
c diagram of
DI) is define
nor are the ma
e measured th
ed after imag = 100 m an
n (CSD) micr
been achiev hannel (W5 cted for each nually frame
RBC deform
ed as:
ajor and mino he major and
ge processing nd w2 = 25 m
rofluidic dev
ved by mea and W6 in Fi h contraction e by frame.
mation measu
or axis lengt d minor axis
g and binari m.
vice
asuring RBC igure 4), inc ns, and majo
urement regio
hs of the RB lengths as sh
zation using
C deformatio luding upstre or and mino
ons with deta
BC (see Figur hown in Figu
g “Image J”
on index (D ream and dow or axis length
ailed dimens
re 5a). For p ure 5b.
software.
DI) at the wnstream
hs of the
sions.
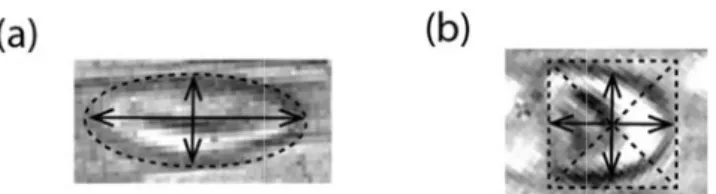
arachute-Figure 5 measure the majo The mea (NIH) [2 The 2D opened a flowing by the R RBC’s a it by the found to deviation
2. RESU Figure 6 measure
Figure 6 side) for
Figure 7 device u
5. Schematic ment of para or and minor asurements w 24]. We also
image cont and this shad
direction (y) RBC’s actual actual velocit e frame inter o be suffici ns were igno
ULTS 6 shows repr
ments obtain
6. Original b r different art
7 shows a re upstream the
c view of DI achute shape axes are def were done m
calculated th ains the flow dow should ). To avoid t velocity tim ty, we measu rval time. Th iently low ( ored.
resentative o ned at differe
blood flow v tificial constr
epresentative separation re
I measureme e cells. The b fined. manually wit
he length err wing cell’s s
not be consi this error the mes the expos
ured the trav he cell’s trav (≪ 1µm) th
original imag ent artificial c
isualization rictions (r =
e original im egion with r
ents. (a) the box surround
th the assista ror which mi
shadow whi idered as the e cell’s trave
sure time of veling length veling length hroughout th
ges and corre constrictions
images (left = 0.25, r = 0
mage of the = 0.5.
measuremen ding the cell
ance of an i ight be cause ich is captur e cell’s actua
ling length ( f the high spe h of the cells h values obt he measured
espondent bi s (r = 0.25, r
side) and co 0.5 and r = 0
deformation
nt of ellipsoi defines the c
mage handli ed by the cam red when the al length esp (shadow) in y eed camera. I frame by fra tained by the d regions so
inary images
r = 0.5 and
orrespondent 0.75).
region of th
id shape cell center of the
ing software mera’s expos e camera’s s pecially in th y-axis was c In order to o ame and then ese calculati o that these
s from in vit
r = 0.75).
t binary imag
he CSD mic
s. (b) the e cell and
e, ImageJ sure time. shutter is he axis of calculated obtain the n divided ons were possible
tro blood
ges (right
Figure 7 containin
Figure 8 The Hct the cell c
Figure 8 containin
7. Blood flow ng a sudden
8 shows a rep at this regio can be observ
8. Blood flow ng a smooth
w visualizati constriction
presentative on should be ved at the na
w visualizati constriction
ion images o microchanne
original ima e also around arrowest part
ion images o microchann
of the deform el with a wid
age of the de d 2.4%. In th t of the contr
of the deform nel with a wid
mation region dth of 7 m.
eformation r his contractio
raction.
mation region dth of 10 m
n of the CSD
egion with a on, the maxi
n of the CSD m.
D microfluid
a smooth con imum deform
D microfluid
dic device
ntraction. mation of