Repositório ISCTE-IUL
Deposited in Repositório ISCTE-IUL: 2019-12-12
Deposited version: Post-print
Peer-review status of attached file: Peer-reviewed
Citation for published item:
Vong, A. P. I. & Trigueiros, D. (2017). Evidence on the effect of Claw-Back provisions on IPO share allocation and underpricing in Hong Kong. Applied Economics. 49 (51), 5231-5244
Further information on publisher's website: 10.1080/00036846.2017.1302067
Publisher's copyright statement:
This is the peer reviewed version of the following article: Vong, A. P. I. & Trigueiros, D. (2017). Evidence on the effect of Claw-Back provisions on IPO share allocation and underpricing in Hong Kong. Applied Economics. 49 (51), 5231-5244, which has been published in final form at
https://dx.doi.org/10.1080/00036846.2017.1302067. This article may be used for non-commercial purposes in accordance with the Publisher's Terms and Conditions for self-archiving.
Use policy
Creative Commons CC BY 4.0
The full-text may be used and/or reproduced, and given to third parties in any format or medium, without prior permission or charge, for personal research or study, educational, or not-for-profit purposes provided that:
• a full bibliographic reference is made to the original source • a link is made to the metadata record in the Repository • the full-text is not changed in any way
The full-text must not be sold in any format or medium without the formal permission of the copyright holders.
Serviços de Informação e Documentação, Instituto Universitário de Lisboa (ISCTE-IUL) Av. das Forças Armadas, Edifício II, 1649-026 Lisboa Portugal
Phone: +(351) 217 903 024 | e-mail: administrador.repositorio@iscte-iul.pt https://repositorio.iscte-iul.pt
Evidence on the effect of “Claw-Back” provisions on IPO share
allocation and underpricing in Hong Kong
Anna P. I. Vonga,* and Duarte Trigueirosb aUniversity of Macau
bUniversity Institute of Lisbon
Abstract
The paper examines share allocation practices of over 300 initial public offerings (IPO) in Hong Kong during the years immediately following the enacting of a “Claw-Back” provision for IPO share reallocation. The examination of exhaustive micro-level data reveals that small (uninformed, retail) investors earn higher initial returns than large investors. Before the enacting of the “Claw-Back” provision, small investors were unfavorably treated in relation to large investors. The pattern now prevailing in the proportion of shares allocated to small and large investors also differs from that observed previously. When attempting to isolate the determinants of IPO underpricing in Hong Kong, the paper also shows that both the “informed demand” hypothesis and the signaling effect of underwriters’ reputation are significant determinants of underpricing. Such result, not visible when pooled OLS regressions are used, becomes apparent through the use of a system of simultaneous equations.
JEL: G24, 32
Keywords: Initial public offerings; Share allocation; Ex-Ante uncertainty; Subscription rate; Underwriters’ reputation
*Corresponding author: Anna, P.I. Vong, Faculty of Business Administration, University of Macau, Avenida da Universidade, Taipa, Macau, China. E-mail: annavong@umac.mo
1. Introduction
The underpricing of initial public offerings (IPOs) is well-documented in the finance literature. Numerous studies have shown that a significant first day (or “initial”) return can be earned by investors during IPOs. Loughran et al. (1994) provides a comprehensive survey of IPO underpricing in companies going public in 25 countries including 7 Asian countries. A more recent study by Ritter (2003) reports the extent of underpricing in 38 countries and confirms that average initial returns of Asian IPOs are significantly higher than in the US. When compared with other Asian countries, initial returns observed in Hong Kong IPOs during recent periods are modest. Moreover, when results reported by Dawson and Hiraki (1985), Dawson (1987), McGuinness (1992), Chen et al. (2001), Cheng et al. (2004), Cheng et al. (2006), Vong (2006), Vong and Zhao (2008) and others, are compared with those obtained in the present paper, it is concluded that underpricing in Hong Kong has experienced a significant decrease from the year of 2001 on.
Most of the theoretical literature on IPO underpricing attributes this market inefficiency to information asymmetry amongst the various groups of market participants: issuers, investors and underwriters. Other explanations are, amongst others, the need of protection against future litigation from investors, the marketing function and the broadening of ownership base after an IPO. Recently, much empirical research has been devoted to examining how new shares are allocated between individual (small) and institutional (large) investors and the impact on initial returns of the allocation scheme adopted (see Hanley and Wilhelm, 1995; Benveniste and Spindt, 1989; Lee et. al, 1996; Aggarwal et. al., 2002; Ljungqvist and Wilhelm, 2002; Amihud et al., 2003; Ljungqvist,
2007; Vong and Trigueiros, 2009). In the US, IPOs follow the ‘book-building’ approach in marketing and selling new shares whereby underwriters obtain from institutional investors, information which is useful for the pricing of an offer. By contrast, many Asian countries like Singapore and Hong Kong have adopted an evenhanded IPO share allocation (Loughran et al. 1994). But owing to the popularity of IPO investment in those countries, subscription rates are frequently high and rationing of new shares is common. Underwriters are discouraged to discriminate amongst orders of the same size but discrimination between investors on the basis of application size is frequent. Thus investors’ expectations regarding the level of initial returns are contingent on both the allotment ratios (the number of shares distributed relative to the number of shares applied for in a particular application order size) and the sizes of applications.
In Hong Kong, IPOs are required to have their allocation schemes publicly announced. Details concerning the subscription level, the number of applications received, the amount of shares requested from investors and, most importantly, how new shares are rationed and distributed across various application order sizes, are all made public. This allows a thorough examination of interesting issues relating to IPO share allocations, namely ascertaining who receives IPO allocations and how could allocation affect initial returns. Such micro-level share allocation data is not made available in other exchanges, namely in US and UK exchanges.
Drawing on allocation data for 324 IPOs during the period 2002-2007, the paper presents direct evidence that more IPO shares are now distributed to individual (small) investors than to institutional (large) investors, a finding which contradicts earlier IPO
studies in Hong Kong, in which it was shown that institutional investors were favored in IPO allocations. It is found that allotment ratios decline with application order sizes, suggesting that the more shares an investor applies for in an IPO, the smaller the relative amount of shares he/she actually receives. For small-sized applications (<100 lots1), allotment ratios range between 50% (for an order size of 2 lots) and 20% (for 99 lots) but for order sizes exceeding 30,000 lots, allotment ratios fluctuate at around 2% only. It is also found that an IPO initial return of 11.29% is expected during the period but, when allotment is taken into account, returns are much lower, ranging from 0.26% (for 70,000 lots) to 3.19% (for 2 lots). It is also shown that small-sized applications (between 2 lots and 20 lots) generate higher returns than those of higher application sizes. For application sizes exceeding 10,000 lots, a lower but significant return can be earned and, actually, with lessened variability.
The above findings may have resulted from the effect of a new reallocation scheme put forth by the Securities and Futures Commission in Hong Kong (SEHK) in 2000, known as the “Claw-Back” provision. Recognizing that small retail investors are frequently crowded out in heavily subscribed new offerings, the SEHK has since long tried to amend and improve the rules governing IPO share allocation. Eventually, in 2000 a new allocation rule2 was issued whereby, whenever an IPO proves to be popular (high subscription rate), there should take place a transfer of new shares from institutional investors’ tranche into the public offer tranche, so as to ensure that retail investors’ demand will not be disregarded, ultimately causing a broadened ownership basis which, regulators believe, would contribute to the quality of the aftermarket. According to the
1 1 lot equals to 1000 shares.
new provision, the initial allocation of shares to public subscription is 10% of the shares offered in the IPO but it may experience a 4 level increase depending on public demand. Namely, the public tranche will increase to 30% when public demand is 15 times but less than 50 times the initial allocation; this will further increase to 40% when public demand is 50 times but less than 100 times the initial allocation; and this will further increase to 50% when public demand is 100 times or more the initial allocation. Given the increase in fairness and the reduction in average overpricing observed in Hong Kong’s IPOs, the “Claw-Back” provisions are being considered in other Asian markets such as Singapore (Ko, 2012).
In addition to the effect of the mentioned reallocation regulation, Cheng et al. (2005) also mentions that Asian underwriters believe that large investors are short-term profit takers, frequently selling the proceeds of an IPO on the listing day. As a result, underwriters, when distributing new shares, tend to allocate more shares to individual (small) investors in order to alleviate the downward pressure on prices created by large investors. This is necessary since it is common for underwriters to provide a price support for new shares during the initial listing period (Aggarwal, 2000; Ellis et al., 2000). Moreover, allocating new shares to a large number of small investors would not only widen the ownership base in an IPO (Lee et al., 1996) but also entice small investors to participate in subsequent IPOs by the same underwriters. This enhanced demand for new offerings can strengthen the reputation of underwriters which is beneficial for their future underwriting business. When these facts are put together the result is that more shares are now allotted to retail investors in Hong Kong.
forward by Subrahmanyam and Titman (1999), that a large number of small investors, once aggregated in the public market, is able to provide a more informative stock price than the price obtained from a smaller group of institutional investors. Hong Kong IPO studies examining previous periods found underpricing levels exceeding 15%, however we find an improvement in primary market efficiency in Hong Kong coincident with the privileging of small investors. Indeed, since, for a given IPO, the activation or not of the reallocation (“Claw-Back”) provision depends on the subscription level of a public offer, it follows that a higher demand from individual investors becomes a signal of the direction of their private information: their bidding behavior translates into better price discovery and lower underpricing. Moreover, the problem of adverse selection under the Rock (1986) model can also be alleviated: when subscription is high, more new shares, rather than a discounted number of shares, are distributed to individual investors.
The paper is also able to offer a more comprehensive view on factors influencing IPO’s initial returns. Previous authors employ OLS regressions where events differently scaled in time, and the corresponding explanatory variables, are pooled into one single cross-section equation. This type of modelling ignores causality and structure issues, namely the fact that the rate of subscription, which is disclosed before the actual offer takes place, incorporates information previously available to investors, thus preventing variables embodying such information from attaining significance in pooled regressions. On the other hand, it is clear that the rate of subscription also contains information of its own and cannot be withdrawn from the set of variables explaining initial returns. The paper shows that a system of seemingly unrelated equations is able to overcome this difficulty, showing, rather than hiding, variables which, at a given moment of the IPO process, significantly influence initial returns through an increase or decrease in the rate
of subscription. Namely, the paper demonstrates that, besides the rate of subscription, also underwriter’s reputation, the number of underwriters and the IPO’s offered price, may change returns significantly upwards or downwards, in spite of the fact that, in pooled regressions, only the former shows up as a significant influence.
The paper is organized as follows: Section 2 presents a review of the literature on IPO share allocation; Section 3 discusses the data and methodology used; Section 4 reports empirical findings and the conclusion section summarizes results.
2. Literature Review
When explaining IPO underpricing, the asymmetric information model of Rock (1986) assumes the existence of two groups of investors, namely informed (large or institutional) and uninformed (small or individual). Rock asserts that new shares are underpriced in order to compensate uninformed investors for receiving a disproportionately large portion of overpriced offerings. Using proxies for informed demand, numerous studies have confirmed the adverse selection problem identified by Rock. Alternatively, Benveniste and Spindt (1989) develop a model of IPO pricing and allocation supposedly used by underwriters to induce informed investors to truthfully reveal their information. The expected profit for revealing truthful information consists of a tradeoff between the level of initial returns and the IPO allocation. Benveniste and Wilhelm (1990) further extend this model and demonstrate the importance of the market mechanism in understanding underpricing. Indeed, discriminatory IPO pricing and allocation could be used to extract private information from investors but due to the regulatory requirement of uniform pricing (either in the US or in the UK offerings), most often discriminatory allocation is adopted by underwriters, especially in countries where allocation data is not publicly disclosed. To sum up, whether the adverse selection or information-gathering is the dominant source of underpricing, both theories predict that informed (large or institutional) investors capture a lion share of the more underpriced IPOs.
The US “book building” approach in marketing and selling IPOs gives underwriters considerable discretion over IPO allocation. The non-disclosure of allocation schemes allows underwriters to decide who will receive an allocation. Such flexibility allows
them to extract valuable information from large investors but at the expense of small investors since large investors must be compensated with a sizable allocation of underpriced offerings. Drawing on a sample of IPOs managed by a single underwriter, Hanley and Wilhelm (1995) notice that approximately 70% of the underpriced offerings are allocated to institutional investors, allowing them to capture a large fraction of short-run profits associated with IPOs. This favored status, nevertheless, carries a quid
pro quo expectation that such favored investors will participate equally in less attractive
offerings. Enlarging the data set of U.S. offerings, Aggarwal et al. (2002) provide support for the existence of information-gathering activities by underwriters where institutional investors are rewarded with an increased allocation in other, more underpriced offerings. Such a level of institutional allocations, however, cannot be explained solely by the book building theory itself. Similar results are reported by Levis (1990) and Cornelli and Goldreich (2001) when examining IPOs in the U.K. Levis (1990) shows that large applicants stand a better chance of receiving new shares while Cornelli and Goldreich (2001) find that frequent investors such as institutional investors are favored in IPO allocations. Keloharju (1993) examines IPOs in Finland and shows that uninformed investors obtain, in average, a larger allocation from overpriced than from underpriced offerings. Ljungqvist and Wilhelm (2002) analyze institutional allocation across a panel of countries: France, Germany, the U.K. and the U.S. and conclude that institutional investors are indeed rewarded with above-normal allocations in “good” offerings.
In Asian primary markets, underwriters bringing IPOs to market follow a “fixed price” approach3 in which offer prices are determined well in advance and new shares are
allocated using pre-defined, non-discretionary schemes. Underwriters are required to allocate shares evenly to investors within an application order size; but across different application sizes uneven allocation is permitted. Thus an IPO allocation is contingent on both the allotment ratio in an application and the size of an application. Koh and Walter (1989) examine allocation data from Singapore, finding a systematic preference for small investors in IPO allocations. However, when new offerings are divided into overpriced and underpriced, the chance of an allocation for small investors in overpriced offerings is more than three times that for large investors. Similar results are reported by Lee et al. (1996) when examining a more recent sample of Singaporean new offerings. They notice that small investors have a higher chance of receiving shares in overpriced offerings as large investors are far less likely to apply for these. But when an offering is underpriced, then small investors’ chance of receiving shares is small.
Many studies have been published on Hong Kong IPOs but most of them do not contemplate IPO allocation, which requires the gathering of micro-level data, an onerous task. Studies which examine IPO allocation have been conducted by McGuinness (1993), Vong and Trigueiros (2009) and Cheng et al. (2005). McGuinness (1993), while examining the period 1980-1990, finds that the chance of receiving an allocation increases with application sizes, showing that investors, in order to secure an allocation, must apply for a relatively large application order. Moreover, for small investors, the chance of receiving an allocation in overpriced offerings is more than twice that observed in underpriced offerings. The allocation of oversubscribed offerings demonstrates a bias towards large investors. Based on a larger sample of IPOs during the period 1988-1995, consistent results are reported by Vong and
Trigueiros (2009) although the difference reported by these authors in the chance of an allocation between overpriced and underpriced offerings to small investors is narrower than that reported by McGuinnes (1993). Cheng et al. (2005) examine the period 1993-1997, introducing two measures of allotment ratios for small investors and concluding that underwriters in IPO allocation prefer small to large investors due to reasons such as the lack of a trusting relationship with large investors and the non-existence of an effective mechanism to monitor block-trading activities.
3. Data and Methodology
Data Sources
A total of 324 companies were listed between 2002 and 2007 in Hong Kong as recorded in the fact books published by the Hong Kong Exchanges and Clearing Limited (HKEx). The pre-listing characteristics of an IPO, such as the offer price, offer size, subscription deadline, refund date4, date when the allocation scheme is determined and date of listing, is collected from IPO prospectuses. IPO allocation schemes which detail the chance of receiving an allocation and the proportion of shares to be received are hand-collected from newspaper announcements. Given that IPO applicants are required to pay their subscription funds up-front, they incur financing charges or opportunity costs which will effectively reduce the actual IPO returns. The lending rate offered by banks5 is used as a proxy for this subscription cost. The listing-date closing prices of IPOs as well as the interest cost are retrieved from DataStream.
Methodology
Measurement of initial returns
Following conventions, first day returns (IR) are computed as the difference between the closing price on the first day of trading and the offering price, divided by the offering price. This initial return is the real return only in cases where investors obtain
4 The date at which a cheque in respect of a wholly or partially unsuccessful application is refunded.
5 In order to minimize the difference between interests lost on saving and interest charged on bank loans, the prime rate (the rate charged to the most favored customers) is used in the study.
the whole number of new shares applied for. In many cases this is not so as the number of shares allocated to each investor depends on the subscription rate of a new offering6. When an offering is over-subscribed (a subscription rate greater than 1), some rationing methods are applied and the expected rate of return, E(IRiA), conditional on application order size, is:
i o A i i o i c A i r A i N P P N P IR E( ) , ( , , )/ , (1)
where E(IR,iA) is the expected rate of return from an application of order size A in issue
i; Nr,iA is the number of shares received from an application of order size A in issue i; Pc,i is the closing price on the first day of trading in issue i; Po,i is the offering price of an issue i; NiA is the number of shares applied for in issue i.
IPO applicants in Hong Kong are required to pay their subscription funds upon the submission of applications, and these funds will be locked-up for 1-2 weeks without interest. Such a settlement mechanism imposes a certain cost on IPO applications which will effectively reduce initial returns. For unsuccessful applicants, subscription funds will be refunded within a week but for successful applicants wishing to cash out their position, more than two weeks may elapse before their allocation can be sold. The subscription cost therefore depends, not only on the application size and daily interest rate, but also on the number of days funds are tied up. The subscription costs (SCiA) for a particular application of order size A in issue i is thus:
6 The subscription level is defined as the total number of shares applied for divided by the number of shares on sale in an IPO.
] 1 ) 1 [( ] 1 ) 1 [( ) ( 2, , , , 1 , , t i i o A i r i t i o A i r A i A i N N P r N P r SC (2)
where SCiA is the subscription cost for an application of order size A in issue i; r is the Hong Kong and Shanghai Banking Corporation’s best quoted lending rate (expressed as a daily rate); t1,i is the number of days from the closing of applications for issue i to the date at which subscription funds are refunded to the applicant; t2,i is the number of days from the closing of applications for issue i to the first day of public trading. Other terms were previously defined.
After taking into account the IPO allocation as well as the cash settlement mechanism, the expected level of net returns from an application of order size A in issue i becomes
i o A i A i i o i c A i r A i N P P SC N P NIR E( ) , ( , , ) / , (3)
Explanatory variables used in the prediction of initial returns
In addition to analyzing the IPO allocations across various application order sizes and their impact on the corresponding level of initial returns, the paper also tests the plausibility of two popular explanations for the observed cross-sectional variation in IPO underpricing, namely the effect of the ex-ante uncertainty surrounding new offerings and the signaling effect of underwriters’ reputation. According to Rock (1986), underpriced offerings attract informed investors’ participation, the expected relation between subscription rate (SR), a proxy for the level of informed demand, and initial return being thus positive. First used by Beatty and Ritter (1986), the relation between ex-ante uncertainty and underpricing has been well examined. In the present
study, both offer size (SIZE) and offer price (OP) are used to capture the riskiness of an offer. Offer size is gauged as the natural logarithm of funds raised. Since small offerings are, in average, more speculative than larger ones, their first day returns may be higher. (Ritter, 1984; How and Low, 1993; Vong, 2006) Similarly, offerings with lower offer price are assumed to be more risky and as such they should impact initial returns positively (Ibbotson et al., 1994; Booth and Chua, 1996; Cheng et al., 2005; Vong and Trigueiros, 2010).
In the extant literature, the impact of underwriters’ characteristics on underpricing is assessed using different variables. Corwin and Schultz (2005) notice that offerings with more than one underwriter tend to be less underpriced as information-gathering and price-setting activities are more efficient. Thus, the present study examines the effect of the number of underwriters of IPOs (WR_N) on underpricing. Following the extant literature, the paper also examines two indicators involving the volume of business of underwriters, generally taken as proxies for their reputation: the market share of an underwriter as a percentage of the number of companies that have been taken public (WR_RP1) and the logarithm of the capital volume of underwritten IPOs (WR_RP2). It is verified, however, that these two variables are strongly correlated. Aside from underwriters’ reputation, the certification role of auditors is also important in an IPO (Hogan, 1997 and Willenborg, 1999). Therefore, two similar measures of reputation of auditors are also examined (AU_RP1 and AU_RP2). These two auditor reputation proxies, however, are almost synonymous. Lastly, a dummy variable (H_DUM) which accords a value of 1 for shares issued in Hong Kong, known as “H” shares, and 0 otherwise. This dummy controls for the origin of an IPO.
4. Empirical Results
Initial returns after considering the winner’s curse and the settlement mechanism
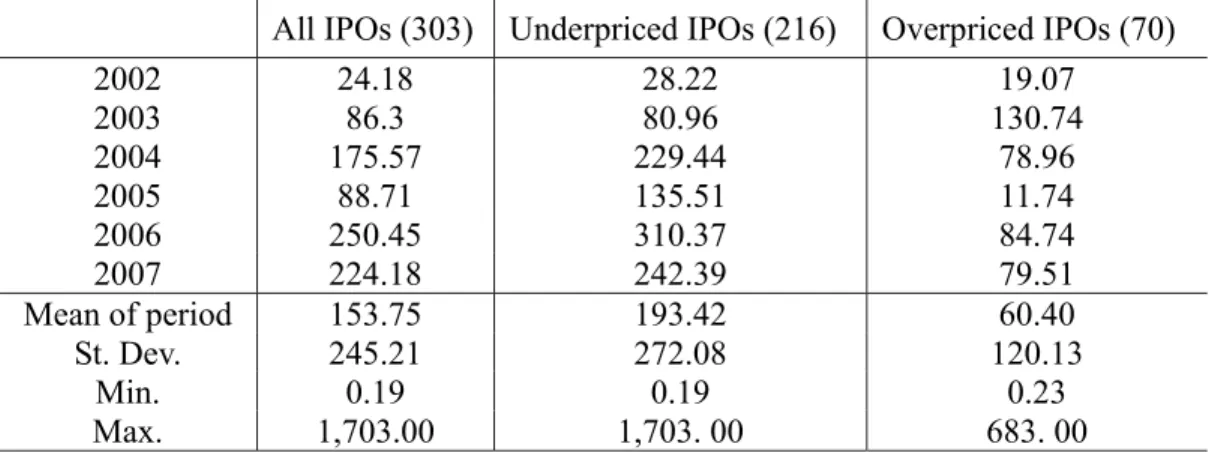
For the new offerings under review (2002-2007), the paper finds an average excess initial return of 11.29%. This is the level earned by an investor who faces no rationing. But given the high rate of IPOs subscription in Hong Kong, it is not uncommon for issuers to ration new shares. Rationing in turn reduces expectations of initial returns. For the entire sample, a total of 303 rationing schemes were gathered. Before examining how shares are rationed across application order sizes, subscription rates are compared for under- and over-priced IPOs. Results are reported in Table 1. Except for the year 2003, subscription rates are in general higher for underpriced offerings yet Rock (1986) asserted that underpriced offerings should be associated with higher subscription rates. The mean subscription rates of underpriced offerings is 193.42, which is three times higher than that of overpriced ones (60.40), and a parametric t-test suggests that such difference is, when taken in isolation,7 statistically significant.
[Insert Table 1]
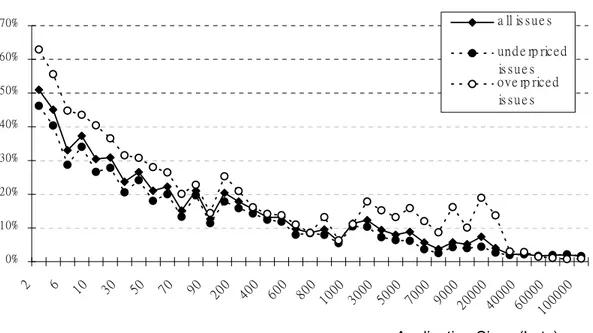
Having established a link between subscription rates and initial returns, attention is now turned to the allotment schemes. Figure 1 displays the average allotment ratios (the number of shares distributed relative to the number of shares applied for in a particular application order size) for different application order sizes. As observed, allotment ratios are higher for small-sized applications and decline as the size of an application
increases. For an application of 2000 shares, an individual (small or uninformed) investor, on average, can receive 1000 shares (50.96%) while for an application of 100,000,000 shares, the allotment ratio is just 1.65%. A close examination of the allotment ratios shows three distinctive patterns. For application order sizes of less than 100,000 shares, allotment ratio fluctuates and decreases abruptly with the size of an application. For application order sizes from around 100,000 shares to 20,000,000 shares, the allotment ratio still drops with the size of an application but in a milder slope. Lastly, for application sizes of 30,000,000 shares onwards, the allotment ratio stabilizes and remains at approximately 2%.
Some earlier IPO studies claim that companies which go public tend to favor small investors so that more of their new shares are allotted to them. But when IPOs are divided into those with positive (underpriced) and negative (overpriced) returns, it is observed that small investors suffer from a winner’s curse as they receive more of those overpriced offerings than large investors do. Interestingly, another group of investors, those applying for 2,000,000 to 20,000,000 shares, also suffers from the same winner’s curse, being allocated a higher proportion of offerings with negative returns. Lastly, for application order sizes of 40,000,000 shares onwards, there is a reversion in the allocation pattern between overpriced and underpriced offerings, allotment ratios in underpriced offerings exceeding those in overpriced ones. Such large investors are selective, participating only in offerings with clear signs of positive initial returns.
[Insert Figure I]
returns for each application order sizes. Such rate of return can be interpreted as the expected return earned after adjustment for Rock’s winner’s curse. Figure 2 reports expected initial returns for application order sizes ranging from 2000 to 100,000,000. As expected, allocation-adjusted returns are now much lower than the average return of 11.29% reported for the period. Indeed, with the consideration of allotment ratios, returns range from 0.26% (for an application of 70,000,000 shares) to 3.19% (for 2,000 shares). Results clearly show that small-sized applications (between 2,000 and 20,000 shares) generate higher returns than those of other application sizes and such differences, when taken in isolation, are also statistically significant. For application sizes exceeding 10,000,000 shares a lower but significant return can be earned and, actually, with lessened variability.
[Insert Figure II]
In addition to the allocation bias, the cash settlement mechanism requiring subscription funds to be delivered up-front, will again reduce the rate of initial returns. In order to compute the interest incurred in by those subscription funds, the observed average number of days between an application closure and the public listing of shares is 8 (t2). As for refunded funds, the average number of days is 6 (t1). These lengths compare favorably to those reported by McGuinness (1993), Fung et al. (2004) and Vong and Trigueiros (2009). As shown in Figure 3, the incorporation of both allotment ratios’ expectation and settlement mechanism reduces returns. However, small investors (applications below 10,000 shares) can still earn returns which are significantly higher than those available for other investors. An application in excess of 20,000,000 shares may generate significant returns but, when compared with small-sized applications, this
return is smaller.
[Insert Figure III]
The effect of the “Claw-Back” mechanism on IPO share allocation
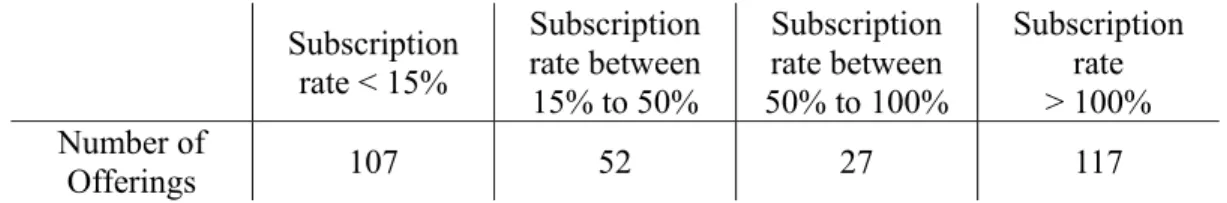
When IPOs are divided in the four subscription rate classes defined by the “Claw-Back” provision, the resulting frequency distribution of IPOs is shown in Table 2. The majority of new offerings belong to either the first class (offerings with subscription rates less than 15 times) or the fourth class (subscription rate exceeding 100 times).
[Insert Table 2]
Figure 4 below shows the pattern of allotment ratios for the four “Claw-Back” classes. The patterns look similar except for the class with subscription rates less than 15 times, which fluctuates more than the others. In general, the allotment ratio decreases with the size of an application and such decrease become flattened with an application in excess of 100,000 shares. The allotment ratios together with cost of the subscription funds paid upon submission of applications determine the expected net rate of return for each application size and for each group. Results from Table 3 show that the group with subscription rate less than 15 times produces returns which are statistically non-significant whereas the most significant returns (when taken individually) can be earned by investors subscribing for new offerings with subscription rate greater than 100 times. For the latter group, an application size of 2000 shares is capable of generating an average initial return of 6.59%. As for the other two groups (subscription rate between 15 and 50 and subscription rate between 50 and 100), some
of the applications produce significant returns while the majority of the applications failed to do so.
[Insert Figure IV]
[Insert Table 3]
Cross-sectional variation in underpricing
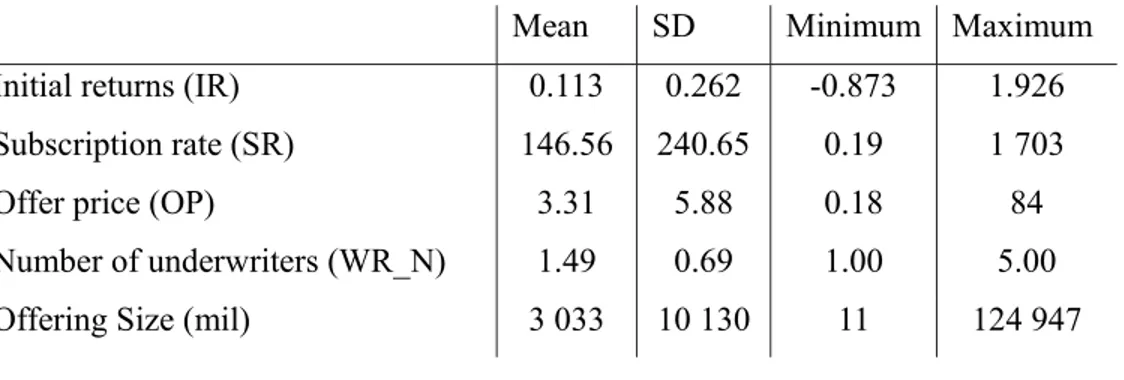
Before conducting hypotheses testing on relationships that may exists amongst set of variables discussed earlier, some summary statistics on those variables are provided in Table 4. The mean value of subscription rate (SR) is 146.56 times showing that IPOs are viewed as a good investment by investors. In addition, the maximum subscription is 1703 times while the minimum is only 0.19 times, suggesting that the demand for new offerings in Hong Kong varies substantially. The next variable, offer price (OP), ranges between HK$0.18 and HK$84 but in fact, the majority of the new offerings (nearly 80%) is priced below HK$3.00. As for the number of underwriters (WR_N) involved in an IPO, the majority of the new offerings is underwritten by not more than two underwriters although the maximum number of underwriters is five. Finally, the offering size of an IPO falls between HK$11 million and HK$124 947 million, while the mean value is HK$3 033 million.
[Insert Table 4]
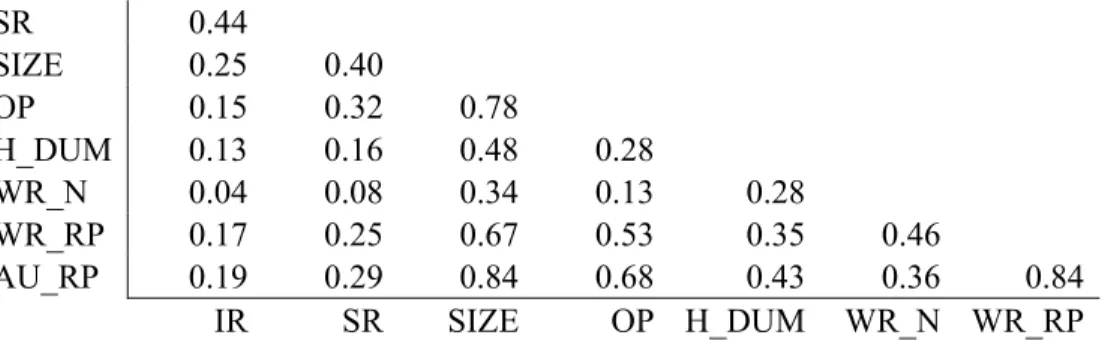
SR, OP and WR_N, variables which originally exhibit extremely high skewedness and kurtosis. Such deviations from Normality, if not checked, might generate influential cases and heteroscedasticity in models. Also, the two highly correlated underwriter reputation proxies WR_RP1 and WR_RP2 are collapsed into one single variable via a principal components’ rotation followed by the extraction of the first factor (WR_RP) explaining 97% of common variability. The same procedure is applied to the two auditor reputation proxies AU_RP1 and AU_RP2 and the extracted factor, AU_RP, explains 99% of common variability. The number of underwriters, WR_N, is not so strongly correlated with reputation proxies and no attempt is made to merge its variability into WR_RP. WR_N is thus introduced in the analysis as a separate viewpoint on underwriters. Table 5 shows the correlation matrix of all variables used in predicting IPOs initial returns.
[Insert Table 5]
The methodology employed to test for the existence of significant relationships, namely between initial returns and other variables, is a system of 5 “seemingly unrelated” simultaneous equations8 where initial returns (IR), subscription rate (SR), number of underwriters (WR_N), reputation of underwriters (WR_RP) and reputation of auditors (AU_RP) are simultaneously explained by all the other variables. Dependent variables in one of the 5 equations are also used as independent variables in the other 4 equations. Simultaneity is required firstly because of the reverse causality that may exist, namely
8 Many theoretical models require more than one equation. “The disturbance terms of these equations are likely to be contemporaneously correlated, because unconsidered factors that influence the disturbance term in one equation probably influence the disturbance terms in other equations, too. Ignoring this contemporaneous correlation and estimating these equations separately leads to inefficient estimates of the coefficients. However, estimating all equations simultaneously with a generalized least squares estimator, which takes the covariance structure of the residuals into account, leads to efficient estimates. This estimation procedure is called \seemingly unrelated regression." (Henningsen and Hamann, 2007).
between initial returns, IR, the rate of subscription, SR, the offered price, OP, underwriters’ number, WR_N, reputation, WR_RP, or auditors’ reputation AU_RP. Indeed, it may be argued that expectations on future IPO returns are likely to influence the choice of underwriters and their number, the choice of auditors and the offered price. The same reasoning applies to expectations on the rate of subscription. Simultaneity is also required because, importantly, the influence of variables such as OP, WR_N, WR_RP and AU_RP on initial returns may not be directly observable. Indeed, such influence may be entirely absorbed into the rate of subscription, SR, which is known by investors in advance of the offer day. If this were so, then a pooled regression explaining initial returns in terms of SR and all the other explanatory variables, would be unable to unveil any direct link between such initial returns and information which investors, in fact, use to place their orders. This would be so, in spite of the fact that the influence of such explanatory variables on initial returns might exist and be significant. One possible remedy might be to build a structural model contemplating two predicted variables, SR and IR. But this would prevent the direct comparison with previously employed methodologies while not addressing all causality issues. The choice of a system of simultaneous equations is thus justified.
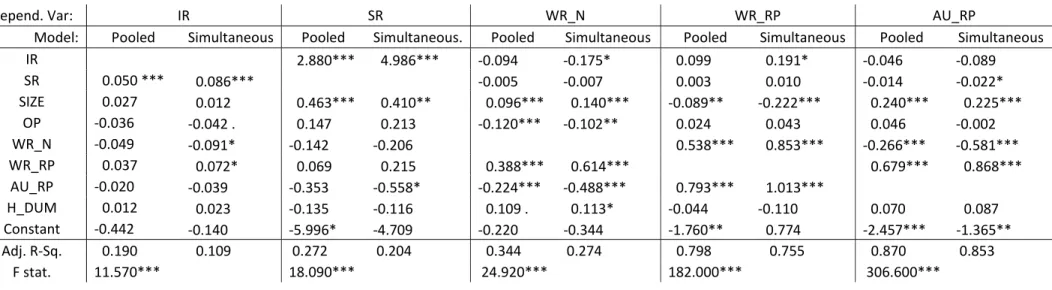
Besides the set of 5 simultaneous equations, 5 pooled OLS regressions are run, similarly explaining IR, SR, WR_N, WR_RP and AU_RP in terms of all other variables. OLS regressions are used here in order to correctly interpret results from the system of simultaneous equations. Table 6 compares coefficients, their significance and overall model significance of, respectively, pooled regressions and the system of seemingly unrelated simultaneous equations.
[Insert Table 6]
Results confirm that, while pooled OLS regressions explain initial returns (IR) solely in terms of subscription rate (SR), all other independent variables being non-significant, the system of 5 simultaneous equations shows that, besides subscription rate, the number of underwrites (WR_N) and their reputation (WR_RP), significantly explain initial returns. Offer price (OP) is near significance at 6%. The signs of coefficients show that underwriter reputation tends to increase initial returns while both the number of sponsors and offer price reduces it in average.
For the remaining 4 equations, explaining SR, WR_N, WR_RP and AU_RP, results are strikingly similar in pooled and in simultaneous equations. WR_N emerges as a separate underwriter’s feature with specific characteristics. By contrast, WR_RP and AU_RP share most of their characteristics. The signs of coefficients are consistent across the different roles assigned to variables.
Given such results, it is suggested that the influence of reputation and number of sponsors plus offer price on initial returns is hidden from direct scrutiny because the explanatory power of these three variables is absorbed into the previously-known rate of subscription. Thus, a structural link may exist, where the rate of subscription is ex-ante significantly predicted by reputation, offer price and other variables, but then, after subscriptions are entered and the allotment results are known, the rate of subscription becomes the sole ex-ante predictor of initial returns, containing two types of variability: a large amount of variability of its own, strongly influencing IPO returns, plus variability imported from previous sources, some of which influence IPO returns.
In summary, of all possible predictors, the two features of underwriters (WR_N and WR_RP) plus offer price (OP) significantly influence initial returns through the corresponding increases and decreases in SR, the rate of subscription, which is also an important source of variability of its own, able to explain initial returns.
Previously published studies use pooled regressions to explain IPO’s initial returns, thus being unable to detect significant relationships anterior and concomitant to the disclosure of the IPO’s subscription rate. This paper shows that, in order to evidence the whole exchange of information during IPOs, methodologies contemplating an appropriate structure are required.
As a proxy for informed demand, the rate of subscription is positively related to IPO initial returns, suggesting that the new issue market displays considerable sensitivity to the expected level of underpricing since the demand for underpriced shares increases significantly. The finding of a positive, significant influence of underwriter reputation on the level of excess returns contrasts with earlier studies where reputation was found to reduce the level of underpricing (Titman and Trueman, 1986; Megginson and Weiss, 1991; and Carter et al., 1998). Here it is shown that, while the number of underwriters indeed reduces the level of excess returns (Corwin and Schultz, 2005), reputation increases it. It is therefore concluded that the more reputable an underwriter is, the higher the return’s level of an IPO will be.
5. Conclusion
Initial Public Offerings (IPO) are a privileged test-bed for investigating information interactions between different parties involved in share issuance and trading in stock exchanges. If IPO studies are to some degree out-of-fashion nowadays, this is not because all questions have been answered. Far from that, many interesting questions remain unanswered. It is hoped that the paper may act as an incentive to a renewed interest in IPO research.
It is speculated that authors shun this type of studies for three basic reasons. First, micro-level data collection tasks of the type required to perform IPO allocation studies, are burdensome, thus, most authors avoid investigating allocation issues which, in turn, are vital for a thorough grasp on IPOs. Second, not all IPO devices employed by stock exchanges generate allocation data. Finally, IPO research is not as methodologically “flat” as authors seem to suppose, namely requiring the consideration of structure and causality issues, which are out-of-reach of methodologies hitherto employed. This paper firstly and decisively shows that micro-level data and a better-suited modelling methodology are required to unveil IPO features.
In doing so, the paper also shows that, in Hong Kong IPOs, small investors are now being favored and are allotted more IPO shares. Findings show that more shares from overpriced offerings are in fact distributed to small investors than to institutional investors. With the institution of the “Claw-Back” mechanism, which entails a transfer of shares from the institutional tranche into public subscription, the chance of small investors assessing a larger allocation of underpriced offerings has increased. Since
the activation of this reallocation provision depends on the rate of subscription, small investors are induced to signal their private information through their demand behavior. Such demand information helps IPO companies to properly price an offer and increases investors’ chances and magnitude of an allocation. This explains why a lower level of underpricing is documented in the present study, and is in fact consistent with the argument, put forward by Subrahmanyam and Titman (1999), that aggregating diverse investor information improves primary market efficiency. Rock’s adverse selection model thus seems to be insufficient to explain the levels of underpricing found in Hong Kong.
Although the study documents a positive first day excess return of 11.29%, the effect of rationing, a common feature in Asian IPO share allocations, reduces this figure to markedly lower values: expected returns range from 0.26% (for an application of 70,000,000 shares) to 3.19% (for 2,000 shares). Small investors are able to capture a significantly higher level of returns in relation to large investors except for relatively large size applications. IPO applicants applying for 400,000,000 shares or more obtain a smaller allocation and lower returns but the associated variability lower too.
Finally, both the level of informed demand and underwriters’ reputation are important predictors of underpricing. Such comprehensive picture is obtained when, instead of pooled OLS regressions, a system of simultaneous equations is used.
References
Aggarwal, R. (2000) Stabilization activities by underwriters after initial public offerings, Journal of Finance 55, 1075–1103.
Aggarwal, R., Prabhala, N.R. and Puri, M. (2002) Institutional allocation in initial public offerings: Empirical evidence, Journal of Finance 57, 1421-1442.
Amihud, Y., Hauser, S. and Kirsh, A. (2003) Allocations, adverse selection, and cascades in IPOs: Evidence from the Tel Aviv Stock Exchange, Journal of Financial Economics 68, 137-158.
Beatty, R. P., Ritter, J. R. (1986) Investment banking, reputation, and the underpricing of initial public offerings, Journal of Financial Economics 15, 213-232.
Benveniste, L. M. and Spindt, P. A. (1989) How investment bankers determine the offer price and allocation of new issues, Journal of Financial Economics 24, 343-361. Benveniste, L. M. and Wilhelm, W. J. (1990) A comparative analysis of IPO proceeds
under alternative regulatory environments, Journal of Financial Economics 28, 173-207.
Booth, J. R., Chua, L. (1996) Ownership dispersion, costly information, and IPO, Journal of Financial Economics 41, 291-310.
Carter, R. B., Dark, F. H. and Singh, A. K. (1998) Underwriter reputation, initial returns, and the long–run performance of IPO stocks, Journal of Finance 53, 285–331.
Chen, C. R., Mohan, N. J. (2001) Underwriter spread, underwriter reputation, and IPO underpricing: a simultaneous equation analysis, Journal of Business Finance & Accounting 29, 521-540.
Cheng, W. Y., Cheung, Y. L., Po, K. K. (2004) A note on the intraday patterns of initial public offerings: evidence from Hong Kong, Journal of Business Finance &
Accounting 31, 837-860.
Cheng, T. W., Chan, K. C., Mak, S. C. (2005) Strategic share allocation and underpricings of IPOs in Hong Kong, International Business Review 14, 41-59. Cheng, W. Y., Cheung, Y. L., Tse, Y. C. (2006) The impact on IPO performance of more
stringent listing rules with a pre-listing earnings requirement: evidence from Hong Kong, Journal of Business Finance & Accounting 33, 868-884.
Cornelli, F. and Goldreich, D. (2001) Bookbuilding and Strategic Allocation, Journal of Finance 56, 2337-2369.
Corwin, S. A., Schultz, P. (2005) The role of underwriting syndicates: pricing, information production, and underwriter competition, The Journal of Finance 60, 443-486.
Dawson, S. M. (1987) Secondary stock market performance of initial public offers, Hong Kong, Singapore and Malaysia: 1978-1984, Journal of Business Finance and Accounting 14, 65-76.
Dawson, S. M., Hiraki, T. (1985) Selling unseasoned new shares in Hong Kong and Japan, a test of primary market efficiency and underpricing, Hong Kong Journal of Business Management 3, 125-134.
Ellis, K., Michaely, R., O’Hara, M. (2000) When the underwriter is the market maker: An examination of trading in the IPO Aftermarket, Journal of Finance, 55, 1039–1074.
Fung, J. K. W., Cheng, L. T. W., Chan, K. C. (2004) The impact of the costs of subscription on measured IPO returns: the case of Asia, Journal of Corporate Finance 10, 459-465.
Hanley, K. W. and Wilhelm, W. J. (1995) Evidence on the strategic allocation of initial public offerings, Journal of Financial Economics 37, 239-257.
Hogan, C. (1997) Costs and benefits of audit quality in the IPO market: A self-selection analysis, The Accounting Review, 67-86.
How, J. C. Y. and Low, J. G. (1993) Fractional ownership and underpricing: signals of IPO firm value? Pacific-Basin Finance Journal 1, 47–65.
Ibbotson, R. G., Sindelar, J., Ritter, J. (1994) The market’s problem with the pricing of initial public offerings, Journal of Applied Corporation Finance 6, 66-74.
Keloharju, M. (1993) Winner’s curse, legal liability, and the long-run performance of initial public offerings in Finland, Journal of Financial Economics 34, 251-277. Ko, T., Revell, S. and Cotton, D. (2012) Singapore seeks to increase retail participation
in IPOs, Briefing by Freshfields Buckhaus Deringer LLP, Singapore.
Koh, F. and Walter, T. (1989) A direct test of Rock’s model of the pricing of unseasoned issues, Journal of Financial Economics 23, 251-272.
Lee, P.J., Taylor, S. L., Walter, T. S. (1996) Expected and realized returns for Singaporean IPOs: initial and long-run analysis, Pacific Basin Finance Journal 4, 153-180.
Levis, M. (1990) The winner’s curse problem, interest costs, and the underpricing of initial public offerings, Economic Journal 100, 76-89.
Ljungqvist, A. P. (2007) IPO underpricing. In: B.E. Eckbo (ed.), Handbook in Corporate Finance 1: Empirical Corporate Finance, North-Holland, 375-306.
Ljungqvist, A. P. and Wilhelm, W. J. (2002) IPO allocations: discriminatory or discretionary? Journal of Financial Economics, 65, 167-201.
Loughran, T., Ritter, J. R., Kristian, R. (1994) Initial public offerings: International insights, Pacific-Basin Finance Journal 2, 165-199.
McGuinness, P. (1992) An examination of the underpricing of initial public offerings in Hong Kong: 1980-1990, Journal of Business Finance and Accounting, 165-186.
McGuinness P. (1993) Investor-and-issuer related perspectives of IPO underpricing, Omega 21, 377-392.
Migginson, W. and Weiss, K. (1991) Venture capital certification in initial public offerings, Journal of Finance 46, 879–904.
Ritter, J. R. (1984) The ‘hot issue’ market of 1980, Journal of Business 57, 215–40. Ritter, J.R. (2003) Investment banking and securities issuance. In: G.M. Constantinides,
M. Harris, and R. Stulz (eds.), Handbook of the Economics of Finance 1A: Corporate Finance, North-Holland, 255-306.
Rock, K. (1986) Why new issues are underpriced. Journal of Financial Economics 15, 187-212.
Subrahmanyam, A. and Titman, S. (1999) The Going-Public Decision and the Development of Financial Markets, Journal of Finance 54, 1045-1082.
Titman, S., Trueman, B. (1986) Information quality and the valuation of new issues. Journal of Accounting and Economics 8, 159-172.
Vong, P. I. (2006) Rate of subscription and after-market volatility in Hong Kong IPO. Applied Financial Economics 16, 1217-1224.
Vong, P. I. and Zhao, N. (2008) An Examination of IPO Underpricing in the Growth Enterprise Market of Hong Kong, Applied Financial Economics 18, 1539-1547. Vong, P. I., Trigueiros, D. (2009) An Empirical Extension of Rock's IPO Underpricing
Model to Three Distinct Groups of Investors, Applied Financial Economics 17, 1257-1268.
Vong, P. I. and Trigueiros, D. (2010) The Short-run Price Performance of initial public offerings in Hong Kong: new evidence, Global Finance Journal 21, 253-261. Willenborg, M. (1999) Empirical analysis of the economic demand for auditing in the
Table 1. Average subscription rates (SR) of new offerings: 2002-2007.
All IPOs (303) Underpriced IPOs (216) Overpriced IPOs (70)
2002 24.18 28.22 19.07 2003 86.3 80.96 130.74 2004 175.57 229.44 78.96 2005 88.71 135.51 11.74 2006 250.45 310.37 84.74 2007 224.18 242.39 79.51 Mean of period 153.75 193.42 60.40 St. Dev. 245.21 272.08 120.13 Min. 0.19 0.19 0.23 Max. 1,703.00 1,703. 00 683. 00
Note: This table compares the subscription rate of under- and over-priced new offerings in Hong Kong from 2002 to 2007.
Figure I. Allotment ratios (AR) for each application size. Allotment Ratios 0% 10% 20% 30% 40% 50% 60% 70% 2 6 10 30 50 70 90 200 400 600 800 1000 3000 5000 7000 9000 200 00 400 00 600 00 100 000
Application Sizes (Lots)
all issues underpriced issues overpriced issues
Figure II. Expected rate of return [E(IRiA)] for each application size. Expected Rate of Return
-10% -8% -6% -4% -2% 0% 2% 4% 6% 8% 2 10 50 90 400 800 3000 7000 20000 60000
Application Sizes (Lots) A ll issues U nderpriced issues O verpriced issues
Figure III. Expected net rate of return [E(NIRiA)] for each application size. -10% -8% -6% -4% -2% 0% 2% 4% 6% 8%
Application Sizes (Lots) Expected Net Rate of Return
all issues underpriced issues overpriced issues
Table 2. Frequencies of new offerings among the four “Claw-Back” subscription rate classes. Subscription rate < 15% Subscription rate between 15% to 50% Subscription rate between 50% to 100% Subscription rate > 100% Number of Offerings 107 52 27 117
Note: Depending on its rate of subscription, each IPO is placed into a “Claw-Back” class.
Figure IV. Allotment ratios (AR) of application sizes for the four groups of new offerings. Allotment Ratios 0% 10% 20% 30% 40% 50% 60% 70% 80% 90% 2 10 50 90 250 450 800 2000 4000 6000 8000 20000 40000 Application Sizes (Lots)
Less than 15 15 to 50 50 to 100 over 100
Table 3. Expected net rate of return [E(NRiA)] across the range of application sizes for the four groups of offerings.
Application sizes (Lots)
Expected net rate of return (%) Subscription Rate < 15 Subscription Rate
between 15 to 50 Subscription Rate between 50 to 100 Subscription Rate > 100 2 -1.14% 1.63% 0.73% 6.59%* 4 -0.65% 1.99% 3.68% 4.13%* 6 -1.53% 1.18% 0.41% 2.96%* 8 0.32% 1.83%* 3.03% 2.81%* 10 -1.35% 0.95% 0.08% 2.51%* 20 -0.65% 1.38%* 2.54% 1.79%* 30 -1.22% 0.59% 0.23% 1.27%* 40 0.09% 1.07%* 1.88% 1.16%* 50 -1.28% 0.49% 0.08% 0.88%* 60 -0.37% 1.10%* 1.51% 0.79%* 70 0.05% 0.45% 0.11% 0.67%* 80 0.20% 0.80%* 1.28% 0.68%* 90 0.33% 0.46% 0.20% 0.55%* 100 -0.72% 0.76%* 1.13% 0.60%* 200 -0.22% 0.53% 0.93% 0.41%* 300 -0.14% 0.61%* 0.71% 0.32%* 400 1.15% 0.50%* 0.67% 0.29%* 500 0.07% 0.41% 0.55% 0.26%* 600 0.17% 0.14% 0.57% 0.22%* 700 -0.08% 0.36% 0.33% 0.21%* 800 -0.17% 0.27% 0.49% 0.20%* 900 0.32% 0.26% 0.43% 0.19%* 1,000 0.45% 0.25% 0.45% 0.20%* 2,000 0.58% 0.28% 0.55%* 0.18%* 3,000 1.72% 0.37% 0.51%* 0.16%* 4,000 0.40% 0.34% 0.50%* 0.16%* 5,000 -0.37% 0.35% 0.56%* 0.16%* 6,000 -0.13% 0.18% 0.55%* 0.14%* 7,000 -1.85% 0.20% 0.48% 0.16%* 8,000 -0.91% 0.41% 0.56%* 0.18%* 9,000 1.24% 0.08% 0.58% 0.18%* 10,000 -0.16% 0.08% 0.48% 0.19%* 20,000 0.35% 0.13% -0.01% 0.15%* 30,000 -0.04% 0.10% -0.02% 0.18%* 40,000 -0.04% 0.14% 0.09% 0.19%* 50,000 N/A 0.47% 0.00% 0.20%* 60,000 N/A 0.42% 0.09% 0.20% 70,000 N/A 0.01% 0.09% 0.16% 100,000 N/A -0.13% 0.12% 0.21%
Note: This table shows the expected net rate of return [E(NRiA)] across the range of application sizes for the four groups of new offerings. Each group has been classified according to the rate of subscription. 1 Lot = 1,000 shares. * significant at the 5% level.
Table 4. Summary statistics of initial returns and some explanatory variables.
Mean SD Minimum Maximum
Initial returns (IR) 0.113 0.262 -0.873 1.926
Subscription rate (SR) 146.56 240.65 0.19 1 703
Offer price (OP) 3.31 5.88 0.18 84
Number of underwriters (WR_N) 1.49 0.69 1.00 5.00
Offering Size (mil) 3 033 10 130 11 124 947
Note: This table shows the summary statistics of new offerings in Hong Kong from 2002 to 2007. Initial return (IR) is computed as the difference between the closing price on the first trading day and offering price divided by the offering price. Subscription rate (SR) is defined as the total number of shares applied for divided by the number of shares on sale in an IPO. Offer price (OP) is the offering price of an IPO. Number of underwriters (REP1) is defined as the number of underwriters in an IPO. Offering size is the proceeds from an IPO.
Table 5. Correlation matrix of variables used in modelling and hypotheses testing. SR 0.44 SIZE 0.25 0.40 OP 0.15 0.32 0.78 H_DUM 0.13 0.16 0.48 0.28 WR_N 0.04 0.08 0.34 0.13 0.28 WR_RP 0.17 0.25 0.67 0.53 0.35 0.46 AU_RP 0.19 0.29 0.84 0.68 0.43 0.36 0.84 IR SR SIZE OP H_DUM WR_N WR_RP
Note: SIZE, OP and WR_N are logarithmic-transformed variables. WR_RP and AU_RP are the first principal components of pairs of underwriter reputation and auditor reputation proxies respectively. All correlations are positive, denoting a common influence of size.
Table 6. Pooled OLS regression results compared with simultaneous equations’ results explaining initial returns, subscription rate and features’ proxies.
Depend. Var: IR SR WR_N WR_RP AU_RP
Model: Pooled Simultaneous Pooled Simultaneous. Pooled Simultaneous Pooled Simultaneous Pooled Simultaneous
IR 2.880*** 4.986*** ‐0.094 ‐0.175* 0.099 0.191* ‐0.046 ‐0.089 SR 0.050 *** 0.086*** ‐0.005 ‐0.007 0.003 0.010 ‐0.014 ‐0.022* SIZE 0.027 0.012 0.463*** 0.410** 0.096*** 0.140*** ‐0.089** ‐0.222*** 0.240*** 0.225*** OP ‐0.036 ‐0.042 . 0.147 0.213 ‐0.120*** ‐0.102** 0.024 0.043 0.046 ‐0.002 WR_N ‐0.049 ‐0.091* ‐0.142 ‐0.206 0.538*** 0.853*** ‐0.266*** ‐0.581*** WR_RP 0.037 0.072* 0.069 0.215 0.388*** 0.614*** 0.679*** 0.868*** AU_RP ‐0.020 ‐0.039 ‐0.353 ‐0.558* ‐0.224*** ‐0.488*** 0.793*** 1.013*** H_DUM 0.012 0.023 ‐0.135 ‐0.116 0.109 . 0.113* ‐0.044 ‐0.110 0.070 0.087 Constant ‐0.442 ‐0.140 ‐5.996* ‐4.709 ‐0.220 ‐0.344 ‐1.760** 0.774 ‐2.457*** ‐1.365** Adj. R‐Sq. 0.190 0.109 0.272 0.204 0.344 0.274 0.798 0.755 0.870 0.853 F stat. 11.570*** 18.090*** 24.920*** 182.000*** 306.600***
Note: The table compares results of pooled OLS cross-sectional regressions explaining Initial Returns (IS), Subscription Rate (SR), Number of Underwriters (WR_N), Underwriter Reputation (WR_RP) and Auditor Reputation (AU_RP), with results obtained from a System of Seemingly Unrelated Simultaneous Equations (Simultaneous) where the same variables are explained by the other 4 predicted variables plus IPO size (SIZE), IPO Offer Price (OP) and Type of Share on Offer (H_DUM). Initial returns refer to new offerings in Hong Kong during the period 2002 – 2007, computed as the difference between the closing price on the first trading day and offering price divided by the offering price. “***” depicts significance at the 0.1% level, “**” at the 1% level, “*” at the 5% level and “.” depicts near-significance below the 10% level.
![Figure II. Expected rate of return [E(IR i A )] for each application size.](https://thumb-eu.123doks.com/thumbv2/123dok_br/18506290.902365/34.918.183.745.137.443/figure-ii-expected-rate-return-ir-application-size.webp)
![Figure III. Expected net rate of return [E(NIR i A )] for each application size. -10%-8%-6%-4%-2% 0%2%4%6%8%](https://thumb-eu.123doks.com/thumbv2/123dok_br/18506290.902365/35.918.179.746.138.412/figure-iii-expected-rate-return-nir-application-size.webp)

![Table 3. Expected net rate of return [E(NR i A )] across the range of application sizes for the four groups of offerings](https://thumb-eu.123doks.com/thumbv2/123dok_br/18506290.902365/38.918.161.747.159.1006/table-expected-return-range-application-sizes-groups-offerings.webp)