Correspondence:
María José Merino Plaza Hospital Dr Moliner Carretera de PortaCoeli s/n 46118-Serra
Valencia, España E-mail: [email protected]
Received: May 18, 2017
Approved: Jul 30, 2017
How to cite: Merino-Plaza MJ, Carrera-Hueso FJ, Arribas-Boscá N, Martínez-Asensi A, Trull-Maravilla E, Fikri-Benbrahim N. Burnout in the staff of a chronic care hospital. Rev Saude Publica. 2018;52:45.
Copyright: This is an open-access article distributed under the terms of the Creative Commons Attribution License, which permits unrestricted use, distribution, and reproduction in any medium, provided that the original author and source are credited.
http://www.rsp.fsp.usp.br/
Burnout in the staff of a chronic care hospital
Maria Jose Merino-PlazaI,II, Francisco Javier Carrera-HuesoI, Nuria Arribas-BoscáI, Amparo Martínez-AsensiI, Emilia Trull-MaravillaIII, Narjis Fikri-BenbrahimII
I Hospital Doctor Moliner. Serra. Valencia, España II Universidad de Granada. Granada, España
III Unidad de Salud Mental de Foios. Hospital Clínico. Valencia, España
ABSTRACT
OBJECTIVE: To estimate the prevalence of Burnout in a medium or long-stay hospital, to monitor its evolution and to highlight the importance of cut-off points used to avoid distortions in the interpretation of the results.
METHODS: Two cross-sectional studies (2013–2016) were carried out, applying the Spanish version of the Maslach Burnout Inventory to the staff of a chronic care hospital (n = 323). Result variables were: Burnout prevalence and a high degree of affectation of the subscales and predictor variables: sociodemographic characteristics and factors that trigger and modulate the syndrome. The association between variables was quantified using odds ratio.
RESULTS: The participation rate went from 31.5% to 39.3%. The professionals presented a mean level of Burnout in both moments, observing a lower degree of affectation of the depersonalization subscales and personal accomplishment in the 2016 cut-off. The average score of the subscales in 2016 was 21.5 for emotional fatigue, 4.7 for depersonalization and 41.7 for personal fulfillment, compared to the values of emotional fatigue = 21.6, depersonalization = 6.9 and personal fulfillment = 36.3 obtained in 2013. The emotional fatigue score was slightly higher than the mean value of the national studies (19.9), while the rest of the values were similar to the mean values of the studies considered. The prevalence of Burnout and the interpretation of the results varied significantly according to the cut-off points considered. In both studies, sociodemographic variables showed little significance, while social support and interpersonal relationships were associated with the degree of burnout among professionals.
CONCLUSIONS: Our prevalence of Burnout was similar to that of other studies consulted, although the emotional component is more marked in our environment. The interpretation of the results varied significantly according to the cut-off points applied, due to the cross-cultural differences.
INTRODUCTION
Burnout or Occupational Burnout appears due to an inadequate response to chronic work stressors of an interpersonal nature, with negative consequences for personal, work and organizational levels1. It mainly affects professionals who provide their services in direct
contact with the recipient of their care, such as health personnel, teachers or police. Its origin is occupational, but its etiology is multifactorial and depends on individual, social and organizational factors.
The Maslach Burnout Inventory (MBI)2 is the most commonly used instrument for
its evaluation and contributes to systematizing the research on the construct. Their subscales were not identified from a theoretical model supported by clinical observation but were deduced from exploratory studies carried out to confirm the factorial validity of the tool3,4.
Christina Maslach considers Burnout a three-dimensional syndrome, although some authors propose a two-dimensional structure and others expose a factorial structure of four or more dimensions5. However, all consider emotional fatigue as the main nucleus of
the syndrome, and it is the most stable and predictive component of its consequences1,6.
The disparity in results on the factor structure and psychometric properties of MBI is due to the heterogeneity of the samples used in the different studies. There is no unanimous criterion on the cut-off points to be used to diagnose burnout and to calculate its prevalence, but the instrument has been adapted to different languages to avoid distortions in the interpretation of the results5,7,8. Gil-Monte and Peiró validated
the factorial structure of MBI for the Spanish population in 1999 and established cut-off points for this population in 20009.
The health environment supports, among others, three characteristics that are risk factors for the appearance of Burnout: a great mental and physical effort, continuous interruptions and reorganization of tasks, which increase the mental load and effort and dealing with the patient in complex circumstances of anxiety and pain. In addition, the health system is increasingly complex and subject to organizational and technological changes that cause professionals to adapt continuously, increasing stress in the perceived work and the risk of the onset of the syndrome.
Several studies on Burnout were carried out in primary care, specialized hospitals, chronic diseases hospitals and specific areas and services at a national and international level6,10.
However, there are no surveys conducted in medium-long-term hospitals, where, because of the great vulnerability of their patients, it can produce more emotional involvement of the staff than in other types of health institutions.
The objective of the present study was to estimate the prevalence of Burnout in a medium-long stay Hospital, to monitor its evolution and to highlight the importance of the cut-off points used to avoid distortions in the interpretation of results.
METHODS
The study population was the staff of the Doctor Moliner hospital, a public, medium-long stay hospital with 183 beds located in the province of Valencia, Spain. Two serial observational studies were conducted in March 2013 and 2016 to determine the prevalence of Burnout. Participation was voluntary and anonymous.
The instrument used was the Spanish version of the second edition of the Maslach Burnout Inventory-Human Services Survey (MBI-HSS)11 aimed at health professionals.
factors and modulators described in the literature1. The triggering factors evaluated were:
interpersonal relationships between professionals and patients (self-perception of the value of family members and patients), interpersonal relationships at work (self-perception of peers and bosses), and professional appreciation of perceived gains. The modulating factors evaluated were: training, social support, the perception of one’s professional experience and certain personal variables, such as self-efficacy and optimism. The training and interpersonal relationships (valuation as patients, relatives, partners and superiors), were evaluated with a dichotomous scale (yes, no). Professional experience and perceptions about self-efficacy, optimism, gains and social support were assessed on a discrete scale from one to 10. The third part of the questionnaire included the 22 questions from the MBI-HSS test that assessed the degree of affectation of the subscales that define the syndrome – emotional fatigue (EF), depersonalization (DP) and low personal fulfillment (PF). These questions were answered on a seven-degree Likert scale ranging from zero (never) to six (every day).
The questionnaires were considered valid if all MBI-HSS test questions were answered, although there was some lack of response to the variables collected in the first and second part of the questionnaire.
In order to categorize professionals in individuals with high, medium and low affectation levels of the subscales in 2013, the 33rd and 66th percentiles were calculated according to the criteria proposed by Maslach and Jackson2 and were used as their own cut-off
points in both the moments. In addition, to verify if there were differences or distortions in the interpretation of the results according to the cut-off points applied, the cut-off points described in five reference studies regarding Burnout among health professionals were used2,9,11–13.
The sample size was not predetermined since the questionnaires were sent by internal mail to all staff in both cut-offs. The procedure used for sampling and data collection was the same in both studies. At both times, a letter was sent alongside the research, explaining the objectives of the study and asking for the collaboration of the professionals. The questionnaire was self-administered, was distributed in February and responses were collected in March through the suggestion boxes to ensure anonymity. The group had 323 employees in 2013; 318 acknowledgments of receipt were received. The remaining five did not receive the survey for various reasons ( free days vacations, etc.). A total of 125 responses were obtained (39.3% of the participants), of which 100 were valid (participation index = 31.5%). By 2016, the group had 312 employees but received only 257 acknowledgments of receipt. A total of 121 responses (47.1% of participants) were obtained, of which 101 were valid (participation rate = 39.3%).
Position (mean) and dispersion (standard deviation) measures were used to describe the quantitative variables and frequency measures (percentages) for the categorical variables. The independent variables were the sociodemographic characteristics of the staff and their perception of the triggering factors and modulators evaluated. The variables were the degree of affectation of the subscales (score ≥ to the cut-off points considered) and the presence of Burnout (high degree of affectation of the three subscales).
To verify the normal distribution of variables, the Shapiro-Wilk test was used, using parametric models if they were met or their non-parametric equivalents otherwise. In the bivariate analysis, the chi-square test was used to relate qualitative variables, the t-Student test for quantitative variables and the one-way ANOVA test for quantitative variables against qualitative variables of three or more categories, with the Bonferroni post hoc correction.
Table 1. Sociodemographic characteristics of the Hospital group and of the research participants (2013–2016).
2013 Group 2016 Group
Population characteristics of survey participants 2013 2016 Statistical significance Mean (SD)/n (%) Mean (SD)/n (%) (n = 100)a (n = 101)a p (95%CI)
Age: 44.25 (8.2) Age: 48.4 (8.7) Age (years) - mean (SD) 45.1 (8.96) 47.2 (9.68) p = 0.50
Female: 262 (81.2) Female: 251 (80.4) Gender - n (%) p = 0.71
Type of contract Type of contract Women 80 (81.6) 82 (83.7)
Fixed: 78 (24.2) Fixed: 80 (25.6) Type of contract - n (%) p = 0.99a
Non-fixed: 245 (75.8) Non-fixed: 232 (74.4) Fixed: 38 (38.0) 41 (41.4)
Professional category Professional category Interim 53 (53.0) 48 (48.5) OR = 0.84 (0.47–1.51)
Doctors: 25 (7.7) Doctors: 25 (8) Accumulation of tasks 1 (1.0) 0 (0.0) Not available for
evaluation
NUG: 96 (29.7) NUG: 92 (29.5) Eventual 8 (8.0) 10 (10.1) OR = 1.16 (0.41–3.24)
Nursing Assistant:
91 (28.2) Nursing assistant: 89 (28.5) Professional category - n (%) p = 0.02a.b
Janitors: 42 (13) Janitors: 41 (13.1) Doctors 6 (6.1) 16 (16.0)
Others 69 (21.4) Others 65 (20.7) NUG 39 (39.4) 44 (44.0) OR = 0.42 (0.15–1.19)
Nursing assistant 37 (37.4) 33 (33.0) OR = 0.33 (0.12–0.95)
Janitors 11 (11.1) 5 (5.9) OR = 0.17 (0.04–0.70)
Others 6 (6.1) 2 (2.0) OR = 0.13 (0.02–0.80)
Years of experience - n (%): p = 0.03a.b
< 5 8 (8.0) 4 (4.0)
5–9 20 (20.0) 17 (17.0) OR = 1.70 (0.44–6.65)
10–14 26 (26.0) 19 (19.0) OR = 1.46 (0.38–5.57)
15–19 21 (21.0) 21 (21.0) OR = 2.00 (0.52–7.67)
≥ 20 25 (25.0) 39 (39.0) OR = 3.12 (0.85–11.4)
Years of experience - n (%): p = 0.90a
< 5 42 (42.4) 40 (39.6)
5–9 29 (29.3) 30 (29.7) OR = 1.09 (0.56–2.12)
10–14 18 (18.2) 8 (7.9) OR = 0.47 (0.18–1.19)
15–19 5 (5.1) 7 (6.9) OR = 1.47 (0.43–5.01)
≥ 20 5 (5.1) 7 (6.9) OR = 1.47 (0.43–5.01)
Marital status - n (%): p = 0.43a
Single 19 (19.0) 14 (14.6)
Married or with family 66 (66.0) 67 (69.8) OR = 1.38 (0.64–2.97)
Divorced 12 (12.0) 12 (12.5) OR = 1.36 (0.47–3.90)
Widowed 2 (2.0) 3 (3.1) OR = 2.04 (0.30–13.85)
Firings in the last year - n (%) 23 (23.0) 17 (16.8) p = 0.27
Chronic disease - n (%) 30 (30.6) 25 (24.8) p = 0.36
Received specific training - n (%) 71 (72.4) 61 (61.0) p = 0.09
Feels valued by patients - n (%) 71 (83.5) 80 (92.0) p = 0.09
Feels appreciated by family members - n (%) 62 (73.8) 72 (86.7) p = 0.04b Feels appreciated by co-workers - n (%) 78 (85.7 78 (84.8) p = 0.86
Feels appreciated by bosses - n (%) 59 (66.3) 64 (68.8) p = 0.72
What is your overall appreciation of your work
experience? - mean (SD) 7.73 (1.78) 7.55 (1.72) p = 0.48
Do you consider yourself an optimist? - mean (SD) 7.79 (1.91) 7.83 (1.65) p = 0.87 What is the value of your earnings in relation to the
work you do? - mean (SD) 4.79 (2.51) 4.89 (2.29) p = 0.77
Do you believe that you perform well in your daily
work (self-efficacy)? - mean (SD) 8.43 (1.41) 8.37 (1.16) p = 0.74 Do you feel supported in your personal life
(friends, family etc.)? - mean (SD) 8.55 (1.65) 8.90 (1.17) p = 0.09 SD: standard deviation; NUG: nursing university graduate; OR: odds ratio
a Mantel-Hanzel test. b p < 0.05
The reference category is the first.
To transform the variables evaluated by discrete scale into categorical variables, a new variable called “high perception” was created, considering that this level was reached when its score was higher than eight. For the Burnout subscales, a new variable named ‘high affectation’ was coded, considering that this level was reached when the Gil-Monte cut-off points were exceeded9. The odds ratio (OR) and its 95% confidence interval (CI)
were used to quantify the degree of association of the independent variables with the Burnout subscales. The adjusted analysis was performed using binary logistic regression, including in the model the potentially confounding variables according to the Maldonado-Greeland criterion19.
Statistical analysis was performed using the IBM SPSS Statistics program, version 19.0.
The study was approved by the Management and the Commissions of Quality, Bioethics, and Teaching and Research. For the application of the instrument, the explicit consent of the participants was not requested, since the participation was voluntary and anonymous, the response and delivery of the completed research implied that consent and was included in the prior information given to the staff.
RESULTS
The sociodemographic data of the group and the characteristics of the professionals participating in the research were presented in Table 1. Significant differences were observed in relation to the professional category and the time worked of the participants in both moments of the study, with an increase in the participation of the group of doctors and professionals with more than 20 years working. Regarding the triggering factors and modulators, we observed a better self-perception of the valorization by the relatives in the 2016 cut-off.
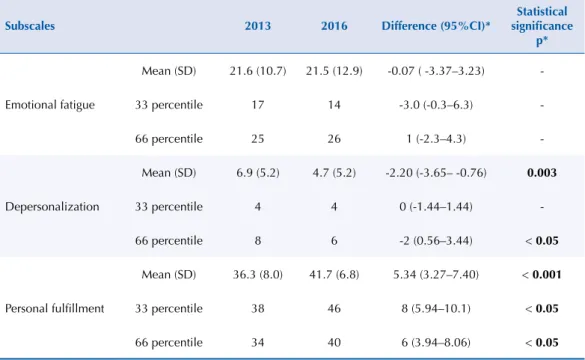
The mean scores of the subscales at both moments and their 33 and 66 percentiles were presented in Table 2. The values obtained place our professionals in an average level of professional fatigue, although the fatigue observed in 2016 was lower, with significant differences between the two moments for DP and PF.
Table 2. Mean scores and 33 and 66 percentiles of the subscales obtained in the study, 2013–2016.
Subscales 2013 2016 Difference (95%CI)*
Statistical significance
p*
Emotional fatigue
Mean (SD) 21.6 (10.7) 21.5 (12.9) -0.07 ( -3.37–3.23)
-33 percentile 17 14 -3.0 (-0.3–6.3)
-66 percentile 25 26 1 (-2.3–4.3)
-Depersonalization
Mean (SD) 6.9 (5.2) 4.7 (5.2) -2.20 (-3.65– -0.76) 0.003
33 percentile 4 4 0 (-1.44–1.44)
-66 percentile 8 6 -2 (0.56–3.44) < 0.05
Personal fulfillment
Mean (SD) 36.3 (8.0) 41.7 (6.8) 5.34 (3.27–7.40) < 0.001
33 percentile 38 46 8 (5.94–10.1) < 0.05
66 percentile 34 40 6 (3.94–8.06) < 0.05
SD: Standard deviation
* Differences = 2016 minus 2013; (t-Student).
Table 3. Burnout frequency and degree of affectation of the subscales (MBI-HSS) obtained in the study according to the cut-off points proposed by different authors (2013–2016).
Normative criteria
Subscales
Cut-off points Degree of affectation
2013 2016 Significación estadística
p* Mean (SD) n (%) n (%)
Cut-off points per tertiles, as recommended by Maslach Cut made in 2013 (n = 100)
Emotional fatigue 21.6 (10.7)
≤ 17 Low 37 (37.0) 46 (45.5)
0.69
18–25 Medium 31 (31.0) 20 (19.8)
> 25 High 32 (32.0) 35 (34.7)
Depersonalization 6.9 (5.2)
≤ 4 Low 33 (33.0) 57 (56.4)
0.007
5–8 Medium 35 (35.0) 28 (27.7)
> 8 High 32 (32.0) 16 (15.8)
Personal fulfillment 36.3 (8.0)
> 38 Low 34 (34.0) 75 (74.2)
< 0.001
34–38 Medium 33 (33.0) 14 (13.9)
≤ 34 High 33 (33.0) 12 (11.9)
Burnout n (%) 5 (5.0) 3 (3.0) 0.46
Cut-off points of Maslach and Jackson EEUU, 1986 (health personnel) (n = 11,067)
Emotional fatigue 21.0 (10.7)
< 17 Low 32 (32.0) 41 (40.6)
0.24
17–26 Medium 41 (41.0) 25 (24.8)
≥ 27 High 27 (27.0) 35 (34.7)
Depersonalization 8.7 (5.9)
< 7 Low 49 (49.0) 76 (75.2)
0.62
7–12 Medium 40 (40.0) 16 (15.8)
≥ 13 High 11 (11.0) 9 (8.9)
Personal fulfillment 34.6 (7.1)
≥ 39 Low 34 (34.0) 75 (74.3)
0.01
32–38 Medium 45 (45.0) 20 (19.8)
< 32 High 21 (21.0) 6 (5.9)
Burnout n (%) 3 (3.0) 1 (1.0) 0.31
Cut-off points of Seisdedos Spain, 1997 (multi-occupational sample)
(n = 1,138)
Emotional fatigue 22.2 (9.3)
< 15 Low 25 (25.0) 36 (35.6)
0.60
15–24 Medium 39 (39.0) 25 (24.8)
≥ 25 High 36 (36.0) 40 (39.6)
Depersonalization 7.2 (5.2)
< 4 Low 27 (27.0) 56 (55.4)
0.07
4–9 Medium 47 (47.0) 29 (28.7)
≥ 10 High 26 (26.0) 16 (15.8)
Personal fulfillment 36.5 (7.3)
≥ 40 Low 29 (29.0) 70 (69.3)
0.002
33–39 Medium 49 (49.0) 24 (23.8)
< 33 High 22 (22.0) 7 (6.9)
Burnout n (%) 7 7.0) 3 (3.0) 0.19
Cut-off points of Gil-monte and Peiró Spain, 2000 (multi-occupational sample)
(n = 1,188)
Emotional fatigue 20.4 (11.0)
< 16 Low 30 (30.0) 39 (38.6)
0.60
16–24 Medium 34 (34.0) 22 (21.8)
≥ 25 High 36 (36.0) 40 (39.6)
Depersonalization 6.4 (5.3)
< 4 Low 27 (27.0) 56 (55.4)
0.01
4–8 Medium 41 (41.0) 28 (27.7)
≥ 9 High 32 (32.0) 17 (16.8)
Personal fulfillment 36.0 (7.3)
≥ 40 Low 29 (29.0 70 (69.3)
< 0.001
36–39 Medium 30 (30.0) 15 (14.9)
< 36 High 41 (41.0) 16 (15.8)
Burnout n (%) 14 (14.0) 5 (5.0) 0.03
Cut-off points of Neira Argentina, 2004 (health personnel)
(n = 1,152)
Emotional fatigue 18.7 (11.4)
< 12 Low 17 (17.0) 23 (22.8)
0.61
12–21 Medium 42 (44.0) 33 (32.7)
≥ 22 High 41 (41.0) 45 (44.6)
Depersonalization 6.1 (5.8)
< 3 Low 20 (20.0) 45 (44.6)
< 0.001
3–6 Medium 29 (29.0) 31 (30.7)
≥ 7 High 51 (51.0) 25 (24.8)
Personal fulfillment 37.3 (7.8)
≥ 41 Low 29 (29.0) 70 (69.3)
< 0.001
36–40 Medium 30 (30.0) 15 (14.9)
< 36 High 41 (41.0) 16 (15.8)
Burnout n (%) 20 (20.0) 5 (5.0) 0.001
Cut-off points of Schaufeli
Holanda, 1995 (multi-occupational sample diagnosed with Burnout) (n = 142)
Emotional fatigue 28.6 (10.1)
<26 Low 17 (17.0) 23 (22.8)
0.61
26-33 Medium 42 (42.0) 33 (32.7)
≥ 34 High 41 (41.0) 45 (44.6)
Depersonalization 9.3 (4.9)
< 6 Low 40 (40.0) 66 (65.3)
0.15
6-11 Medium 42 (42.0) 24 (23.8)
≥ 12 High 18 (18.0) 11 (10.9)
Personal fulfillment 27.0 (5.7)
≥ 29 Low 86 (86.0) 98 (97.0)
0.11
26-28 Medium 6 (6.0) 0 (0.0)
< 26 High 8 (8.0) 3 (3.0)
Burnout n (%) 3 (3.0) 1 (1.0) 0.31*
SD: standard deviation; MBI-HSS: Maslach Burnout Inventory
Table 4. Differences in the interpretation of the results of “high degree of affectation of the subscales” and prevalence of Burnout according to the normative criteria considered.
Normative criteria
Emotional fatigue Depersonalization Personal fulfillment Burnout 2013 2016 2013 2016 2013 2016 2013 2016 n (N) n (N) n (N) n (N) n (N) n (N) n (N) n (N)
p* p* p* p* p* p* p* p*
Gil-Monte
(Reference category) 36 (64) 40 (61) 32 (68) 17 (84) 41 (59) 16 (85) 14 (86) 5 (96)
Maslach 27 (73)0.17* 35 (66)0.467* 11 (89)
< 0.001*
9 (92)
0.09* 21 (79)0.002*
6 (95)
0.02*
3 (97)
0.005* 1 (100)0.09*
Seisdedos 36 (64)1* 40 (61)1* 26 (74)0.35* 16 (85)0.85* 22 (78)0.003* 7 (94)0.04* 7 (930.1* 3 (98)0.47*
Neira 41 (59)0.46* 45 (56)0.47* 51 (49)
0.006*
25 (76)
0.16* 41 (59)1* 16 (85)1* 20 (80)0.25* 5 (96)1*
Schaufeli 41 (59)0.46* 45 (56)0.47* 18 (82)
0.02*
11 (90)
0.22* < 0.001*8 (92)
3 (98) 0.001* 3 (97) 0.005* 1 (100) 0.09* * Statistical significance of the differences observed in the results of a high degree of affectation of the subscales and Burnout prevalence (Gil-Monte criteria versus the other normative criteria considered) (Chi-square test). n: Number of individuals with a high degree of affectation of the subscale (3).
N: Number of individuals with medium or low-level affectation of the subscale (1, 2). Values with statistical significance are highlighted in bold.
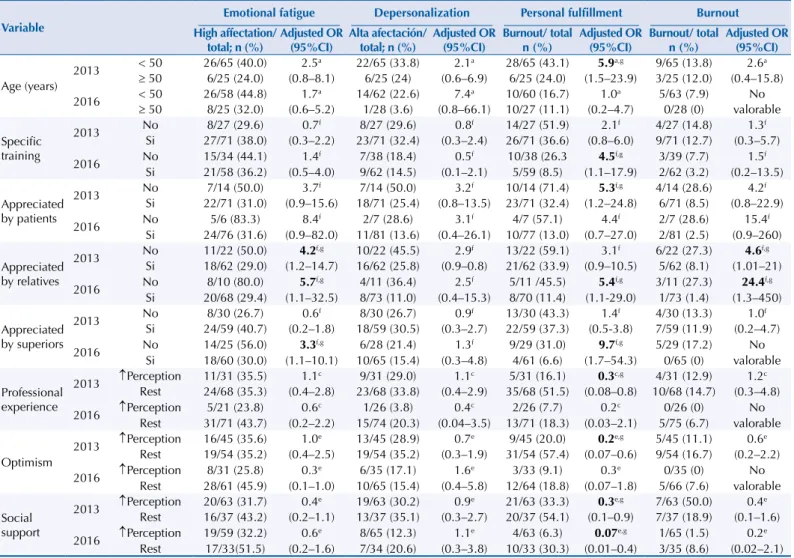
Table 5. Association of sociodemographic, triggering and modulating variables with Burnout subscales according to Gil-Monte cut-off points (2013–2016).
Variable
Emotional fatigue Depersonalization Personal fulfillment Burnout High affectation/
total; n (%)
Adjusted OR (95%CI)
Alta afectación/ total; n (%)
Adjusted OR (95%CI) Burnout/ total n (%) Adjusted OR (95%CI) Burnout/ total n (%) Adjusted OR (95%CI) Age (years)
2013 < 50≥ 26/65 (40.0) 2.5a 22/65 (33.8) 2.1a 28/65 (43.1) 5.9a,g 9/65 (13.8) 2.6a
50 6/25 (24.0) (0.8–8.1) 6/25 (24) (0.6–6.9) 6/25 (24.0) (1.5–23.9) 3/25 (12.0) (0.4–15.8)
2016 < 50≥ 26/58 (44.8) 1.7a 14/62 (22.6) 7.4a 10/60 (16.7) 1.0a 5/63 (7.9) No
50 8/25 (32.0) (0.6–5.2) 1/28 (3.6) (0.8–66.1) 10/27 (11.1) (0.2–4.7) 0/28 (0) valorable
Specific training
2013 No 8/27 (29.6) 0.7f 8/27 (29.6) 0.8f 14/27 (51.9) 2.1f 4/27 (14.8) 1.3f
Si 27/71 (38.0) (0.3–2.2) 23/71 (32.4) (0.3–2.4) 26/71 (36.6) (0.8–6.0) 9/71 (12.7) (0.3–5.7)
2016 No 15/34 (44.1) 1.4f 7/38 (18.4) 0.5f 10/38 (26.3 4.5f,g 3/39 (7.7) 1.5f
Si 21/58 (36.2) (0.5–4.0) 9/62 (14.5) (0.1–2.1) 5/59 (8.5) (1.1–17.9) 2/62 (3.2) (0.2–13.5)
Appreciated by patients
2013 No 7/14 (50.0) 3.7f 7/14 (50.0) 3.2f 10/14 (71.4) 5.3f,g 4/14 (28.6) 4.2f
Si 22/71 (31.0) (0.9–15.6) 18/71 (25.4) (0.8–13.5) 23/71 (32.4) (1.2–24.8) 6/71 (8.5) (0.8–22.9)
2016 No 5/6 (83.3) 8.4f 2/7 (28.6) 3.1f 4/7 (57.1) 4.4f 2/7 (28.6) 15.4f
Si 24/76 (31.6) (0.9–82.0) 11/81 (13.6) (0.4–26.1) 10/77 (13.0) (0.7–27.0) 2/81 (2.5) (0.9–260)
Appreciated by relatives
2013 No 11/22 (50.0) 4.2f,g 10/22 (45.5) 2.9f 13/22 (59.1) 3.1f 6/22 (27.3) 4.6f,g
Si 18/62 (29.0) (1.2–14.7) 16/62 (25.8) (0.9–0.8) 21/62 (33.9) (0.9–10.5) 5/62 (8.1) (1.01–21)
2016 No 8/10 (80.0) 5.7f,g 4/11 (36.4) 2.5f 5/11 /45.5) 5.4f,g 3/11 (27.3) 24.4f,g
Si 20/68 (29.4) (1.1–32.5) 8/73 (11.0) (0.4–15.3) 8/70 (11.4) (1.1-29.0) 1/73 (1.4) (1.3–450)
Appreciated by superiors
2013 NoSi 24/59 (40.7)8/30 (26.7) (0.2–1.8)0.6f 18/59 (30.5)8/30 (26.7) (0.3–2.7)0.9f 22/59 (37.3)13/30 (43.3) (0.5-3.8)1.4f 7/59 (11.9)4/30 (13.3) (0.2–4.7)1.0f
2016 No 14/25 (56.0) 3.3f,g 6/28 (21.4) 1.3f 9/29 (31.0) 9.7f,g 5/29 (17.2) No
Si 18/60 (30.0) (1.1–10.1) 10/65 (15.4) (0.3–4.8) 4/61 (6.6) (1.7–54.3) 0/65 (0) valorable
Professional experience
2013 ↑PerceptionRest 11/31 (35.5)24/68 (35.3) (0.4–2.8)1.1c 23/68 (33.8)9/31 (29.0) (0.4–2.9)1.1c 35/68 (51.5)5/31 (16.1) (0.08–0.8)0.3c,g 10/68 (14.7)4/31 (12.9) (0.3–4.8)1.2c
2016 ↑Perception 5/21 (23.8) 0.6c 1/26 (3.8) 0.4c 2/26 (7.7) 0.2c 0/26 (0) No
Rest 31/71 (43.7) (0.2–2.2) 15/74 (20.3) (0.04–3.5) 13/71 (18.3) (0.03–2.1) 5/75 (6.7) valorable
Optimism
2013 ↑Perception 16/45 (35.6) 1.0e 13/45 (28.9) 0.7e 9/45 (20.0) 0.2e,g 5/45 (11.1) 0.6e Rest 19/54 (35.2) (0.4–2.5) 19/54 (35.2) (0.3–1.9) 31/54 (57.4) (0.07–0.6) 9/54 (16.7) (0.2–2.2)
2016 ↑Perception 8/31 (25.8) 0.3e 6/35 (17.1) 1.6e 3/33 (9.1) 0.3e 0/35 (0) No
Rest 28/61 (45.9) (0.1–1.0) 10/65 (15.4) (0.4–5.8) 12/64 (18.8) (0.07–1.8) 5/66 (7.6) valorable
Social support
2013 ↑Perception 20/63 (31.7) 0.4e 19/63 (30.2) 0.9e 21/63 (33.3) 0.3e,g 7/63 (50.0) 0.4e Rest 16/37 (43.2) (0.2–1.1) 13/37 (35.1) (0.3–2.7) 20/37 (54.1) (0.1–0.9) 7/37 (18.9) (0.1–1.6)
2016 ↑Perception 19/59 (32.2) 0.6e 8/65 (12.3) 1.1e 4/63 (6.3) 0.07e,g 1/65 (1.5) 0.2e
Rest 17/33(51.5) (0.2–1.6) 7/34 (20.6) (0.3–3.8) 10/33 (30.3) (0.01–0.4) 3/35 (8.6) (0.02–2.1) a Adjusted for gender, time in the job, type of contract and professional category.
b Adjusted for age, time in the job, type of contract and professional category. c Adjusted for age, gender, time in the job, and professional category. d Adjusted for age, gender, type of contract and time in the job. e Adjusted for age, gender, type of contract and professional category. f Adjusted for age, professional category, type of contract and time in the job. g p < 0.05
Our average for the EF in the 2016 cut-off (21.5) was higher than the mean value of the seven studies consulted (19.9). Our mean for the PF scale was also higher than the mean value of these studies (PF2016 = 41.7 versus 34.4), while our score on the DP scale was lower than the
mean value (DP2016 = 4.7 versus 7.1).
The results of Burnout prevalence and degree of affectation of the subscales varied greatly according to the normative criteria applied. In Table 3, the results obtained in both moments were presented, comparing their interpretation according to the normative values considered. The most restrictive criterion was that of Schaufeli.
For EF, no differences in interpretation of results were observed, whereas, for DP, PF and Burnout prevalence, cross-cultural differences were observed in the interpretation of the results when applying the Gil-Monte criteria against the rest of the cut-off points considered (Table 4).
The sociodemographic variables showed little association with the outcome variables, whereas a high perception of some of the modulating variables did, however, show an association with Burnout and with the high affectation of the subscales that define it (Table 5).
DISCUSSION
To calculate the prevalence of Burnout, different cut-off points were used, evidencing the importance of selecting appropriate normative values to avoid distortions in the interpretation of the results. The prevalence obtained varied greatly depending on the cut-off points used. The reason for this variability is that, in order to define the cut-off points that evaluate the syndrome, Maslach and Jackson2 propose to use the 33rd and 66th
percentiles, so that they divide the sample into three equal groups for each subscale. But this method provides different cut-off points depending on the population studied. This variability is due to the occupational and cross-cultural differences of the samples used in the different studies. The cut-off points defined by Maslach for the American population are higher for EF and DP than for Europeans, while their normative values are lower for PF, significant differences were observed in relation to the application of cut-off points obtained in samples of Hispanic language. The most restrictive criterion is that of the Schaufeli because, since it is based on the percentiles obtained on a sample of professionals with occupational stress problems, it is the only criterion validated clinically for the diagnosis of Burnout. In this study, as in other studies7,20, we obtained lower prevalence
when applying this criterion, since these cut-off points only detect clinically relevant cases.
The participation rate was less than 50%, although in similar studies conducted through self-administered and anonymous questionnaires sent to health personnel it is difficult to overcome this rate7,14. However, some authors had higher rates, above 60%, in studies performed on more
specific groups or in the primary care setting15. The participation rate increased by 8% in the
2016 cut-off, indicating a certain increase in adherence to the procedure.
There are several studies on burnout and occupational stress in health professionals, but many present methodological limitations. Some studies report low, medium and high percentages of EF, DP, and PF, without considering the means of the subscales nor the prevalence of the syndrome21. Others contribute the data of the prevalence of
Burnout, but it is difficult to compare the results obtained by different researchers. This difficulty is due to the fact that different normative criteria were used22, considering the
results on many occasions of American cutoffs16 or values of their own tertiles17. Some
classify as Burnout professionals with a medium or high level of affectation of the three subscales15,18 or diagnose the syndrome when two of the subscales are affected at high
level23, oversizing the prevalence of the syndrome. Other studies, such as ours, were
the results24. However, almost all studies agree that the main manifestation of the
syndrome and the most stable in time is EF1,6, also observed in our study. Significant
differences were observed between the two moments for the DP and PF subscales, but the EF showed no significant changes.
We verified the variability of the percentile statistical criterion proposed by Maslach for the calculation of the population cut-off points since the values obtained in 2016 were significantly different from those of 2013. This variability corroborates the need to establish normative criteria that are standardized, stable and according to the characteristics of the studied population. In MBI, by not defining a clinical criterion of reference that clearly identifies the people who developed the syndrome, the classification is arbitrary and can induce errors in the interpretation of the results, especially when the subscales do not present an adjusted distribution to the normality20. Many authors propose using specific
cut-offs by country and profession9,12,25 to avoid such distortions. In our study, to research
the association between variables, we used the normative criteria defined by Gil-Monte9
for a Spanish multi-occupational sample, since they are the ones that best adapt to the characteristics of the studied population.
Analyzing the influence of sociodemographic variables, we observed the association between age and personal achievement in the 2013 cut-off, with greater personal fulfillment in older professionals. These results differ from those observed in other studies, in which the association between certain sociodemographic variables and the presence of Burnout was observed10,15,17,26. There is no consensus in the configuration of the epidemiological profile of
the syndrome15,18. Regarding gender, there are studies in which women are more affected26,27,
others find men11,15 and others do not find significant differences, as was our case.
According to our results, social support acted as a protective factor for PF in both cut-offs, probably because it cushioned work stress, also described in the literature28. On the contrary,
they acted as risk factors for EF, PF, and the presence of Burnout, low appreciation for patients, family members, and superiors. The DP scale showed no association with any of the variables considered, whereas the PF was the scale that showed a greater number of associations with the explanatory variables, as happened in other studies consulted10,14,17. Lack of training and a
negative perception of the assessment by patients, relatives and superiors increased the risk of affectation of the subscale, while a high perception of professional experience, optimism, and social support acted as protective factors.
For some authors, certain personal and work characteristics (chaotic environment, poor interpersonal relations, feelings of inequality) are associated with high levels of Burnout15,29.
Others found an association between Burnout and low levels of empathy30 because if the
environment is toxic, it changes the dynamics at work and generates stress.
The characteristics of this study do not allow us to draw general conclusions. But it can expose the possibility of reducing professional fatigue by applying measures that reduce the stress in the work and to improve the quality of life of the workers. The efficacy that professionals who need help may have is doubtful16. Professional vocation, certain personality traits, and
well-rounded teamwork, with clear, realistic goals and assumed by all, are the best antidote to Burnout. Professionals with a positive personality, optimism and self-efficacy are less likely to be exhausted10, findings also observed in our study.
Our professionals present an average level of professional fatigue, similar to that obtained in other studies performed in primary care or in chronic care hospitals, although the emotional component affects more our environment.
The prevalence of Burnout varied significantly as a function of the cut-off points applied. This confirms the importance of using normative values according to the characteristics of the studied population to avoid cross-cultural distortions in the interpretation of the results.
REFERENCES
1. Maslach C, Schaufeli WB, Leiter MP. Job burnout. Annu Rev Psychol. 2001;52:397-422.
https://doi.org/10.1146/annurev.psych.52.1.397
2. Maslach C, Jackson SE. Maslach Burnout Inventory. 2.ed. Palo Alto: Consulting Psychologists Press; 1986. 3. Shirom A, Melamed S. A comparison of the construct validity of two burnout
measures in two groups of professionals. Int J Stress Manag. 2006;13(2):176-200.
https://doi.org/10.1037/1072-5245.13.2.176
4. Taris TW, Le Blanc PM, Schaufeli WB, Schreurs PJG. Are there causal relationships between the
dimensions of the Maslach Burnout Inventory? A review and two longitudinal tests. Work Stress.
2005;19(3):238-55. https://doi.org/10.1080/02678370500270453
5. Loera B, Converso D, Viotti S. Evaluating the psychometric properties of the Maslach Burnout Inventory-Human Services Survey (MBI-HSS) among Italian nurses:
how many factors must a researcher consider? PLoS One. 2014;9(12):e114987.
https://doi.org/10.1371/journal.pone.0114987
6. Lee RT, Seo B, Hladkyj S, Lovell BL, Schwartzmann L. Correlates of physician burnout
across regions and specialties: a meta-analysis. Hum Resour Health. 2013;11:48.
https://doi.org/10.1186/1478-4491-11-48
7. Grau-Alberola E, Gil-Monte PR, García-Juesas JA, Figueiredo-Ferraz H. Incidence of burnout in
Spanish nursing professionals: a longitudinal study. Int J Nurs Stud. 2010;47(8):1013-20. https://
doi.org/10.1016/j.ijnurstu.2009.12.022
8. Kim H, Juye Ji. Factor structure and longitudinal invariance of the Maslach Burnout Inventory.
Res Soc Work Pract. 2009;19(3):325-39.
9. Gil-Monte PR, Peiró JM. Un estudio comparativo sobre criterios normativos y diferenciales para el diagnóstico del síndrome de quemarse por el trabajo (burnout) según el MBI-HSS en España.
Rev Psicol Trab Organ. 2000;16(2):135-49.
10. Cañadas-De la Fuente GA, Vargas C, San Luis C, García I, Cañadas GR, De la Fuente EI.
Risk factors and prevalence of burnout syndrome in the nursing profession. Int J Nurs Stud.
2015;52(1):240-9. https://doi.org/10.1016/j.ijnurstu.2014.07.001
11. Seisdedos-Cubero N. Versión española del Maslac h Burnout Inventory. Madrid: Ediciones TEA; 1997 12. Schaufeli WB, Van Dierendonck D. A cautionary note about the cross-national and
clinical validity of cut-off points for the Maslach Burnout Inventory. Psychol Rep.
1995;76(3 Pt 2):1083-90.
13. Neira MC. Cuando se enferman los que curan: estrés laboral y burnout en los profesionales de la salud. Buenos Aires: Gambacop; 2004.
14. Grau A, Suñer R, García MM. Desgaste profesional en el personal sanitario y su relación con los
factores personales y ambientales. Gac Sanit. 2005 [cited 2017 Nov 29];19(6):463-70. Available
from: http://scielo.isciii.es/pdf/gs/v19n6/original6.pdf
15. Prieto Albino L, Robles Agüero E, Salazar Martínez LM, Daniel Vega E. Burnout en médicos
de atención primaria de la provincia de Cáceres. Aten Primaria. 2002;29(5):294-302.
https://doi.org/10.1016/S0212-6567(02)70567-2
16. Albaladejo R, Villanueva R, Ortega P, Astasio P, Calle ME, Domínguez V. Síndrome de Burnout en
el personal de enfermería de un hospital de Madrid. Rev Esp Salud Publica. 2004;78(4):505-16.
17. Pera G, Serra-Prat M. Prevalencia del síndrome del quemado y estudio de los factores asociados
en los trabajadores de un hospital comarcal. Gac Sanit. 2002 [cited 2017 Nov 29];16(6):480-6.
18. Jiménez Blanco S, Frutos LLanes R, Blanco Montagut LE. Síndrome de Burnout: estudio de la prevalencia y factores de riesgo en los profesionales de enfermería de Atención Primaria
de Ávila. Rev Enferm Cyl. 2011 [cited 2017 Nov 29];3(2):13-24. Available from: http://www.
revistaenfermeriacyl.com/index.php/revistaenfermeriacyl/article/view/60/47
19. Maldonado G, Greenland S. Simulation study of confounder-selection strategies. Am J
Epidemiol. 1993;138(11):923-36.
20. Gil-Monte PR, Marucco MA. Prevalencia del “síndrome de quemarse por el trabajo”
(burnout) en pediatras de hospitales generales. Rev Saude Publica. 2008;42(3):450-6.
https://doi.org/10.1590/S0034-89102008000300009
21. Caballero Martín MA, Bermejo Fernández F, Nieto Gómez R, Caballero Martínez F. Prevalencia
y factores asociados al burnout en un área de salud. Aten Primaria. 2001;27(5):313-7.
22. Domínguez Fernández JM, Herrera Clavero F, Villaverde Gutiérrez MC, Padilla Segura I, Martínez Bagur ML, Domínguez Fernández J. Síndrome de desgaste profesional en trabajadores
de atención a la salud en el área sanitaria de Ceuta. AtenPrimaria. 2012;44(1):30-5.
https://doi.org/10.1016/j.aprim.2011.01.004
23. Fonseca M, Sanclemente G, Hernández C, Visiedo C, Bragulat E, Miró O. Residentes, guardias y síndrome
de burnout. Rev Clin Esp(Barc). 2010;210(5):209-15. https://doi.org/10.1016/j.rce.2009.12.006
24. Reyna C, Bracco C. Síndrome de Burnout y estrategias de afrontamiento en acompañantes
terapéuticos. Rev Invest Psicol. 2011;14(2);31-45. https://doi.org/10.15381/rinvp.v14i2.2098
25. Schaufeli WB, Bakker AB, Hoogduin K, Schaap C, Kladler A. On the clinical validity of the
Maslach burnout inventory and the burnout measure. Psychol Health. 2001;16(5):565-82.
https://doi.org/10.1080/08870440108405527
26. Atance Martínez C. Aspectos epidemiológicos del síndrome de Burnout en personal sanitario.
Rev Esp Salud Publica. 1997 [cited 2017 Nov 29];71(3):293-303. Available from: http://scielo.
isciii.es/pdf/resp/v71n3/burnout.pdf
27. Teixeira C, Ribeiro O, Fonseca AM, Carvalho AS. Burnout in intensive care units: a consideration of the possible prevalence and frequency of new risk factors: a descriptive correlational
multicentre study. BMC Anesthesiol. 2013;13(1):38. https://doi.org/10.1186/1471-2253-13-38
28. Mingote Adán JC, Moreno Jiménez B, Gálvez Herrer M. Desgaste profesional y salud de los
profesionales médicos: revisión y propuestas de prevención. Med Clin. 2004;123(7):265-70.
29. Salanova M, Del Líbano M, Llorens S, Schaufeli WB. Engaged, workaholic, burned-out or
just 9-to-5? Toward a typology of employee well-being. Stress Health.2014;30(1):71-81.
https://doi.org/10.1002/smi.2499
30. Yuguero O, Ramon Marsal J, Esquerda M, Vivanco L, Soler-González J. Association between low
empathy and high burnout among primary care physicians and nurses in Lleida, Spain. Eur J Gen
Pract. 2017;23(1):4-10. https://doi.org/10.1080/13814788.2016.1233173
Authors’ Contribution: MJMP: study conception and design, data analysis and interpretation, article writing and review; responsible and guarantor that all aspects of the manuscript were reviewed and discussed among
the authors. FJCH, NAB, ETM, AMA, NFB: collaboration in the study design, data analysis, article writing and review and approval of the final version for publication.