Artigo
*e-mail: [email protected]
THERMOGRAVIMETRIC APPROACH FOR ASSESSING THE OXIDATION LEVEL OF A BIODIESEL SAMPLE
Luis Díaz-Ballotea,*, Karen Gómez-Hernándeza, Elsy T. Vega-Lizamaa, Miguel A. Ruiz-Gómeza, Luis Maldonadoa and
Emanuel Hernándezb
aDepartment of Applied Physics, Center for Research and Advanced Studies of the National Polytechnic Institute, A. P. 73 Cordemex, Mérida, Yucatán, 97310, México
bDepartment of Sea Resources, Center for Research and Advanced Studies of the National Polytechnic Institute, A. P. 73 Cordemex, Mérida, Yucatán, 97310, México
Recebido em 21/09/2017; aceito em 04/01/2018; publicado na web em 08/02/2018
Biodiesel, unlike diesel, is highly susceptible to autoxidation. This autoxidation is a major concern for a biodiesel producer. Various methods have been developed to estimate the degree of oxidative stability of biodiesel. These methods are useful to compare and estimate the oxidative stability between different biodiesel samples. However, an absolute value of the oxidative state will be more useful. In this study, we describe a method of estimating a figure that can be used as an indicator of the oxidation level. This indicator was determined from the thermal decomposition curve of biodiesel, as obtained from the thermogravimetric test. Biodiesel from waste cooking oil was oxidized at 80, 100 and 120 °C using different exposure areas (19.6, 63.6, and 153.9 cm2). The percentage of oxidation, measured from low (80 °C, 19.6 cm2) to highly aggressive conditions (120 °C, 153.9 cm2), was in the range of 0.4
± 0.1 and 23.5 ± 3.3. Kinematic viscosity was also measured for the oxidized samples, and a strong correlation (R2=0.96) was observed between the percentage of oxidation products and kinematic viscosity. In addition, the oxidative effect of temperature and area of exposure on the biodiesel samples was confirmed by ultraviolet spectroscopy.
Keywords: oxidation of biodiesel; thermogravimetric analysis; waste cooking oil, oxidative stability, biodiesel.
INTRODUCTION
Biodiesel is a green fuel alternative that is considered to be renewable, environmentally friendly, biodegradable and non-toxic.1,2 This fuel is derived from vegetable oil, or animal fat. It has low sulfur content, low particulate emissions and a neutral contribution of CO2 to the environment.3 Therefore, this alternative fuel is a candidate for total or partial substitution of petrodiesel in diesel engines.
Biodiesel is commonly obtained by the transesterification reaction, where vegetable oil or animal fat is mixed with a short chain alcohol, like methanol or ethanol, and a catalyst (KOH or NaOH).4 The biodiesel must be purified, and it must comply with quality specifications listed in relevant standards such as ASTM D67515 or EN 14214,6 before this green fuel is ready for use in compression engines. Oxidation of biodiesel results in remarkable changes in the physical and chemical properties7 of the fuel, and in general, the changes have negative effects on the biodiesel quality. Therefore, the degree of oxidation of biodiesel is a major concern for biodiesel producers. The main driving force of the oxidation process is the presence of double bonds8 in the chemical structure of the mono-alkyl esters. The oxidation process begins with the loss of hydrogen atoms from the chemical structure that subsequently leads to formation of alkyl-radicals. Afterward, the newly formed radicals react with oxygen forming peroxides that, in turn, react again and give rise to the formation of more alkyl-radicals or hydroperoxides.9 This cycle consumes esters and ends with the formation of stable compounds such as ketones, aldehydes, ethers and alkanes.
The relation between oxidation and quality has encouraged a development of various methods for evaluating the oxidative stability of biodiesel. The most common methods in use are: the Rancimat method, the oxygen bomb test, and the active oxygen method (AOM). In addition, the use of novel methods such as near-infrared (NIR)
spectroscopy,10 Fourier transform infrared (FTIR) spectroscopy,11-13 chemiluminescence,14 UV-Vis absorption and thermogravimetry have been proposed.15
In the Rancimat method, a small sample of oil or biodiesel (2-3 g) is placed in a glass tube, and heated up to 120 °C. Next, air is passed through the sample and collected in deionized water. The oxidation starts with the formation of acid, volatile products that are trapped in the water increase its conductivity. From a plot of time vs. conductivity, the induction period (IP) is determined and used as an indicator of the oxidative stability. The oxygen bomb method uses 50 g of fat in a metal container which is sealed and pressurized with oxygen. Next, the bomb is heated to 99 °C. In this method, a decrease in pressure is used to determine the oxidative stability. The active oxygen method (AOCS method Cd 12-57) requires bubbling dry air through 20 g of oil at a constant temperature (98 °C). The peroxide value is monitored every 2 h. The limit of the peroxide value is 20 meq/kg per AOCS method Cd 8-53. On the other hand, in our previous study,16 we demonstrated that the residual mass exhibited by a thermogravimetric curve of the biodiesel thermal decomposition can be used as an indicator of its oxidation level. Whereas, in this study, a simple method based on the residual mass is used to determine a quantitative figure for the oxidation level of a biodiesel sample. This method gives an estimate of the absolute oxidation state, unlike other methods that provide the relative oxidation of the biodiesel. With the index proposed, the biodiesel sample can be rejected or accepted on a non-subjective basis, depending on the oxidation level.
EXPERIMENTAL
of methanol to waste cooking in the presence of KOH as a catalyst. Several parameters relevant to the oxidative stability for fresh biodiesel (FB) are listed in Table 1. The purity of the biodiesel was determined from the weight lost due to volatilization of biodiesel in thermogravimetric curves.17 Kinematic viscosity was measured at 40 °C using an Ubbelohde viscometer following the procedure described in ASTM D-445. The density was determined by measuring the specific gravity with a hygrometer (ROBSAN-1107, México) with a range of 0.80 to 0.90 and a Polyscience 9106A11B circulating bath following the ASTM D-1298 standard.
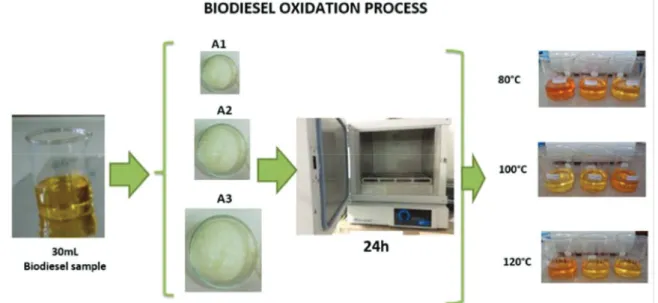
Biodiesel with different oxidation levels were produced with modifications to a method described by Knothe.18 Samples of biodiesel (30 mL) were poured into petri dishes with diameters of 5.0 cm (A1=19.6 cm2), 9.0 cm (A2=63.6 cm2) and 14.0 cm (A3 = 153.9 cm2). A sample without oxidation was used as a blank and coded as FB (fresh biodiesel). The petri dishes containing the biodiesel samples were heated in an oven (Isotemp vacuum oven, Model 281 A, Fisher Scientific, Pittsburgh, PA) to a specific constant temperature (80, 100 or 120 °C). All accelerated oxidation tests were performed at least in triplicate, at a fixed exposure time of 24 h. Figure 1 shows a scheme to illustrate the accelerated oxidation process which was performed with different areas and temperatures in atmospheric air.
Thermogravimetric analysis was carried out using a thermobalance (Discovery series, TA Instruments, New Castle, DE). Measurement conditions were: average mass of the samples 10 ± 0.5 mg, range of temperature from 50 to 600 °C, heating rate of 10 °C/min and nitrogen flow of 50 mL/min. Kinematic viscosity measurements were made at 40 °C with an Ubbelohde type viscometer, size 1 with a range from 2 to 10 mm2 s-1 per the ASTM D445 method. UV-visible (UV-Vis) spectra of oxidized biodiesel samples were recorded from 190 to 300 nm, using a model EPP2000 spectrophotometer (StellarNet, Tampa, FL). The samples were diluted (1:500 v:v) with hexane reagent grade (Sigma-Aldrich).
RESULTS AND DISCUSSION
Thermogravimetric analysis
Thermogravimetric analysis (TGA) is a technique where the mass lost is recorded as a function of increasing temperature in a controlled environment. The technique provides data concerning the thermal decomposition of a compound to its volatile form. TGA is used to study a pure compound or a mixture. Although biodiesel is a mixture of mono-alkyl esters, most of them decompose in a relatively narrow and defined range of temperatures. This characteristic allows differentiation between biodiesel and its contaminants. For example, in a mono-alkyl ester and vegetable oil mixture, the amount of each component can be estimated because both have different decomposition temperature regions.19,20 The ability of TGA to determine the biodiesel purity has been compared with nuclear magnetic resonance (NMR) spectroscopy and the result is an acceptable discrepancy of ±1.5%.17 A similar principle can be used to determine the percentage of oxidation products present in a biodiesel sample, as described below.
Figure 2 shows a typical thermal decomposition curve of a FB sample used in this study. It can be observed that the thermal decomposition of the biodiesel sample is in the range of 198 to 251 °C. The observed weight loss is attributed to the ester content which is nearly 97.8% in mass. A FB can be used as an initial reference to estimate the percentage of oxidation or another option is to use the European standard UN 142146 that specifies a minimum purity value of 96.5% in mass. Clearly, in this case the FB complies with this specification. The temperature interval for the FB decomposition is similar to the temperature interval reported for the thermal decomposition of Jatropha oil methyl esters (168 – 218 °C).21
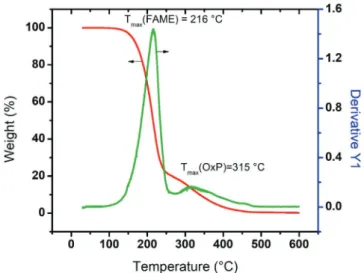
Typical thermogravimetric (TG) and derivative thermogravimetric (DTG) curves of a biodiesel sample oxidized at 120 °C with an exposition area of 63.6 cm2 (A
2) is presented in Figure 3 to illustrate the applicability of TGA in the oxidation of biodiesel. The TG curve shows the weight loss as a function of temperature. Clearly two significant steps are observed and confirmed by the DTG curve, which has two evident peaks. The first step is attributed to the esters that compose the biodiesel. The second step is attributed to the oxidation products. The key temperatures are Tmax(FAME) at 216 °C and Tmax(OxP) at 315 °C, which corresponds to the maximum rate of weight loss of fatty acid methyl esters (FAME) and oxidation
Table 1. Properties of fresh biodiesel
Property Value a
Purity (ester content) 97.5 ± 0.9 (mass %) Kinematic viscosity, 40 °C 4.8 ± 0.026 (mm2s-1) Density, 15 °C 0.877 ± 5.510-3 (gcm-3) aValues are the mean of triplicate measurements
± the standard error.
products (OxPs). The difference between these temperatures allows differentiation of the FAMEs from OxPs.
Figure 4 shows typical TG curves of biodiesel samples at different atmospheric air exposure areas (A1, A2, and A3) as well as different heating temperatures (80, 100, and 120 °C). The effect of the area on the amount of oxidation products is very small at 80 °C in comparison with the residual mass of FB. Due to the poor amount of oxidation products formed at 80 °C, these conditions are not recommendable for an accelerated oxidation test. When the temperature is increased to 100 °C, the percentage of oxidation products increases and are detectable for areas A2 and A3. The level of oxidation is remarkable on the sample oxidized at 120 °C when the biggest area (A3) is used. The catalytic effect of temperature on the oxidation process of biodiesel is well known. An increase in the contact area between biofuel and atmospheric air allows major oxygen exchange at the biodiesel/air interface. The amount of oxidation products increases with increasing temperature and area. The percentage of oxidation (in mass %) is calculated using equation (1), as
PO (%)= ROP - RFB (1) where PO: Percentage of oxidation, % m/m; ROP: Percentage of residual mass lost from oxidized biodiesel at Tmax(OxP), % m/m; RFB: Percentage of residual mass lost from fresh biodiesel at the same Tmax(OxP), % m/m.
Table 2 shows the average PO that is formed after the accelerated biodiesel oxidation tests. The tests are conducted at 80, 100 and 120 °C with three different atmospheric exposure areas (A1<A2<A3).
The amount of oxidation products increases with increasing the temperature and area of biodiesel exposed to atmospheric air.
The values in Table 2 are obtained using the PO of fresh biodiesel at Tmax(OxP) as referenced. However, even without a fresh sample of biodiesel, a rough estimation of the PO can be determined using the purity (96.5%) specified in the UN 14214 standard as reference.
Kinematic viscosity
The effect of the oxidation on the kinematic viscosity of a biodiesel sample is shown in Figure 5. A small increase in viscosity is observed at 80 °C, though none of the samples exceed the upper viscosity limit (6.0 mm2 s-1) specified by ASTM D6751. An increase in temperature to 100 °C causes an increase in the formation of oxidation products. The only sample that complies with the standard specifications is the sample oxidized with the smallest area (A1).
When the oxidation temperature is raised to 120 °C, a notorious increase in viscosity, regardless of the size of the area used for the oxidation process, was obvious. The increase in viscosity with increasing oxidation of a biodiesel sample has been reported in previous studies.22 The increase in viscosity has been related to a high level of biodiesel oxidation due to the presence of oligomers of high polarity and molecular weight forming undesirable deposits.11 In addition, viscosity has been associated with the methyl ester content and the products of the transesterification reaction;23 as a consequence, changes in biodiesel purity, due to oxidation, cause a change in viscosity.
UV-Vis spectroscopy
To illustrate the oxidation process and avoid signal saturation, the samples of biodiesel oxidized at 100 °C were used as representative
Figure 2. Typical thermogravimetric curve of fresh biodiesel (FB)
Figure 3. Typical TG (red trace) and DTG (green trace) curves of biodiesel oxidized at 120 °C and A2=63.6 cm2
Figure 4. TG curves of biodiesel samples oxidized at different temperatures and exposition areas (A1<A2<A3)
Table 2. Average percentage of oxidation
Area of biodiesel ex-posed to air (cm2)
Percentage of oxidationa 80 (°C) 100 (°C) 120 (°C) 19.6 (A1) 0.4 ± 0.1 0.5 ± 0.2 0.9 ± 0.3 63.6 (A2) 1.3 ± 0.5 2.7 ± 1.0 8.4 ± 1.2 153.9 (A3) 1.6 ± 0.3 12.7 ± 1.6 23.5 ± 3.3 avalues reported are mean of triplicate measurements
for UV-vis analysis. The results are shown in Figure 6. The main absorption bands, in the wavelength range of 220-300 nm, are centered approximately at 232 and 270 nm and these are assigned to the formation of conjugated dienes and secondary oxidation products. As observed, the peak at 232 nm grows as a function of exposure area, whereas the peak at 270 nm increases slightly with the exposure area. This result indicates that an increase in conjugated dienes, as a result of degradation of unsaturated mono-alkyl esters,24 confirms higher levels of oxidation with increased exposure area. Accordingly, the accelerated oxidation test achieves the objective and provides different oxidation states.
Relationship between PO and viscosity
Viscosity of a liquid is a measure of its resistance to flow. It is mainly affected by the size of the molecule. Thermal degradation leads to the formation of insoluble high molecular weight polymers7 that have more resistance to flow. Therefore, an increase in oxidation products results in increased viscosity. In Figure 7, the viscosities of all samples are graphed vs. percentages of oxidation products, without considering the oxidation conditions. Linear fit between PO and viscosity (R2=0.96) suggests that either the amount of oxidation products or viscosities can be a good quantitative approach to the absolute oxidation state. This result agrees with studies that show strong correlations between the mono-alkyl esters (biodiesel purity) and viscosity or mass loss in thermogravimetric analysis.17,23,25
CONCLUSIONS
Biodiesel from waste cooking oil was oxidized at various temperatures and atmospheric air exposure areas. Samples of oxidized biodiesel were studied by thermogravimetric analysis, and the thermal decomposition curves obtained were used to quantify the percentage of oxidation products formed during the test. In addition, the effect of the accelerated oxidation test on the biodiesel was confirmed by UV-Vis spectroscopy. From the experimental results, the following conclusions could be drawn:
• Under the experimental conditions of this study, the percentages of oxidation products measured at 80 °C for all exposure areas were not enough to increase viscosities beyond the upper limit specified by the standard ASTM D6751.
• In this study, the percentage of oxidation products, as well as viscosities, became important at 100 and 120 °C, particularly when the exposure areas A2 (63.6 cm2) and A3 (153.9 cm2) were used.
• A strong relationship between the amount of oxidation products and viscosities (R2=0.96) was found, suggesting the potential use of both parameters to estimate the oxidation level of a biodiesel sample.
• Unlike conventional methods that only provide a measure of relative oxidative stability, the percentage of oxidation (PO) provides a simple way to determine an estimation of the absolute oxidation state of a biodiesel sample.
ACKNOWLEDGMENTS
The authors thank the National Council of Science and Technology (CONACYT) of México for the financial support as well as PhD scholarship of E.T.Vega-Lizama (CVU 367896), Cátedra-Conacyt Projects 1710 (M. Ruiz-Gómez) and 1568 (E. Hernández-Nuñes). Thermogravimetrics analysis were performed at Laboratorio Nacional de Nano y Biomateriales (LANNBIO), under grants FOMIX-Yucatán 2008-108160 and CONACYT LAB-2009-01 No.123913.
REFERENCES
1. Ma, F.; Hanna, M. A.; Bioresource. Technol.1999, 70, 1. 2. Fukuda, H.; Kondo, A.; Noda, H.; J. Biosci. Bioeng.2001, 92, 405. 3. Kiss, A. A.; Dimian, A. C.; Rothenberg, G.; Adv. Synth. Catal.2006,
348, 75.
4. Leung, D. Y.; Wu, X.; Leung, M.; Appl. Energy2010, 87, 1083. 5. American Society for Testing and Materials; ASTM D6751-09, Standard
Figure 5. Kinematic viscosity of oxidized samples of biodiesel at three different temperatures (80, 100, and 120 °C) and three different areas (A1<A2<A3) of
exposure to atmospheric air
Figure 6. Typical UV-visible spectra of biodiesel samples oxidized at 100 °C with three different atmospheric air exposure areas (A1<A2<A3)
Specification for Biodiesel Fuel Blend Stock (B100) for Middle Distillate Fuels, 2009.
6. European Committee for Standardization; European Standard EN 14214-Automotive fuels – Fatty acid methyl esters (FAME) for diesel engine – Requirements and test methods, 2003.
7. Dunn, R. O.; J. Am. Oil Chem. Soc.2002, 79, 915.
8. Meira, M.; Quintella, C. M.; dos Santos Tanajura, A.; Da Silva, H. R. G.; Fernando, J. D. E. S.; da Costa Neto, P. R.; Pepe, I. M.; Santos, M. A.; Nascimento, L. L.; Talanta2011, 85, 430.
9. Knothe, G.; Fuel Process. Technol.2007, 88, 669.
10. Zhang, W.-B.; Renew. Sustainable Energy Rev.2012, 16, 6048. 11. Fang, H. L.; McCormick, R. L.; Spectroscopic study of biodiesel
degradation pathways, Report 0148-7191, SAE Technical Paper, 2006. 12. Furlan, P. Y.; Wetzel, P.; Johnson, S.; Wedin, J.; Och, A.; Spectrosc. Lett.
2010, 43, 580.
13. Savi, E. L.; Herculano, L. S.; Lukasievicz, G. V.; Torquato, A. S.; Baesso, M. L.; Astrath, N. G.; Malacarne, L. C.; Energy Fuels2017, 31, 7132.
14. Mathäus, B. W.; J. Am. Oil Chem. Soc.1996, 73, 1039. 15. Dwivedi, G.; Sharma, M. P.; Egypt. J. Pet.2016, 25, 33.
16. Vega-Lizama, T.; Díaz-Ballote, L.; Hernández-Mézquita, E.; May-Crespo, F.; Castro-Borges, P.; Castillo-Atoche, A.; González-García, G.; Maldonado, L.; Fuel2015, 156, 158.
17. Chand, P.; Reddy, C. V.; Verkade, J. G.; Wang, T.; Grewell, D.; Energy Fuels2009, 23, 989.
18. Knothe, G.; Eur. J. Lipid Sci. Technol.2006, 108, 493.
19. Sousa, F.; Luciano, M.; Pasa, V.; Fuel Process. Technol.2013, 109, 133. 20. Ouanji, F.; Nachid, M.; Kacimi, M.; Liotta, L. F.; Puleo, F.; Ziyad, M.;
Chin. J. Chem. Eng.2016, 24, 1178.
21. Rashid, U.; Anwar, F.; Jamil, A.; Bhatti, H. N.; Pak. J. Bot.2010, 42, 575.
22. Bannister, C.; Chuck, C.; Bounds, M.; Hawley, J.; Proc. Inst. Mech. Eng., Part D2011, 225, 99.
23. De Filippis, P.; Giavarini, C.; Scarsella, M.; Sorrentino, M.; J. Am. Oil Chem. Soc.1995, 72, 1399.
24. Oliveira, I. P.; Souza, A. F.; Lescano, C. H.; Caires, A. R. L.; Muzzi, R. M.; J. Am. Oil Chem. Soc.2015, 92, 403.
25. Usmanov, R. A.; Mazanov, S. V.; Gabitova, A. R.; Miftakhova, L. K.; Gumerov, F. M.; Musin, R. Z.; Abdulagatov, I. M.; J. Chem. Eng. Data
2015, 60, 3404.