© FECAP
DOI: 10.7819/rbgn.v16i52.1782
Subject Area: Accounting And Controlling
RBGN
Perceived controllability and fairness in Performance evaluation
Percepção de Controlabilidade e Equidade da Avaliação de Desempenho
La percepción de la
controlabilidad
y de la justicia en la evaluación de desempeño
Eduardo Schiehll1Suzanne Landry2
Received on January 21, 2014 / Approved on October 23, 2014 Responsible editor: João Maurício Gama Boaventura, Dr. Evaluation process: Double Blind Review
1. Doctor in Accounting from HEC Montreal. [[email protected]] 2. Doctor in Taxation from the University of Florida. [[email protected]]
Authors’ address: 3000, Chemin De La Côte-Sainte-Catherine, Postal Code: H3T2A7 Montréal, Canada ABSTRACT
We investigated the effects of environmental uncertainty, decentralization of decisions rights, and the use of subjective performance measures on managers’ perceptions of outcome controllability and performance evaluation fairness. Based on a survey of 339 middle- and upper- level managers, our results suggest that environmental uncertainty adversely affects perceptions of outcome controllability and that this effect is not moderated by the decentralization of decision rights. Our results also show a positive association between perceived controllability and performance evaluation fairness. Although we found no direct effect of the use of subjective performance measures on perceived performance evaluation fairness, it appears to moderate the positive effect of perceived controllability on fairness. We also show that the positive effect of the use of subjective measures may depend on contextual and job-related factors. The overall results underscore the need to consider the organizational context (environmental
uncertainty and decentralization of decision rights) to investigate how performance measures affect perceived controllability and fairness. Because perceived controllability and fairness affect individual attitudes and behaviors within an organization, our results have important implications for the design and use of performance evaluation systems.
Keywords: Controllability. Performance Evaluation Fairness. Subjective Measures. Environmental Uncertainty. Decentralization.
RESUMO
que a incerteza ambiental afeta negativamente a percepção de controlabilidade e que este efeito não é moderado pelo nível de descentralização da tomada de decisões. Os resultados sugerem também uma associação positiva entre a percepção de controlabilidade e de equidade no processo de avaliação de desempenho gerencial. Embora o uso de medidas subjetivas de desempenho não exerça efeito direto sobre a percepção de equidade, os resultados sugerem que seu uso exerce efeito moderador na relação entre controlabilidade e percepção de equidade. Demonstra-se ainda que o efeito positivo do uso de medidas subjetivas depende de fatores contextuais. Este estudo demonstra a necessidade de se considerar o contexto organizacional (incerteza ambiental e descentralização dos direitos decisórios) para investigar como medidas de desempenho não financeiras e subjetivas afetam a percepção de controlabilidade e de equidade processual. Na medida em que a percepção de controlabilidade e de equidade afeta as atitudes e os comportamentos dos indivíduos dentro de uma organização, os resultados têm implicações importantes para a concepção e utilização de sistemas de avaliação de desempenho.
Palavras-chave: Controlabilidade. Equidade processual. Avaliação de desempenho. Medidas subjetivas. Incerteza ambiental. Descentralização.
RESUMEN
El estudio investiga los efectos de la incertidumbre medioambiental, de la descentralización de la toma de decisión, la utilidad de las medidas de desempeño subjetivas de la percepción de controlabilidad de los resultados (controllability) y la justicia de proceso en la evaluación del desempeño gerencial. Partiendo de los datos obtenidos con la aplicación de una encuesta, con una muestra de 339 directivos de nivel medio y superior, los resultados indican que la incertidumbre medioambiental afecta negativamente a la percepción de la controlabilidad, y que este efecto no es moderado por el nivel de descentralización de la toma de decisiones. Los resultados también sugieren una asociación positiva entre la percepción de
la controlabilidad y la justicia de proceso de evaluación de desempeño gerencial. Aunque el uso de medidas subjetivas de desempeño no tenga efecto directo sobre la percepción de la justicia, los resultados indican que su uso tiene un efecto moderado en la relación entre la controlabilidad y la percepción de la justicia. Además, muestra que los efectos positivos del uso de las medidas subjetivas dependen de factores contextuales. Este estudio muestra la necesidad de considerar el contexto organizativo (incertidumbre medioambiental y descentralización de los derechos de decisión) para investigar cómo las medidas de desempeño no financieras y subjetivas afectan a la percepción de la controlabilidad y de la justicia procesal. Conforme la percepción de controlabilidad y de justicia afecta las actitudes y los comportamientos de los individuos dentro de una organización, los resultados tienen implicaciones importantes para la concepción y utilidad del sistema de evaluación de desempeño.
Palabras clave: Controlabilidad. Justicia procesal. Evaluación de desempeño. Medidas subjetivas. Incertidumbre medioambiental. Descentralización.
1 INTRODUCTION
out uncontrollable events or correct for noisy performance measures, we also investigate whether the use of subjective measures moderates the association between perceived controllability and performance evaluation fairness.
Our results suggest that environmental uncertainty adversely affects perceptions of outcome controllability and that this effect is not moderated by the decentralization of decision rights. Our results also show a positive association between perceived controllability and performance evaluation fairness. Although we found no direct effect of the use of subjective performance measures on perceived performance evaluation fairness, it appears to moderate the positive effect of perceived controllability on fairness. We also show that the positive effects of the use of subjective measures may depend on contextual and job-related factors.
The overall results underscore the need to consider the organizational context, i.e., environmental uncertainty and decentralization of decision rights, to investigate how perceived controllability and fairness are affected by the choice of performance measures. Because perceived controllability and fairness affect individual attitudes and behaviors within an organization, our results have important implications for the design and use of performance evaluation systems. In sum, our findings call into question the use of subjective measures to mitigate performance evaluation problems. This has important implications for management accountants, who usually participate actively in the design and implementation of performance evaluation systems.
2 THEORETICAL BACKGROUND AND
HYPOTHESES
2.1 Environmental uncertainty and outcome
controllability
Environmental uncertainty refers to a broad set of factors that, individually and
collectively, make it difficult or impossible to predict the future. Also, environmental uncertainty can stem from changes in natural conditions, the political or economic climate, or the actions of competitors, customers, suppliers, and regulators (MERCHANT; VAN DER STEDE, 2007). According to Chenhall (2003) and Agbejule (2005), environmental uncertainty plays an important role in how managers perceive and use information generated by management accounting systems. In addition, experimental studies indicate that the motivational and cognitive resources that individuals need to achieve tasks are adversely affected when they judge that the contingencies in their environment a r e u n c o n t r o l l a b l e ( M A RTO C C H I O ; DULEBOHN, 1994).
Following this perspective, we expect environmental uncertainty to be negatively associated with perceptions of outcome controllability for the following reasons. Firstly, environmental uncertainty adversely affects the organization’s capacity to set performance targets against which to evaluate managerial performance (GOVINDARAJAN, 1984). Secondly, effective performance evaluation requires complete knowledge about the outcomes associated with specific managerial actions, which is possible only when conditions are stable (THOMPSON, 1967). Thirdly, most performance indicators focus on outcomes rather than on processes. In times of high environmental uncertainty, these measures alone cannot adequately reflect all dimensions of managerial performance (MATEJKA; MERCHANT; VAN DER STEDE, 2009). Finally, environmental uncertainty blurs the distinction between controllable and uncontrollable factors (L AMBERT, 2001; GIRAUD; LANGEVIN; MENDOZA, 2008). We therefore formulated the following hypothesis:
2.2 Decentralization of decision rights and
outcome controllability
We argue that decision rights are decentralized when decision-making authority is pushed down to lower levels. In order to better respond to environmental changes and to encourage managers to more rapidly initiate and implement value-enhancing decisions, all firms decentralize decision rights, at least to some extent and in specific operational areas (MERCHANT; VAN DER STEDE, 2007). For example, Galbraith (1973) suggests that, in uncertain environments, relevant information is required when and where the task is being executed, and that a decentralized decision rights structure facilitates information processing. From a management control perspective, this suggests that organizations would benefit when managers operating in uncertain environments have more decision-making autonomy. This argument is supported by studies that examined the effects of perceived environmental uncertainty and decentralization of the decision rights on the design of management accounting systems (GORDON; NARAYANAN, 1984; GUL et al., 1995) and the positive interaction effect of environmental uncertainty and decentralization of decision rights on managerial performance (GUL et al., 1995; AGBEJULE, 2005).
As discussed above, we contend that in times of high environmental uncertainty, a decentralized decision rights structure is required to reduce information asymmetry and improve the managerial decision-making process. We therefore expect that in organizations operating in relatively high environmental uncertainty, decentralization of decision rights would moderate the adverse effect of environmental uncertainty on managers’ perceptions of performance outcome controllability. This leads to the following hypotheses:
H2a: Decentralization of decision rights is positively associated with perceived outcome controllability.
H2b: Decentralization of decision rights moderates the negative association between perceived environmental uncertainty and outcome controllability: the weaker the association, the higher the decentralization of decision rights.
2.3 Outcome controllability and performance
evaluation fairness
We take the perspective that fairness is most likely perceived when performance measures are perceived as highly relevant and able to provide accurate unbiased information about individual efforts and contributions. Our view is corroborated by Leventhal (1980) and Greenberg (1986). Several studies (GIRAUD; LANGEVIN; MENDOZA, 2008; HARTMAN; SLAPNICAR 2009; LAU; MOSER, 2008; MOERS, 2005; SHOLIHIN; PIKE, 2009) support Leventhal’s rules and suggest that managers perceive performance measures that are affected by uncontrollable factors as unfair. Similarly, Baker, Gibbons and Murphy’s (1994) agency-based model suggests that an employee’s contribution to firm value is rarely completely captured by objective performance measures, and that superiors, who are well placed to observe subtleties of employee behavior, should use all relevant and private information to adjust for uncontrollable events. Accordingly, scholars advise organizations to use formal systems with caution, including performance evaluation systems, which might affect fairness perceptions (FOLGER; LEWIS, 1995; LATHAM et al., 2005; SHOLIHIN; PIKE, 2009). This leads to the following hypothesis:
H3: Perceived outcome controllability is positively associated with perceptions of performance evaluation fairness.
2.4 Subjective performance measures and
performance evaluation fairness
in performance evaluation. For instance, the studies by Libby (1999), Giraud, Langevin and Mendoza (2008), Lau, Wong and Eggleton (2008), and Hartmann and Slapnicar (2009) have shown that perceived performance evaluation fairness is influenced by performance measure properties. Basically, there are two main premises. First, when a performance metric is influenced by uncontrollable factors, it becomes noisy and less informative about the impact of managers’ actions. Second, as discussed above, holding managers accountable for events that are out of their control may result in perceptions of unfairness. Accounting-based, objective performance measures provide some information about agents’ efforts, but are often contaminated by uncontrollable random events that occur outside the firm (e.g., environmental uncertainty) or within the firm (e.g., decentralization of decision rights) (GERDIN, 2005; GHOSH; LUSCH, 2000; LAU; WONG; EGGLETON, 2008; MERCHANT; VAN DER STEDE, 2007). Therefore, the use of subjective measures
grants the appraiser the flexibility to adjust for uncontrollable factors and consider all relevant information (ITTNER; LARCKER; MEYER, 2003; MURPHY; OYER, 2003). Hence, subjective measures can be used to complement incomplete, objective performance measures and improve incentive contracting with managers. This leads to the following hypotheses:
H4a: The use of subjective performance measures is positively associated with perceived performance evaluation fairness. H4b: The use of subjective performance measures moderates the positive association between perceived outcome controllability and performance evaluation fairness: the greater the use of subjective measures, the stronger the association.
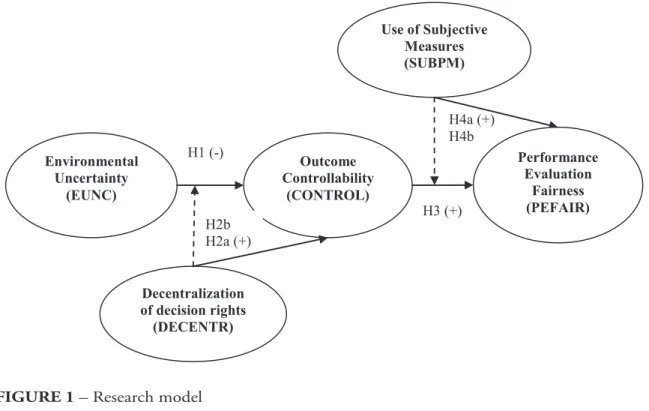
Figure 1 presents our research model, including the main variables of interest and the hypothesized associations.
Outcome Controllability
(CONTROL)
Use of Subjective Measures (SUBPM)
H1 (-)
H2b H2a (+)
H4a (+) H4b
H3 (+)
Environmental Uncertainty
(EUNC)
Decentralization of decisionrights (DECENTR)
Performance Evaluation
Fairness (PEFAIR)
FIGURE 1 – Research model
3 DATA COLLECTION AND
METHODOLOGY
3.1 Data collection
Given the private nature of the data required to investigate our research questions, we used a cross-sectional mail survey, following Dillman, Smyth and Christian (2009) total design method.1 Data source heterogeneity is
an important factor in hypothesis testing, due to the improved variance estimation for the variables to be explained. This improvement stems from the diversity in organizational contexts and behaviors (VAN DER STEDE; YOUNG; CHEN, 2005). We therefore sampled across industries and organizations rather than within a single organization or industry. To build our sample, we targeted experienced managers listed in the Quebec Certified Management Accountants (CMA) membership database. Responding managers had to reside in Canada, have held professional designation for at least three years, and have more than five years’ relevant experience.2 Participants also had to work for
organizations with more than 51 employees, as larger organizations would increase the probability of a performance evaluation system and an associated rewards system. Finally, participants had to have worked for the same employer for more than one year (as at October 2008). These criteria were intended to provide a sample of respondents who held upper-level management
positions, had considerable work experience, and had undergone at least one performance evaluation in the current organization.
The sur vey package included the questionnaire and a self-addressed, pre-paid return envelope. A first email reminder was sent three weeks after the initial mailing and a second six weeks later. The survey administration therefore spanned a total of nine weeks. Of the 3,343 mailed questionnaires, 23 were returned due to wrong addresses. Of the remaining questionnaires, 339 were filled out, for a response rate of 10.1 percent. In order to test for non-response bias (DILLMAN; SMYTH; CHRISTIAN, 2009), we initially compared mean values for respondents and non-respondents in terms of three demographic variables: age, years of experience, and firm size (measured by the number of employees). The results revealed no significant differences. The second step was to perform a t-test to compare early and late responders using the three above-mentioned demographic variables plus the items used to measure perception of performance evaluation fairness. Comparisons between early and late3
responders showed no systematic differences on any variables.
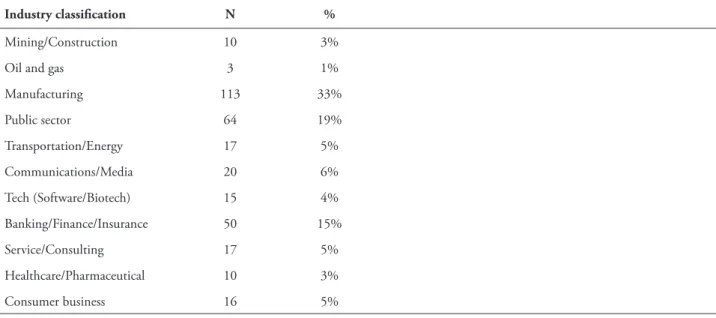
TABLE 1 – Demographic data on respondents (N = 339)
Industry classification N %
Mining/Construction 10 3%
Oil and gas 3 1%
Manufacturing 113 33%
Public sector 64 19%
Transportation/Energy 17 5%
Communications/Media 20 6%
Tech (Software/Biotech) 15 4%
Banking/Finance/Insurance 50 15%
Service/Consulting 17 5%
Healthcare/Pharmaceutical 10 3%
Consumer business 16 5%
Organization size
By number
of employees N (%)
By sales revenues1
(million) N (%)
By total assets
(million) N (%)
< 100 24 (7%) < $20 41 (13%) < $50 76 (25%)
100 - ≤ 499 83 (26%) $20 - < $50 38 (12%) $50 – < $100 30 (10%)
500 – ≤ 999 26 (8%) $50 – < $100 26 (8%) $100 – < $200 18 (6%)
1,000 – ≤ 2,499 40 (12%) $100 – < $200 23 (7%) $200 – ≤ $500 27 (9%)
2,500 – ≤ 4,999 18 (6%) $200 – < $500 37 (11%) $500 – ≤1 billion 24 (8%)
5,000 – ≤ 9,999 35 (11%) $500 – ≤ 1 billion 20 (6%) > 1 billion 129 (42%)
≥10,000 96 (30%) >1 billion 139 (43%)
Missing 13 11 31
Age (years) N % Gender N (%)
30 – ≤ 39 146 43% Male 229(68%)
40 – ≤ 49 106 32% Female 106(32%)
50 – ≤ 59 79 24%
≥ 60 4 1%
Number of years of experience in Average Range
Current position 5.3 1 – 32
Previous positions at this organization 7.1 0 – 33
Previous positions at other organizations 11.3 0 – 41
3.2 Variables measurement
3.2.1 Environmental Uncertainty (EUNC)
Consistent with Gibbs et al. (2004) and Matejka, Merchant and Van der Stede (2009), we use a six-item scale to capture business environment uncertainty. Respondents were asked to rate on a Likert scale from 1 (very low) to 5 (very high) the uncertainty in their business environment in terms of competition, innovation, and predictability (two items for each dimension). We reverse-coded the six items such that higher scores indicate greater environmental uncertainty. Exploratory factor analysis revealed a single construct EUNC composed of four items (Table 4: Cronbach’s alpha = 0.732 and Average Variance Explained (AVE) = 0.518). The items “Competition for main products and services” and “Predictability of competitor market actions”were dropped from the analysis because they did not load significantly. Table 5 reports the descriptive statistics for EUNC, showing a mean value of 2.849, indicating that the respondents generally worked in moderate to high environmental uncertainty. As expected, Table 5 shows that EUNC is negatively correlated with CONTROL and PEFAIR and positively with SUBPM. However, EUNC is marginally correlated with DECENTR.
3.2.2 Decentralization of Decision Right
(DECENTR)
We measured decentralization using Abernethy, Bouwens and Lent (2004) instrument, adapted from Gordon and Narayanan (1984). Managers’ decision-making authority was captured by comparing their influence with the influence of their supervisors on specific decisional areas. The five statements were rated on a Likert scale from 1 (My unit has full influence) to 5 (My superior has full influence) covering the following decisions: business strategy, investment, marketing, operations, and human resource management. To facilitate the interpretation of results, we reverse-coded the five items such that
higher scores indicate greater decentralization of decision rights. The results of the exploratory factor analysis, Cronbach’s alpha (0.757), and AVE (0.473) support the use of a five-item measure as a one-dimensional construct, as presented in Table 4. Table 5 shows that the mean value of DECENTR is 2.220. The Pearson’s correlation coefficients show that DECENTR is not correlated with the other variables of interest, except for EUNC (marginally).
3.2.3 Use of Subjective Performance Measures
(SUBPM)
We adapted Van der Stede, Chow and Lin (2006) survey instrument to capture the use extent of subjective measures in performance evaluation systems. Given the cross-sectional nature of our target sample, we also borrowed performance criteria from performance measurement systems currently used by financial institutions (ITTNER; LARCKER; MEYER, 2003; NISAR, 2007). The final list comprises 40 performance measures divided into three main categories: financial (7); nonfinancial (23), including customer-oriented (8), employee-oriented (7), and internal operating (8); and subjective performance factors (10).4
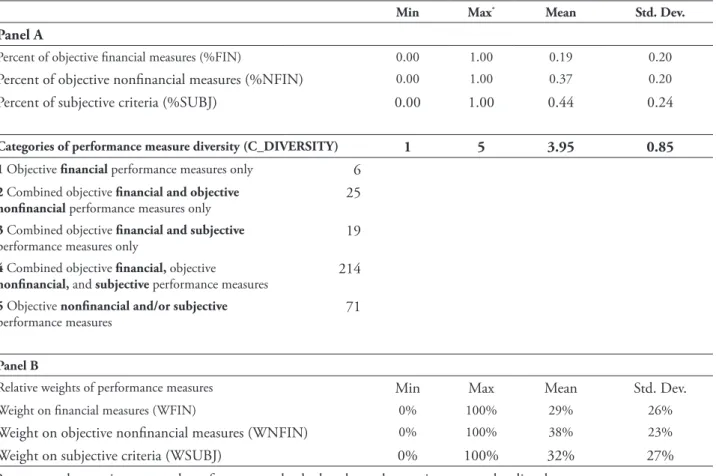
Table 2, Panel B presents data on the number of subjective performance measures used, when compared to the total number of measures used, i.e., subjective plus objective financial and nonfinancial measures (%SUBJ). Similar to Van der Stede, Chow and Lin (2006), we also created a five-category scale variable to capture the use of subjective measures combined with objective financial and non-financial measures (C_DIVERSITY), where higher values indicate greater use of subjective measures.5 We also asked
respondents to indicate the relative weights attributed to the subjective performance factors (WSUBJ).6 Table 2 presents the descriptive
performance measures, our construct (Table 4, Cronbach’s Alpha = 0.908 and AVE = 0.789) captures three dimensions of the use of subjective measures: number, weight, and whether or not
they are combined with objective financial and nonfinancial measures. Table 5 shows that the mean value of SUBPM is 4.133 and that SUBPM is negatively correlated with PEFAIR.
TABLE 2 – Performance measurement practices (N = 339)
Min Max* Mean Std. Dev. Panel A
Percent of objective financial measures (%FIN) 0.00 1.00 0.19 0.20
Percent of objective nonfinancial measures (%NFIN) 0.00 1.00 0.37 0.20
Percent of subjective criteria (%SUBJ) 0.00 1.00 0.44 0.24
Categories of performance measure diversity (C_DIVERSITY) 1 5 3.95 0.85
1 Objective financial performance measures only 6
2 Combined objective financial and objective nonfinancial performance measures only
25
3 Combined objective financial and subjective
performance measures only
19
4 Combined objective financial, objective
nonfinancial, and subjective performance measures
214
5 Objective nonfinancial and/or subjective
performance measures
71
Panel B
Relative weights of performance measures Min Max Mean Std. Dev.
Weight on financial measures (WFIN) 0% 100% 29% 26%
Weight on objective nonfinancial measures (WNFIN) 0% 100% 38% 23%
Weight on subjective criteria (WSUBJ) 0% 100% 32% 27%
*Represents the maximum number of measures checked and not the maximum number listed.
Source: The authors
3.2.4 Outcome Controllability (CONTROL)
The items were derived from the studies by Huffman and Cain (2000) and Giraud, Langevin and Mendoza (2008) and validated through interviews with compensation consultants and management accounting faculty. Respondents were asked to rate their agreement with statements about their control over performance outcomes as well as their perceived relationship between their efforts and performance outcomes. Higher ratings reflect perceptions of greater control over performance outcomes. As shown in Table 4, Cronbach’s alpha (0.858) and AVE (0.557) support the use of the five-item measure as a
one-dimensional construct. As expected, Table 5 shows that CONTROL is positively correlated with PEFAIR.
3.2.5 Performance Evaluation Fairness
(PEFAIR)
evaluation process as fairer. The results in Table 4 support the use of a single construct with a Cronbach’s alpha coefficient of 0.903 and AVE of 0.587. These results are comparable to the reliability indices reported by Lau and Lim (2002) and Berger, Libby and Webb (2009) using similar scales.7 Table 5 shows that the mean value
of PEFAIR is 3.506, and indicates that PEFAIR correlates negatively with EUNC and positively with CONTROL.
3.3 Measurement model
Before estimating the structural equation model, we assessed the quality of our measurement
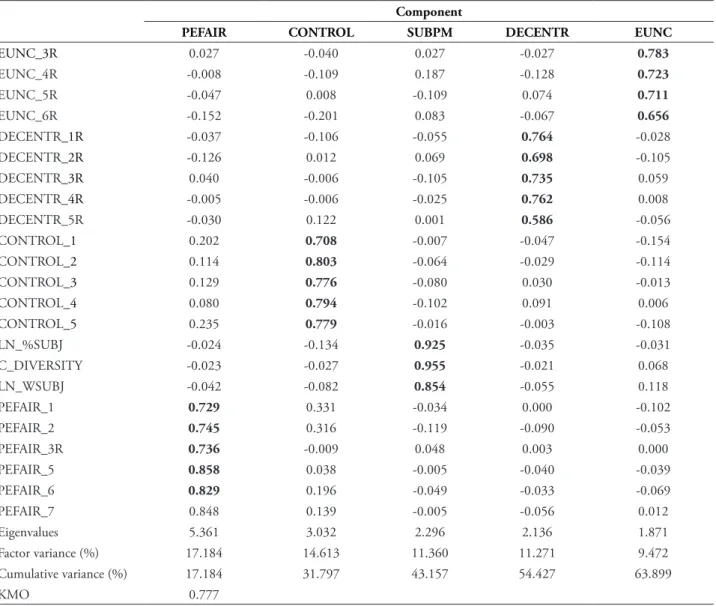
model. We addressed individual item reliability, construct reliability, and convergent and discriminant validity for all the above-described measurement instruments (BAGOZZI; YI, 1988; SHOOK et al., 2004). Cronbach’s alpha is used to assess the reliability of each latent variable. The Principal Components Analysis (PCA) presented in Table 3 confirms the presence of five constructs and supports individual item reliability: all factor loadings are greater than 0.50 on their respective constructs, eigenvalues range from 1.871 to 5.361, individual factors capture from 9% to 17% of the variance, and combined they capture about 64% of the overall variance.
TABLE 3 – Cross-loadings (full sample, N = 339)
Component
PEFAIR CONTROL SUBPM DECENTR EUNC
EUNC_3R 0.027 -0.040 0.027 -0.027 0.783
EUNC_4R -0.008 -0.109 0.187 -0.128 0.723
EUNC_5R -0.047 0.008 -0.109 0.074 0.711
EUNC_6R -0.152 -0.201 0.083 -0.067 0.656
DECENTR_1R -0.037 -0.106 -0.055 0.764 -0.028
DECENTR_2R -0.126 0.012 0.069 0.698 -0.105
DECENTR_3R 0.040 -0.006 -0.105 0.735 0.059
DECENTR_4R -0.005 -0.006 -0.025 0.762 0.008
DECENTR_5R -0.030 0.122 0.001 0.586 -0.056
CONTROL_1 0.202 0.708 -0.007 -0.047 -0.154
CONTROL_2 0.114 0.803 -0.064 -0.029 -0.114
CONTROL_3 0.129 0.776 -0.080 0.030 -0.013
CONTROL_4 0.080 0.794 -0.102 0.091 0.006
CONTROL_5 0.235 0.779 -0.016 -0.003 -0.108
LN_%SUBJ -0.024 -0.134 0.925 -0.035 -0.031
C_DIVERSITY -0.023 -0.027 0.955 -0.021 0.068
LN_WSUBJ -0.042 -0.082 0.854 -0.055 0.118
PEFAIR_1 0.729 0.331 -0.034 0.000 -0.102
PEFAIR_2 0.745 0.316 -0.119 -0.090 -0.053
PEFAIR_3R 0.736 -0.009 0.048 0.003 0.000
PEFAIR_5 0.858 0.038 -0.005 -0.040 -0.039
PEFAIR_6 0.829 0.196 -0.049 -0.033 -0.069
PEFAIR_7 0.848 0.139 -0.005 -0.056 0.012
Eigenvalues 5.361 3.032 2.296 2.136 1.871
Factor variance (%) 17.184 14.613 11.360 11.271 9.472
Cumulative variance (%) 17.184 31.797 43.157 54.427 63.899
KMO 0.777
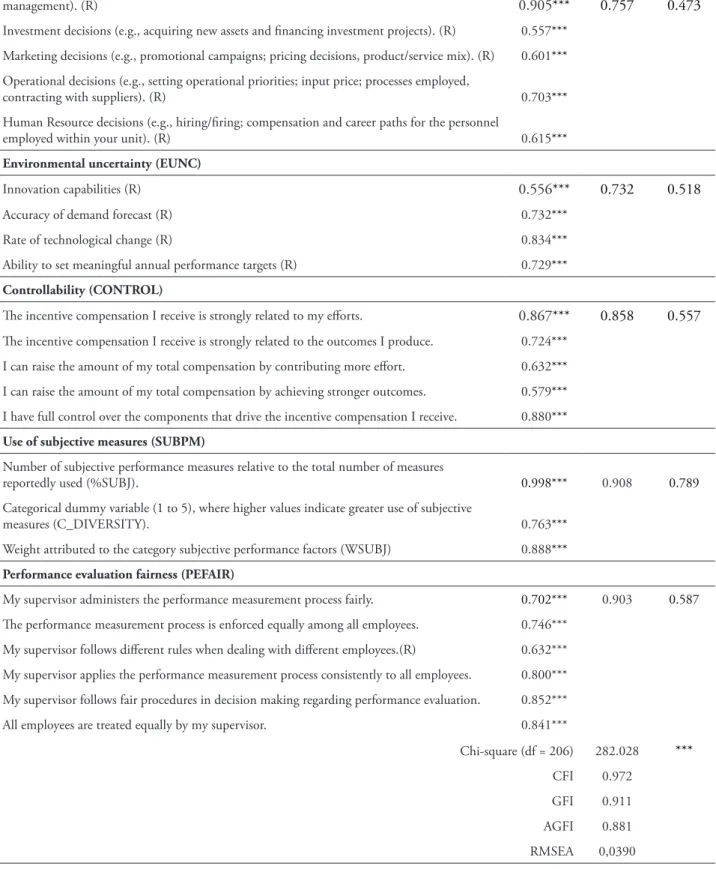
TABLE 4 – Estimation of the measurement model parameters (full sample, N = 339)
Items Loading Alpha AVE
Decentralization of decision rights (DECENTR)
Strategic decisions (e.g., development of new products and markets; business strategy; risk
management). (R) 0.905*** 0.757 0.473
Investment decisions (e.g., acquiring new assets and financing investment projects). (R) 0.557***
Marketing decisions (e.g., promotional campaigns; pricing decisions, product/service mix). (R) 0.601***
Operational decisions (e.g., setting operational priorities; input price; processes employed,
contracting with suppliers). (R) 0.703***
Human Resource decisions (e.g., hiring/firing; compensation and career paths for the personnel
employed within your unit). (R) 0.615***
Environmental uncertainty (EUNC)
Innovation capabilities (R) 0.556*** 0.732 0.518
Accuracy of demand forecast (R) 0.732***
Rate of technological change (R) 0.834***
Ability to set meaningful annual performance targets (R) 0.729***
Controllability (CONTROL)
The incentive compensation I receive is strongly related to my efforts. 0.867*** 0.858 0.557
The incentive compensation I receive is strongly related to the outcomes I produce. 0.724***
I can raise the amount of my total compensation by contributing more effort. 0.632***
I can raise the amount of my total compensation by achieving stronger outcomes. 0.579***
I have full control over the components that drive the incentive compensation I receive. 0.880***
Use of subjective measures (SUBPM)
Number of subjective performance measures relative to the total number of measures
reportedly used (%SUBJ). 0.998*** 0.908 0.789
Categorical dummy variable (1 to 5), where higher values indicate greater use of subjective
measures (C_DIVERSITY). 0.763***
Weight attributed to the category subjective performance factors (WSUBJ) 0.888***
Performance evaluation fairness (PEFAIR)
My supervisor administers the performance measurement process fairly. 0.702*** 0.903 0.587
The performance measurement process is enforced equally among all employees. 0.746***
My supervisor follows different rules when dealing with different employees.(R) 0.632***
My supervisor applies the performance measurement process consistently to all employees. 0.800***
My supervisor follows fair procedures in decision making regarding performance evaluation. 0.852***
All employees are treated equally by my supervisor. 0.841***
Chi-square (df = 206) 282.028 ***
CFI 0.972
GFI 0.911
AGFI 0.881
RMSEA 0,0390
Standardized loadings, significance levels are indicated as *** p<0.01, ** p<0.05, and * p<0.10 (two-tailed).
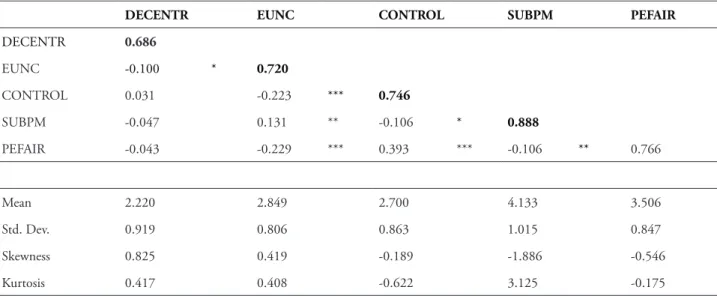
Criterion validity was assessed by correlation analysis (Table 5), demonstrating that all constructs behave plausibly. Internal consistency or construct reliability was assessed by Cronbach’s alphas and AVE for each construct. A series of model comparisons was conducted to assess the discriminant validity of the measures (BAGOZZI; YI, 1988; SHOOK et al., 2004). The results support discriminant validity among
our five constructs. In addition, as shown in Table 5, the square root of the shared variance between constructs and their items is greater than the correlation coefficient of any two constructs. And in Table 3, the lack of significant cross-loadings further supports discriminant validity among our constructs (BAGOZZI; YI, 1988; SHOOK et al., 2004).
TABLE 5 – descriptive and correlations between latent variables (full sample, N = 339)
DECENTR EUNC CONTROL SUBPM PEFAIR
DECENTR 0.686
EUNC -0.100 * 0.720
CONTROL 0.031 -0.223 *** 0.746
SUBPM -0.047 0.131 ** -0.106 * 0.888
PEFAIR -0.043 -0.229 *** 0.393 *** -0.106 ** 0.766
Mean 2.220 2.849 2.700 4.133 3.506
Std. Dev. 0.919 0.806 0.863 1.015 0.847
Skewness 0.825 0.419 -0.189 -1.886 -0.546
Kurtosis 0.417 0.408 -0.622 3.125 -0.175
Obs. DECENTR = decentralization of decision rights; EUNC = environmental uncertainty; CONTROL = perceived outcome controllability; SUBPM = use of subjective measures in performance evaluation; and PEFAIR = perceived performance evaluation fairness. Diagonal elements are square roots of average variance extracted (AVE) between constructs and their items. Off-diagonal elements are correlation coefficients among latent variables. T-values are in parenthesis (two-tailed). Significance levels: * <0.10; ** <0.05; *** < 0.01.
Source: The authors
4 RESULTS
4.1 Direct effect analysis
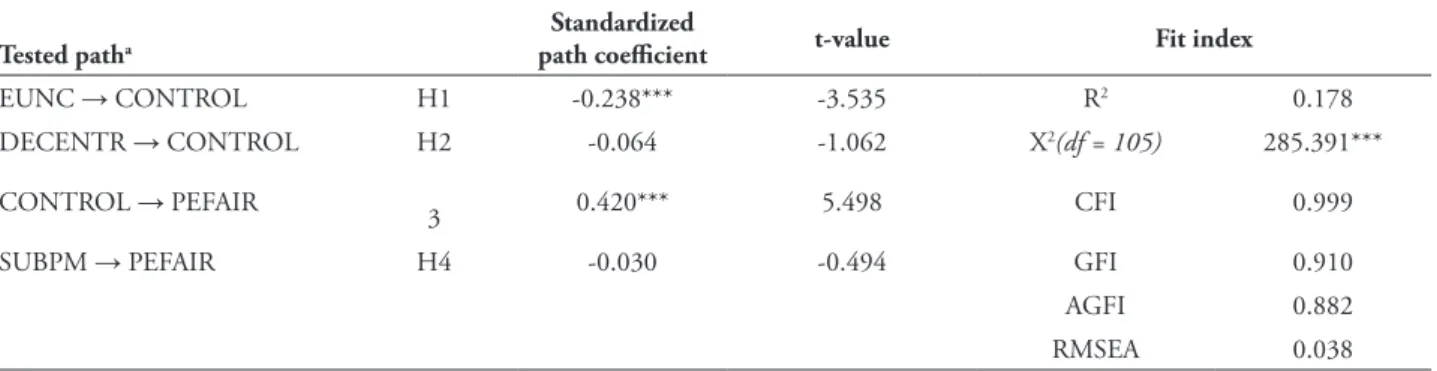
We used structural equation models, using EQS 6.1 to test for direct effects of environmental uncertainty (EUNC; H1) and decentralization of decision rights (DECENTR; H2a) on perceived outcome controllability (CONTROL), and
TABLE 6 – Structural equation model analysis results – main effects
Tested patha
Standardized
path coefficient t-value Fit index
EUNC → CONTROL H1 -0.238*** -3.535 R2 0.178
DECENTR → CONTROL H2 -0.064 -1.062 X2(df = 105) 285.391***
CONTROL → PEFAIR
3 0.420*** 5.498 CFI 0.999
SUBPM → PEFAIR H4 -0.030 -0.494 GFI 0.910
AGFI 0.882
RMSEA 0.038
* p<0.10; ** p<0.05; ***p<0.01 (one-sided)
a DECENTR = decentralization of decision rights; EUNC = environmental uncertainty; CONTROL = perceived outcome
controllability; SUBPM = use of subjective measures in performance evaluation; and PEFAIR = perceived performance evaluation fairness.
Source: The authors
Hypothesis 1 predicts that business environmental uncertainty (EUNC) increases managers’ exposure to uncontrollable factors, which in turn makes managerial performance difficult to predict and measure, leading to lower perceptions of outcome controllability (CONTROL). The results support this hypothesis: the estimated direct effect of EUNC→CONTROL is negative and significant (β = -0.238, p<0.001).
Hypothesis 2a predicts that greater decentralization of decision rights (DECENTR) increases managers’ ability to make decisions about tasks and resource allocations that affect performance outcomes. A positive association with perceived outcome controllability (CONTROL) is therefore expected. We found no support for this hypothesis, as the estimated coefficient of DECENTR→CONTROL is not significant (β = -0.064; t-value = -1.062).
Hypothesis 3 predicts that perceived outcome controllability (CONTROL) is positively associated with perceived performance evaluation fairness (PEFAIR). Our results support this hypothesis: the coefficient of CONTROL→PEFAIR is positive and significant (β = 0.420; p<0.001). This supports the argument that, when managers feel that they are held accountable for uncontrollable events, they perceive the performance evaluation process as unfair.
The use of subjective measures also grants superiors the flexibility to adjust for uncontrollable factors and consider all relevant information to evaluate managerial performance. Hypothesis 4a therefore predicts a positive effect of the use of subjective measures (SUBPM) on perceived performance evaluation fairness (PEFAIR). Our results do not support this hypothesis: the coefficient of SUBPM→PEFAIR is not significant (β = -0.030; t-value = -0.049).
4.2 Moderating effect analysis
DECENTR on EUNC→CONTROL (H2b). The second multigroup analysis (Table 7, Panel B) determined the moderating effects of SUBPM on CONTROL→PEFAIR (H4b). Multigroup analysis uses the Chi-square difference test to compare a model in which all hypothesized paths
are constrained to be equal across two subgroups with an unconstrained model in which the hypothesized path is allowed to vary freely across the two subgroups. Table 7, panels A and B, summarizes the results for both models, showing satisfactory goodness-of-fit indices.
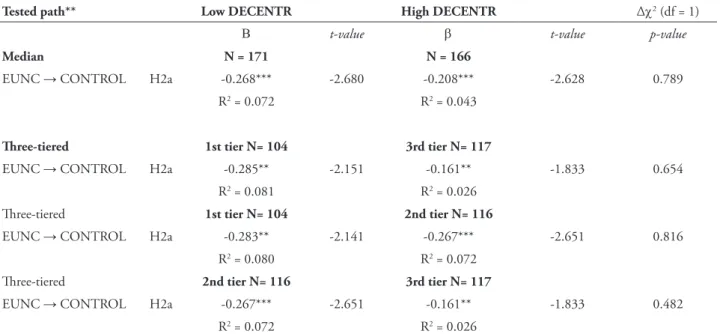
TABLE 7 – Structural equation model analysis results – moderation effects
Panel A: Moderating effect of decentralization of decisions rights (DECENTR)
Tested path** Low DECENTR High DECENTR Δχ2 (df = 1)
Β t-value β t-value p-value
Median N = 171 N = 166
EUNC → CONTROL H2a -0.268*** -2.680 -0.208*** -2.628 0.789
R2 = 0.072 R2 = 0.043
Three-tiered 1st tier N= 104 3rd tier N= 117
EUNC → CONTROL H2a -0.285** -2.151 -0.161** -1.833 0.654
R2 = 0.081 R2 = 0.026
Three-tiered 1st tier N= 104 2nd tier N= 116
EUNC → CONTROL H2a -0.283** -2.141 -0.267*** -2.651 0.816
R2 = 0.080 R2 = 0.072
Three-tiered 2nd tier N= 116 3rd tier N= 117
EUNC → CONTROL H2a -0.267*** -2.651 -0.161** -1.833 0.482
R2 = 0.072 R2 = 0.026
Panel B: Moderating effect of use of subjective measures (SUBPM)
Tested patha Low SUBPM High SUBPM Δχ2 (df = 1)
Β t-value β t-value p-value
Median N = 162 N = 162
CONTROL → PEFAIR H4a 0.439*** 4.365 0.333*** 3.042 0.970
R2 = 0.193 R2 = 0.111
Three-tiered 1st tier N= 108 3rd tier N= 108
CONTROL → PEFAIR H4a 0.378*** 3.332 0.202* 1.612 0.568
R2 = 0.143 R2 = 0.041
Three-tiered 1st tier N= 108 2nd tier N= 108
CONTROL → PEFAIR H4a 0.378*** 3.332 0.599*** 3.971 0.003
R2 = 0.143 R2 = 0.359
Three-tiered 2nd tier N= 108 3rd tier N= 108
CONTROL → PEFAIR H4a 0.599*** 3.970 0.201* 1.611 0.012
R2 = 0.359 R2 = 0.040
* p<0.10; ** p<0.05; ***p<0.01 (one-sided). a DECENTR = decentralization of decision rights; EUNC = environmental
uncertainty; CONTROL = perceived outcome controllability; SUBPM = use of subjective measures in performance evaluation; and PEFAIR = perceived performance evaluation fairness.
The estimated coefficients (Table 7, Panel A) indicate that decisional decentralization (DECENTR) does not moderate the effect of environmental uncertainty (EUNC) on perceptions of outcome controllability (CONTROL). More specifically, the EUNC→CONTROL coefficient is negative and significant for both the low and high DECENTR subgroups, and this result is consistent under the two criteria used to split the sample: median value (Median = 2.00) and the three subgroups (DECENTR1st-tier < 1.75; DECENTR3rd-tier > 2.50). Moreover, the Chi-square difference tests (last column) indicate no significant difference between the path coefficients of the low and high DECENTR subgroups. Our results therefore do not support Hypothesis 2b. Thus, the degree of decentralization of decision rights neither directly affects managerial perceptions of outcome controllability (H2a) nor moderates the effect of environmental uncertainty on perceptions of outcome controllability (H2b).
Table 7, Panel B presents the model coefficients and the Chi-square difference tests for the comparison between low and high use of subjective measures (SUBPM). Again, multigroup tests were first performed on the sample divided by the median value of SUBPM (Median = 4.357), and in the second set of Chi-square difference tests the subgroups were created based on the three-tier criteria: SUBPM1st-tier < 4.13; SUBPM3rd-tier > 4.55. The rationale for the three-tiered split is to differentiate between low, moderate, and high use of SUBPM. The results (Table 7, Panel B) indicate a consistently positive and significant CONTROL→PEFAIR coefficient for all subgroups, independently of the criteria used to create them. This provides additional support for the Hypothesis.
The multigroup analysis based on the median value shows no difference between the low and high SUBPM subgroups (βlow = 0.439; p<0.001/βhigh = 0.333; p<0.001). Similarly, no significant difference is found between the coefficients of CONTROL→PEFAIR when comparing the first- and third-tier SUBPM subgroups (β1st = 0.378; p<0.001/β3rd = 0.202; p<0.05). These results suggest that
SUBPM does not moderate the positive effect of CONTROL→PEFAIR (H4b), even when comparing extreme low and high use of SUBPM (first- and third-tier subgroups). However, differences in the CONTROL→PEFAIR coefficient are found when comparing the second-tier subgroup with the first- and third-tier subgroups. This suggests that the positive effect of CONTROLPEFAIR is stronger under greater use of SUBPM, as predicted by H4b. However, the comparison between the second- and third-tier SUBPM subgroups (β2nd = 0.599; p<0.001/ β3rd = 0.201; p<0.05) indicates the opposite effect. Although not significantly different when compared to the first-tier subgroup, the CONTROL→PEFAIR coefficient for the third-tier subgroup is significantly lower than for the second-tier subgroup. This suggests that, relative to moderate use of SUBPM (second-tier), higher use of SUBPM (third-tier) may adversely affect the path CONTROL→PEFAIR. This contrasts with the effect predicted in H4b.
4.3 Discussion
effect of environmental uncertainty on perceived outcome controllability (AGBEJULE, 2005).
Our results also support the hypothesized positive association between perceived outcome controllability and performance evaluation fairness (H3). That is, when managers are held accountable for factors outside their control, they tend to perceive performance evaluation systems as unfair. However, our findings do not support the expected direct effect of the use of subjective performance measures on performance evaluation fairness (H4a): the perceptions of outcome controllability by the middle- and upper-level managers in our sample show a stronger direct effect on perceived fairness than simply the use of subjective performance measures. This result might be driven by the higher responsibility of our respondents (MOUNT 1983), for whom the impact of subjective measures on perceived fairness might depend on the degree of negative externalities and perceptions of controllability these measures promote (GIRAUD; LANGEVIN; MENDOZA, 2008; KELLY; VANCE; WEBB, 2010). This view is corroborated to some extent by our findings on the moderating effect of the use of subjective measures (H4b). The multigroup analysis suggests that the positive effect reflects an optimal use of subjective measures as well as job-related issues.
5 CONCLUSION
T h i s s t u d y i n v e s t i g a t e d w h e t h e r environmental uncertainty and decentralization of decisions rights are associated with perceived outcome controllability, which in turn affects perceptions of performance evaluation fairness. We argue that uncontrollable events that affect managerial performance can be driven by either external organizational factors (e.g., environmental uncertainty) or internal organizational factors (e.g., degree of decentralization), which adversely affect the measurability of managerial performance and perceptions of outcome controllability. Because greater decentralization of decision rights increases individual ability to make decisions
about tasks and resource allocation, we also examined whether it moderates the effect of environmental uncertainty on perceived outcome controllability. Furthermore, because the use of subjective performance measures allow superiors to filter out uncontrollable events, we also examined whether these measures are associated with perceived performance evaluation fairness and whether they moderate the effect of perceived controllability on performance evaluation fairness.
Our findings are particularly relevant to the literature (GIBBS et al., 2004; GIRAUD; L A N G EV I N ; M E N D O Z A, 2 0 0 8 ; L AU et al., 2008) on optimal contracting within a traditional agency framework. Insofar as subjective performance measures compensate for the incompleteness of traditional financial measures (BOL, 2008; GIBBS et al., 2004), we show in a sample of middle- and upper-level managers that these benefits may depend on organizational factors, and may be perceived differently in light of perceptions of fairness of the performance evaluation process. This has important implications for management accountants, who usually participate actively in the design and implementation of performance evaluation systems.
uncertainty and decentralization–to investigate how perceived controllability and fairness are affected by the incompleteness of traditional financial outcome measures. Finally, given that perceived controllability and fairness can affect individual attitudes and behaviors within an organization, our results have important implications for the design of performance evaluation systems.
REFERENCES
ABERNETHY, M. A; BOUWENS, J; LENT, L. V. Determinants of control system design in divisionalized firms. The Accounting Review, Sarasota, v. 79, n. 3, p. 545-570, July 2004.
AGBEJULE, A. The relationship between management accounting systems and perceived environmental uncertainty on managerial performance: a research note. Accounting and Business Research, [S. l.], v. 35, n. 4, p. 295-305, 2005.
BAGOZZI, R. P; YI, Y. On the evaluation of structural equation models. Journal of the Academy of Marketing Science, Thousand Oaks, v. 16, n. 1, p. 74-94, Spring 1988.
BAKER, G; GIBBONS, R; MURPHY, K. J. Subjective performance measures in optimal incentive contracts. The Quarterly Journal of Economics, [S. l.], v. 109, n. 4, p. 1125-1156, Nov. 1994.
BARON, R. M; KENNY, D. A. The moderator-m e d i a t o r va r i a b l e d i s t i n c t i o n i n s o c i a l psychological research: conceptual, strategic, and statistical considerations. Journal of Personality and Social Psychology, Washington, D. C., v. 51, n. 6, p. 1173-1182, Dec. 1986.
BERGER, L; LIBBY, T; WEBB, A. Tournament i n c e n t i ve s , f a i r n e s s a n d s u b s e q u e n t performance: what happens to the losers? 2009. Working Paper,University of Waterloo.
BOL, J. C. Subjectivity in compensation contracting. Journal of Accounting Literature, Gainesville, v. 27, p. 1-24, Dec. 2008.
CHENHALL, R. H. Management control systems design within its organizational context: findings from contingency-based research and firections for the future. Accounting, Organizations and Society, [S. l.], v. 28, n. 2/3, p. 127-168, Feb./ Apr. 2003.
DILLMAN, D. A; SMYTH, J. D; CHRISTIAN, L. M. Internet, mail, and mixed-mode surveys: the tailored design method. New Jersey: John Wiley & Son, Inc., 2009.
FOLGER, R; LEWIS, D. M. Self-appraisal and fairness in evaluations. In: CROPANZANO, L. Justice in the workplace: approaching justice in human resource management. Hillsdale, NJ: Erlbaum, 1995. p. 107-131.
G A L B R A I T H , J . D e s i g n i n g c o m p l e x organisations. USA: Addison Wesley Publishing Company, 1973.
GERDIN, J. The Impact of departmental interdependencies and management accounting systems use on subunit performance. European Accounting Review, London, v. 14, n. 2, p. 297-327, 2005.
GHOSH, D; LUSCH, R. F. Outcome effect, controllability and performance evaluation of managers: some field evidence from multi-outlet businesses. Accounting, Organizations and Society, [S. l.], v. 25, n. 4, p. 411-425, 2000.
GIBBS, M. et al. Determinants and effects of subjectivity in incentives. The Accounting Review, Sarasota, v. 79, n. 2, p. 409-436, Apr. 2004.
GORDON, L.A; NARAYANAN, V. K. Management Accounting Systems : An Empirical Evaluation. Accounting, Organizations and Society, [S.l.], v. 9, p. 33-47, 1984.
GOVINDARAJAN, V. Appropriateness of accounting data in performance evaluation: an empirical examination of environmental uncertainty as and inter vening variable. Accounting, Organizations and Society, [S. l.], v. 9, n. 2, pp. 125-135, 1984.
GREENBERG, J. Determinants of perceived fairness of performance evaluations. Journal of Applied Psychology, Washington, v. 71, n. 2, p. 340-342, 1986.
GUL, F. A. et al. Decentralisation as a moderating factor in the budgetary participation-performance relationship: some Hong Kong evidence. Accounting and Business Research, [S. l.], v. 25, n. 98, p. 107-113, 1995.
HAIR, J. F. et al. Mutivariate data analysis. 6th ed. New Jersey: Prentice Hall, 2006.
HARTMANN, F; SLAPNICAR, S. How formal performance evaluation affects trust between superior and subordinate managers. Accounting, Organizations and Society, [S. l.], v. 34, n. 6-7, p. 722-737, Aug./Oct. 2009.
HUFFMAN, C; CAIN, L. B. Effects of considering uncontrollable factors in sales force performance evaluation. Psychology & Marketing, [S. l.], v. 17, n. 9, p. 799-833, 2000.
ITTNER, C. D.; LARCKER, D. F.; MEYER, M. W. Subjectivity and the weighting of performance measures: evidence from a balanced scorecard. The Accounting Review, Sarasota, v. 78, n. 3, p. 725-758, July 2003.
KELLY, K.; VANCE, T; WEBB, A. The interactive effects of subjectivity and goal difficulty on performance: an experimental study. 2010. Working Paper, University of Waterloo.
LAMBERT, R. A. Contracting theory and accounting. Journal of Accounting and
Economics, Amsterdam, v. 32, n. 1/3, p. 3-87, Dec. 2001.
LAU, C. M; LIM, E. W. The intervening effects of participation on the relationship between procedural justice and managerial performance. British Accounting Review, London, v. 34, n. 1, p. 55-78, Mar. 2002.
______; MOSER, A. S. Behavioral effects of nonfinancial performance measures: the role of procedural justice. Behavioral Research in Accounting, Sarasota, v. 20, n. 2, p. 55-71, 2008.
______; WONG, K. M; EGGLETON, R. C. Fairness of performance evaluation procedures and job satisfaction: the role of outcome-based and non-outcome-based effects. Accounting and Business Research, [S. l.], v. 38, n. 2, p. 121-135, 2008.
LATHAM, G. P. et al. New developments in performance management. Organizational Dynamics, New York, v. 34, n. 1, p. 77/87, Feb. 2005.
LEVENTHAL, G. S. What should be done with equity theory? New approaches to the study of fairness in social relationships. In: GRERGEN, K. J. et al. (Eds.). Social exchanges: advances in theory and research. New York: Plenun Press, 1980. p. 257-255.
LIBBY, T. The Influence of voice and explanation on performance in a participative budgeting setting. Accounting, Organizations and Society, [S. l.], v. 24, n. 2, p. 125-137, Feb. 1999.
MARTOCCHIO, J. J; DULEBOHN, J. Performance feedback effects in training: the role of perceived controllability. Personnel Psychology, Bowling Green, v. 47, n. 2, p. 357-373, 1994.
entities. Management Science, Linthicum, v. 55, n. 6, p. 890-905, 2009.
MERCHANT, K. A; VAN DER STEDE, W. A. Management control systems: performance measurement, evaluation and incentives. 2nd ed. England: Prentice Hall, 2007.
MOERS, F. Discretion and bias in performance evaluation: the impact of diversity and subjectivity. Accounting, Organizations and Society, [S. l.], v. 30, n. 1, p. 67-80, Jan. 2005.
MOUNT, M. K. Comparisons of managerial and employee satisfaction with a performance appraisal system. Personnel Psychology, Bowling Green, v. 36, n. 1, p. 99-110, Mar. 1983.
MURPHY, K. R; OYER, P. Discretion in executive incentive contracts: theory and evidence. 2003. Working Paper, University of Southern California and Stanford University.
NISAR, T. M. Evaluation of subjectivity in incentive pay. Journal of Financial Services Research, [S. l.], v. 31, n 1, p. 53-73. Feb. 2007.
SHARMA, S; DURAND, R. M; GUR-ARIE, O. Identification and analysis of moderator variables. Journal of Marketing Research, [S. l.], v. 18, n. 3, p. 291-300, Aug. 1981.
SHOLIHIN, M; PIKE, R. Fairness in performance evaluation and its behavioural consequences. Accounting and Business Research, [S. l.], v. 39, n. 4, p. 397-413, 2009.
SHOOK, C. L. et al. Research notes and commentaries: an assessment of the use of structural equation modelling in strategic management research. Strategic Management Research, [S. l.], v. 25, n. 4, p. 397-404, Feb. 2004.
THIBAUT, J; WALKER, L. Procedural justice. Hillsdale, NJ: Lawrence Erlbaum, 1975.
THOMPSON, J. D. Organizations in action. New York, NY: McGraw-Hill, 1967.
VAN DER STEDE, W. A; CHOW, C. W; LIN, T. W. Strategy, choice of performance measures, and performance. Behavioral Research in Accounting, Sarasota, v. 18, p. 185-205, 2006.
______; YOUNG, S. M; CHEN, C. X. Assessing the quality of evidence in empirical management accounting research: the case of survey studies. Accounting, Organization and Society, [S. l.], v. 30, n. 7/8, p. 655-684, Oct./Nov. 2005.
NOTAS
1. We validated the survey instrument with several steps. First we conducted in-depth interviews with two human resource consultants to validate the measurement scales. We then asked four management accounting faculty and four practitioners to pre-test the survey and confirm their understanding of all measurement instruments. 2. Professional experience combined with the required
two-year internship for CMA certification ensured a sample of managers who held decision-making positions. The autonomous mail survey enabled us to gather confidential information. Support by the Quebec CMA Order’s CEO greatly helped draw attention to the study, and we believe it also contributed to the quality and rate of responses.
3. Overall, late responders had about six years of experience in their current position. More than 31% (42) were from 40 to 49 (30–39) years old and 75% worked for a firm that had more than 500 employees.
4. Thirty-six respondents wrote in 14 new performance measures within the five categories. We take this as evidence that respondents made an effort to correctly report on the diversity of measures used to evaluate their performance. They were classified as follows: financial (cash flow, tax savings, EVA), nonfinancial customer-oriented (new product development, new market development, risk management), nonfinancial employee-oriented (outreach, fostering workgroups, career development), and nonfinancial internal operating (sustainability, new alliance/partnership). 5. This five-category approach has two main purposes.
First, it allows taking into account other dimensions of performance measurement diversity. Second, as some of the objective nonfinancial measures (customer-oriented, employee-oriented, and internal operating) are leading indicators of some financial outcomes (e.g., productivity versus return on assets), the categorical approach better reflects the use of subjective criteria combined with objective measures (financial and nonfinancial). 6. This measure is our own, and to our knowledge, no
to subjective performance measures in a large cross-sectional sample.
7. Lau and Lim (2002) and Berger et al. (2009) used similar scales to assess performance evaluation, allowing comparability of construct reliability. However, they report lower sample average scores. This could be explained by their sample size and its industry-specific nature. It is important to note that Hartmann and Slapnicar (2009) used a different scale to measure performance evaluation justice.