Pedro Antunes da Cunha
Response to currency depreciation episodes
by multinational subsidiaries and local firms
P
edr
o Antunes da Cunha
R
esponse to currency depreciation episodes b
y multinational
subsidiaries and local firms
1
Pedro Antunes da Cunha
Response to currency depreciation episodes
by multinational subsidiaries and local firms
Master thesis in Economics and Management
Master in Finance
This work was realized under the supervision of:
Professor Doctor Artur Rodrigues
Este é um trabalho académico que pode ser utilizado por terceiros desde que respeitadas as regras e boas práticas internacionalmente aceites, no que concerne aos direitos de autor e direitos conexos. Assim, o presente trabalho pode ser utilizado nos termos previstos na licença abaixo indicada.
Caso o utilizador necessite de permissão para poder fazer um uso do trabalho em condições não previstas no licenciamento indicado, deverá contactar o autor, através do RepositóriUM da Universidade do Minho.
Atribuição-NãoComercial-CompartilhaIgual CC BY-NC-SA
I would like to express my deep gratitude to my supervisor, Professor Artur Rodrigues, for accepting to be my supervisor and for the constructive comments that improved my dissertation. I also want to thank Professor Gilberto Loureiro for share his knowledge about Stata programming.
E-mail: pedroc1196@gmail.com
Title: Response to currency depreciation episodes by multinational subsidiaries and local firms Master’s Advisor: Professor Doutor Artur Rodrigues
Year: 2019
Master’s designation: Master in Finance
STATEMENT OF INTEGRITY
I hereby declare having conducted this academic work with integrity. I confirm that I have not used plagiarism or any form of undue use of information or falsification of results along the process leading to its elaboration.
I further declare that I have fully acknowledged the Code of Ethical Conduct of the University of Minho.
Universidade do Minho, ___ de _______________ de ________ Nome completo: ________________________________________ Assinatura: _____________________________________
Abstract
The purpose of this work is to study the performance, measured through net income, levels of sales, assets and capital expenditures, of Chinese, Japanese, American and UK multinational
subsidiaries in Euro Area and compare it with local firms’ performance during Euro depreciation episodes. It assesses performance with the full sample, and a sample of multinational subsidiaries by ultimate owner country for the period before the depreciation episode, the year of, the two following years and the post crisis period.
Multinational subsidiaries overperform local firms in terms of net income, sales and assets and underperform in terms of investment in the post crisis period. However, they reduce net income, assets and investment in the same period. Japanese multinational subsidiaries perform worse than others multinational subsidiaries.
When Pound devaluates face to Euro, UK multinational subsidiaries overperform multinational subsidiaries from other countries.
Keywords: currency crisis; developed economies; firm performance; investment; multinationals subsidiaries versus local firms
Resumo
O objetivo deste trabalho é estudar a performance, medida através dos resultados líquidos, dos níveis de vendas, ativos e de investimento, das subsidiárias das multinacionais Chinesas, Japonesas, Americanas e do Reino Unido na Área Euro e compará- las com a performance das empresas locais durante períodos de depreciação do valor do Euro. A performance das empresas é avaliada através de uma amostra com todas as empresas e em subamostras divididas com base na localização do proprietário maioritário das filiais. Estas duas amostras são estudadas para os anos antes dos episódios de depreciação, os anos do episódio, os dois anos seguintes e o período após o episódio de depreciação.
As filiais das multinacionais têm uma melhor performance, em comparação com as empresas locais, em termos de resultados líquidos vendas e ativos e uma pior performance em termos de investimento no período após crise. No entanto, apresentam uma redução do resultado líquido, nível de ativos e investimento para o mesmo período. As filiais japonesas têm pior
performance do que filiais de outros países.
As filiais do Reino Unido têm melhor performance do que as subsidiárias de outros países mesmo quando a Libra Esterlina desvaloriza em relação ao Euro.
Palavras-chave: crise monetária; economias desenvolvidas; investimento; performance das empresas; subsidiárias das multinacionais versus empresas locais.
Table of Contents
Acknowledgments ... iii
Abstract ... v
Resumo ... vi
Table of Contents ... vii
List of Tables ... viii
1. Introduction ... 1
2. Literature Review and Methodology ... 3
2.1 Literature review... 3 2.2 Research Hypotheses ... 6 2.3 Methodology ... 7 3. Data ... 8 3.1 Data description ... 8 3.2 Depreciation Episodes ... 9 3.3 Descriptive Statistics ... 10 4. Results ... 15
4.1 Firms Performance during Depreciation Episodes ... 15
4.2 Firms Performance during Depreciation Episodes by Ultimate Owner Country ... 20
4.2.1 American multinational subsidiaries performance ... 20
4.2.2 Japanese multinational subsidiaries performance ... 22
4.3 Firms performance during Euro depreciation episodes higher than 8% ... 25
4.4 Comparison between tradable and non-tradable sectors ... 30
4.5 The impact of multinationals country currency devaluations on subsidiaries investment .. 32
5. Conclusion ... 34
List of Tables
Table 1 Summary Statistics: Multinational subsidiaries versus local firms ... 12
Table 2 Summary statistics by Ultimate Owner country ... 13
Table 3 Summary of difference in means between subsidiaries by ultimate owner country and local firms ... 14
Table 4 Response of multinational subsidiaries and local firms to currency crisis ... 18
Table 5 Response of American multinational subsidiaries and local firms to currency crisis ... 21
Table 6: Response of Japanese multinational subsidiaries and local firms to currency crisis ... 23
Table 7 Response of multinational subsidiaries and local firms to 8% currency crisis ... 26
Table 8: Response of multinational subsidiaries and local firms to 8% currency crisis (Japanese firms excluded) ... 29
Table 9 Comparison between multinational subsidiaries from tradable and non-tradable sector .. 31
Table 10 UK and Japanese subsidiaries performance during multinationals country currency devaluation ... 33
1. Introduction
This study analyzes the performance, measured by net income, sales, assets and capex, of multinational subsidiaries with an ultimate owner from UK, USA, Japan and China and local firms, based on Euro Area, during currency depreciation episodes.
Previous studies address the impact of currency devaluation in firm’s performance and highlight key factors to distinct multinational subsidiaries performance from local firms’ performance: the internal capital market, the sector and type of economy where they operate, the exposure to foreign sales, and the multinational network.
I show that subsidiaries overperform local firms in terms of net income by 16.1%, sales by 18.3% and assets by 20.7% in the period post crisis, however, they still reduce net income during post depreciations episodes by 19.6% and the level of assets by 7.9% and increase sales by 2.7%. These findings are similar for previous studies in emerging markets. Forbes (2002) shows that sales and net income decrease in the year of depreciation episodes and sales increase in the year after depreciation episodes while net income still reduce. However, the level of assets and investment findings are different from Desai, Foley & Forbes (2007) results. They find that multinational subsidiaries increase assets by 5.4% in the period post depreciation episode and capital expenditures overperform local firms by 34.5%. For developed economies, the reality is different and multinational subsidiaries reduce assets and underperform local firms in terms of investment by 18.6% (for crisis above 8% currency
devaluation).
This study provides information about multinational subsidiaries performance during depreciation episodes by sector: tradable and non-tradable. It was expected that, multinational subsidiaries from tradable sector benefit from the currency devaluation competitiveness effect and increase their sales and net income. The analysis show that the competitiveness effects don’t extend to multinational subsidiaries. Indeed, multinational subsidiaries from tradable sectors underperform multinational subsidiaries from non-tradable sectors, which is different than Schneider & Tornell (2004) findings, once they find that firms in the tradable sectors show lower profitability preceding a crisis compared to non-tradable firms and a reversal of roles after a currency depreciation.
The effect on investment is the most divergent from previous studies. The availability of internal capital markets, the possibility of multinationals provide additional financing aren’t a key factor, in this study, for a superior performance from multinational subsidiaries in terms of investment in developed markets.
This work is divided in 5 sections. Section 1 introduces the theme, Section 2 reviews the literature, introduce the research hypotheses and explain the methodology. Section 3 is a description of data and identification of currency depreciation episodes. Section 4 presents the results and Section 5 concludes this work.
2. Literature Review and Methodology
2.1 Literature review
A currency crisis is defined as a speculative attack on the foreign exchange value of a currency, resulting in a sharp depreciation of currency value (Glick & Hutchison, 2011).
In order to identify currency crisis, previous studies use different definitions. Frankel & Rose (1996) studied developing markets, between 1971 and 1992, and define a currency crisis as a nominal depreciation of at least 25%, which is at least 10% greater than the depreciation in the year before. Milesi-Ferretti & Razin (1998) studied developing countries, over the period of 1970 and 1996, and use a definition of at least 25% depreciation and in addition a doubling in the rate of depreciation with respect to the previous year and a rate of depreciation the previous year below 40%, to avoid capturing fluctuations related with high inflation periods. Desai, Foley & Forbes (2007) studied depreciation episodes in emerging markets and use a definition of an increase by over 25% in real exchange rate compared to the value of the exchange rate one year earlier.
Laeven & Valencia (2013) studied the timing of banking crises (defined as a situation when a country’s corporate and financial sectors experience a large number of defaults and financial
institutions and corporations face great difficulties repaying contracts on time), currency crises (based on Frankel & Rose (1996) definition but with an increase by 5% in the nominal depreciation value) and sovereign debt crises (identified through situations of default or restructuration). During the period of 1970 and 2007 they identified 208 currency crises as independent events, 26 twin crises (defined as a simultaneously banking crisis and a currency crisis) and 8 triple crises (defined as a simultaneously twin crisis and a sovereign debt crisis).
Being a common phenomenon, it is important to understand why is so difficult to avoid or prevent a currency crisis at macroeconomics level. Glick & Hutchison (2011) explains why is difficult for countries to maintain commitments to exchange rate targets with increasing global financial integration and capital mobility over time based on the principle of impossible trinity- referring to the impossibility of having a fixed foreign exchange rate, free capital movement and an independent
monetary policy at the same time. According to this principle it is possible that countries control two of the three policies but not all of them at the same time. For example, when capital mobility is high and a country pegs its exchange rate to another country’s currency, its domestic interest rates will be linked to foreign interest rates, which limits its ability to pursue an independent domestic monetary policy. The combination of the three policies led to the Mexican peso crisis of 1994-95, the Asian financial crisis of 1997-98 and the Argentinean financial collapse of 2001-02.
At microeconomics level, all the companies that have operations in other currencies are
exposed to exchange rate risk. According to Adler & Dumas (1984) the exchange rate risk refers to the probability that the actual domestic purchasing power of home or foreign currency on a given future date will differ from its originally anticipated value. Exchange rate volatility has consequences for firms and may lead to many reactions. Héricourt & Nedoncelle (2018) show that exporters with multi destination tend to reduce significantly more their exports to a destination that faces higher exchange rate volatility and, after an exchange rate volatility shock in a given country, multi destination firms increase exports to all other destinations served. However, Tunc & Solakoglu (2017) show that the effect of currency exchange volatility is less negative for firms that have over 50% of their total sales in foreign markets, once they have incentives and means to reduce the possible negative effects of currency movements via hedging or redirecting their foreign sales to other countries and regions. This study show that a 1% appreciation of the domestic currency reduces foreign sale share of an average firm by 5.9%.
For firms, the effect of exchange rate volatility depends on the sector in which the firm operate, the firm size, the foreign market dependence and the market where they are inserted (Tunc &
Solakoglu (2017) and Reinhart & Calvo (2000)). Exchange rate volatility is more damaging to trade in emerging markets and the passthrough from exchange rate swings to inflation is higher comparing to developed economies. Babecký, Havránek, Mateju, Rusnák, Smídková & Vasícek (2014) show that, in developed economies, currency crisis is typically preceded by banking crisis and not vice versa, which may have implications in firms financing policies.
Existent literature approaches the impact of currency crisis on firm’s performance, measured through different variables such as assets, sales, investment, net income, foreign direct investment, leverage, cash holding and cash flow (Forbes (2002), Lamont (1997), Aguiar (2005), Bris, Koskinen & Pons (2004), Desai, Foley & Forbes (2007), Beuselinck, Deloof & Vanstraelen (2011), Alfaro & Chen (2010) and Bates, Kahle & Stulz (2009)).
Sharp depreciations are believed to increase competitiveness once the products made inside borders become cheaper in relation to foreign competitors and the price of imports increase, creating different incentives for local firms and multinational subsidiaries. Schneider & Tornell (2004) find differences among firms from the tradable sector and from the nontradable sector. Before a currency depreciation episode, firms in the tradable sector show higher leverage, lower profitability and growth compared to firms in the non-tradable sector, but after the currency depreciation it happens a reversal of roles. Aguiar (2005) shows that the investment of firms facing a currency devaluation decreases in the year after the depreciation. When firms are separated between exporting and nonexporting firms, exporting firms outperform nonexporting in sales and profits in the year following the depreciation. Desai, Foley & Forbes (2007) find differences in assets, sales and investment performance between U.S. multinational subsidiaries and local firms from emerging markets. During and subsequent to currency depreciations, multinationals subsidiaries increase sales by 5.4%, assets by 7.5% and investment by 34.5% more than local firms. None of these previous studies are about currency crisis in developed countries. It is my intention study the performance in terms of net income, levels of sales, levels of assets, and investment of multinational subsidiaries and local firms and assess if previous findings remain when the currency depreciation episode occurs in a developed area.
Several previous studies highlight the internal capital market as one of the major advantages for multinational subsidiaries. Local firms facing a currency crisis depends on aggravated credit
conditions in order to financing new or already existing projects. On the other hand, multinational subsidiaries can be less dependent on host-country credit conditions because of the supply of capital from headquarters (Alfaro & Chen (2010)).
Forbes (2002) highlight the power of internal capital market as an advantage for multinational subsidiaries but, states that it also could have counteracting effects such as the possibility of fiscal pressure that may become more difficult to benefit from internal capital market, the experience of negative balance-sheet effects from currency depreciation, once multinationals are more likely to have borrowed in foreign currency, and the possibility of firms already had hedged against currency risks. These variables can lead to a mixed outcome for multinationals and their subsidiaries.
Internal factors can also devalue the power of internal capital market. Gertner, Scharfstein & Stein (1994) show that internal capital market might not be available for all subsidiaries because of corporate governance policies. Subsidiaries operating more independently from headquarters are unlikely to be involved in an internal capital market, once headquarters can’t monitor and control
affiliates. Beuselinck, Deloof & Vanstraelen (2011) findings support Gertner, Scharfstein & Stein (1994) findings and states that multinational subsidiaries have a superior knowledge about local markets over headquarters, being this informational advantage one of the reasons why foreign multinational subsidiaries hold more cash than home country-based subsidiaries.
Forbes (2002) study the performance of firms from countries facing a currency devaluation and compares with firms from countries without currency depreciations. Firms in depreciating countries have lower net income growth and asset growth (although the results for asset growth is only robust for 2/3 of the regressions implemented) in the year after depreciation. This type of tests allows to understand the impact of a currency depreciation in comparison with firms with normal currency fluctuations. In this study, I collected data for multinational subsidiaries from different countries having activities in the same economic area during the same period. The devaluation of multinationals country currency against Euro might have implications for multinational subsidiaries, once, internal capital markets can be limited by the depreciation episode, making it difficult for the subsidiaries to finance. Based on this, will be created regressions to assess if there is different investment performance between multinational subsidiaries, whose multinational country currency is facing a depreciation and the others multinational subsidiaries.
2.2 Research Hypotheses
• Multinational subsidiaries have a better performance in terms of net income, the level of sales and the level of assets than local firms, when facing a currency depreciation episode.
• Multinational subsidiaries invest more than local firms, when facing a currency depreciation episode.
• Multinational subsidiaries, whose multinational country currency is facing a depreciation, invest less than other countries subsidiaries in that period.
The results for this research hypothesis will allow me to understand at what level the previous results found in literature remain for different economies.
2.3 Methodology
In order to identify if multinational subsidiaries and local firms perform distinctively in relation to net income, sales levels, assets levels and capex I use the model described in Desai, Foley & Forbes (2007): 𝐼𝑛𝑑𝑒𝑝𝑒𝑛𝑑 𝑉𝑎𝑟𝑖𝑎𝑏𝑙𝑒𝑖,𝑡 = 𝛼 + 𝛽1 𝐶𝑟𝑖𝑠𝑖𝑠(𝑡−1) + 𝛽2 𝐶𝑟𝑖𝑠𝑖𝑠(𝑡) + 𝛽3 𝐶𝑟𝑖𝑠𝑖𝑠(𝑡+1) + 𝛽4 𝐶𝑟𝑖𝑠𝑖𝑠(𝑡+2) + 𝛽5 𝑀𝑢𝑙𝑡𝑖𝑛𝑎𝑡𝑖𝑜𝑛𝑎𝑙𝑖 ∗ 𝐶𝑟𝑖𝑠𝑖𝑠(𝑡−1) + 𝛽6 𝑀𝑢𝑙𝑡𝑖𝑛𝑎𝑡𝑖𝑜𝑛𝑎𝑙𝑖 ∗ 𝐶𝑟𝑖𝑠𝑖𝑠(𝑡) + 𝛽7 𝑀𝑢𝑙𝑡𝑖𝑛𝑎𝑡𝑖𝑜𝑛𝑎𝑙𝑖 ∗ 𝐶𝑟𝑖𝑠𝑖𝑠(𝑡+1) + 𝛽8 𝑀𝑢𝑙𝑡𝑖𝑛𝑎𝑡𝑖𝑜𝑛𝑎𝑙𝑖 ∗ 𝐶𝑟𝑖𝑠𝑖𝑠(𝑡+2) + 𝛽9𝑋𝑖, + 𝜔𝑖 + 𝜀𝑖,𝑡
Where, i is a subscript for each firm, t is a subscript for each year, Independent Variablei,t is a measure of firm performance; the Crisis dummy variables are respectively set equal to 1 for observations from one year before (t-1), the year of (t), one year after (t+1) and two years after (t+2) a depreciation episode; Multinational is a dummy variable equal to 1 if firm i is a multinational subsidiary; Xi,t is the control variable consumer price index and multinational, 𝜔𝑖 is a year/industry fixed effects dummy; and 𝜀𝑖,𝑡 is the error term.
The key variables of interest are the coefficients on the crisis dummy variables and on the interaction variables. The crisis variable measures de response of firms to depreciation episodes, and the interaction term the incremental performance of multinational subsidiaries. In order to obtain more results, it was also estimated regressions with only two crisis dummies. The first is equal to one for observations in the year before depreciation episodes, and the second is equal to one for observations in the year of and each of the two years following a depreciation episode.
3. Data
3.1 Data description
The data used in this master thesis is compiled from two data sources: (i) Amadeus, provided by Bureau Van Dijk, is a database of comparable financial information for public and private
companies across Europe and was used to obtain financial and accounting information for
multinational subsidiaries and for local companies; (ii) Datastream, provided by Thomson Reuters, is a historical financial database with over 35 million individual instruments or indicators across all major asset classes and with 65 years of data across 175 countries.
The dataset used to develop this work is based on 2 different groups of firms. It was collected data for multinational subsidiaries, registered in Euro Area countries and with an ultimate owner, defined by a minimum of 50.01% ownership, from United Kingdom, United States of America, People’s Republic of China and Japan. The local firms belong to Euro Area. It was used an operating revenue restriction of at least 100000€ in the last 4 years available and a minimum of 5 employees in order to avoid companies registered in euro area but with no activities in recent years and with high volume of transactions but only with a few employees. The frequency of the data is yearly, and all the variables measured in prices (Euro) are adjusted for inflation, using the consumer price index
(Base=2015) obtained from Datastream. To avoid outliers’ effect, all the variables were winsorized at the one percent levels.
After the data clean process there was more than 15000 companies. Some firms may not have values for all the variables and are excluded in some regressions.
The sample is limited to data from 2008 through 2017, which is the time period for which Amadeus have coverage for financial and accounting data.
3.2 Depreciation Episodes
I used Datastream to collect nominal exchange rates (British Pound to Euro, American Dollar to Euro, Chinese Yuan to Euro and Japanese Yen to Euro) and then used consumer price index (CPI) to compute real exchange rate (RER).
𝑅𝐸𝑅 𝑓𝑜𝑟 𝑐𝑢𝑟𝑟𝑒𝑛𝑐𝑦 𝑋 𝑡𝑜 𝐸𝑢𝑟𝑜
𝑛𝑜𝑚𝑖𝑛𝑎𝑙 𝑒𝑥𝑐ℎ𝑎𝑛𝑔𝑒 𝑟𝑎𝑡𝑒 𝑋 𝑡𝑜 𝐸𝑢𝑟𝑜 × 𝐶𝑃𝐼 𝐸𝑢𝑟𝑜 𝐴𝑟𝑒𝑎 =
𝐶𝑃𝐼 𝑋
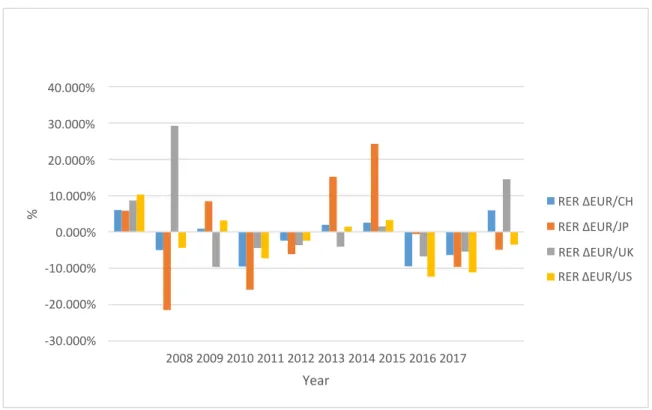
For the period in analysis, the Euro value did not oscillate too much. Most RER Euro
devaluations are lower than 10% per year. In fact, the higher devaluation for Euro refers to the year of 2009, when the Euro depreciates 21.51% face to Yen.
Figure 1 Euro value annual variation in relation to other currency pairs
An International Monetary Fund (IMF) report states that the historical fluctuation for Euro value is between the 10% level and -10%, which is similar to Dollar fluctuations. Both areas are considered as advanced economies by IMF and ONU. For the emerging economy from People’s Republic of China and the advanced
40.000% 30.000% 20.000% 10.000% RER ∆EUR/CH 0.000% RER ∆EUR/JP RER ∆EUR/UK -10.000% RER ∆EUR/US -20.000% -30.000% 2008 2009 2010 2011 2012 2013 2014 2015 2016 2017 Year %
economy from Japan, although more volatile, the historical fluctuation for their currencies is not very far from Euro and Dollar fluctuations.
I define depreciation episodes as periods when the real Euro value devaluates by over 10% compared to the value of the real exchange rate one year earlier. Therefore, depreciation episodes include not only extreme events of depreciation within a short window of time but also periods when there is a cumulative depreciation of at least 10% within a year.
In this study I identify 4 depreciation episodes to be study: a 21.51% Euro devaluation face to Yen in 2009, a 15.88% Euro devaluation face to Yen in 2011, a 12.26% Euro devaluation face to Dollar in 2015 and a 11.14% Euro devaluation face to Dollar in 2016. To avoid treat as different depreciation episodes when the depreciation episodes are consecutive, Euro only can experience one depreciation episode in a 2-year period in relation to the same currency pair. This way, I consider the Euro devaluation face to Dollar of 2016 as a continuation of the Euro depreciation episode face to Dollar in 2015.
The identification of currency depreciation episodes was based on Desai, Foley & Forbes (2007) study but with some adaptations. They identify depreciation episodes in emerging markets, where real exchange rates have a higher volatility, while in this study, I’m looking at economic areas where the volatility is historically lower. So, the percentual devaluation of real exchange rate to be considered as a depreciation episode was adapted to this study reality.
3.3 Descriptive Statistics
The majority of firms in my dataset, without distinction between multinational subsidiaries and local firms, come from the SIC code category Manufacturing, followed by Wholesale Trade, Finance, Insurance and Real Estate and Services. Firms from Construction sector and Mining sector are the firms with lower representation in my data.
Figure 2 Percentage of Firms by SIC Code Category
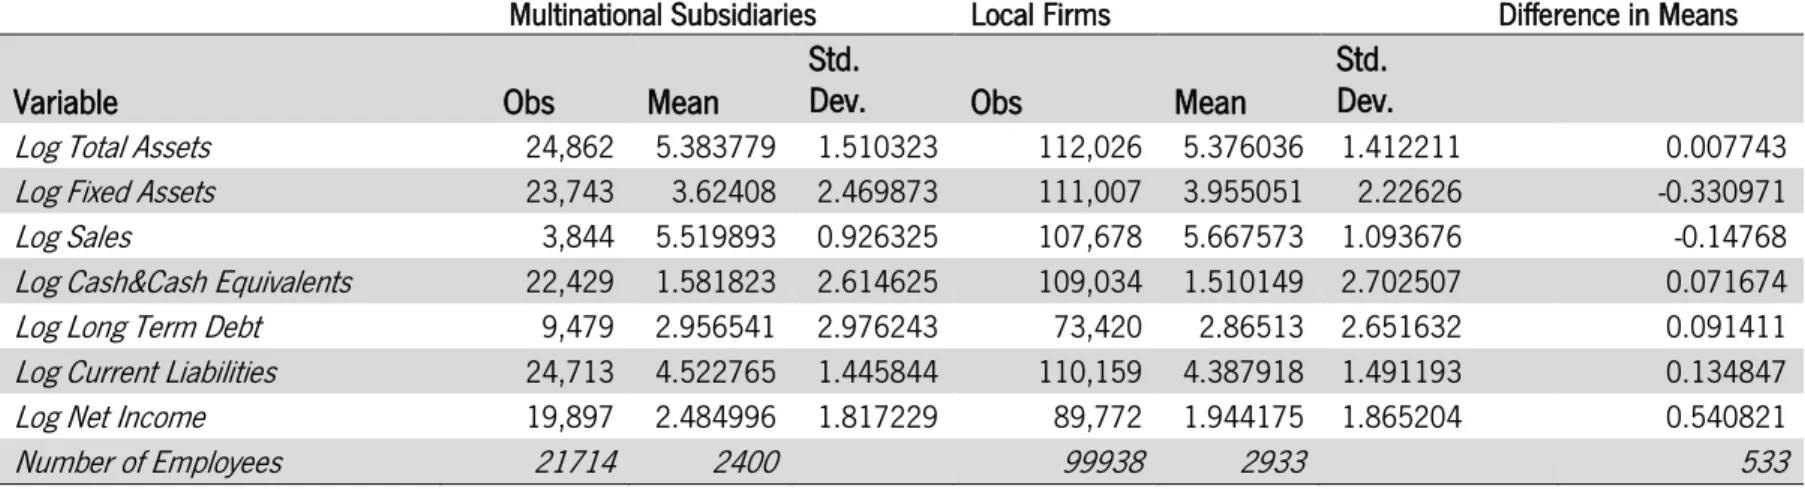
If we look to Table 1, Table 2 and Table 3 we will notice differences in all the variables between the groups in study. Starting by the number of employees, taking in consideration that a minimum of 5 employees’ restriction was applied, we notice that local firms, on average, have more 533 employees than multinationals subsidiaries.
However, this value is different between groups. While Japanese, Chinese and US subsidiaries have, on average, less 1400 employees compared to local firms, subsidiaries from UK are similar to local firms.
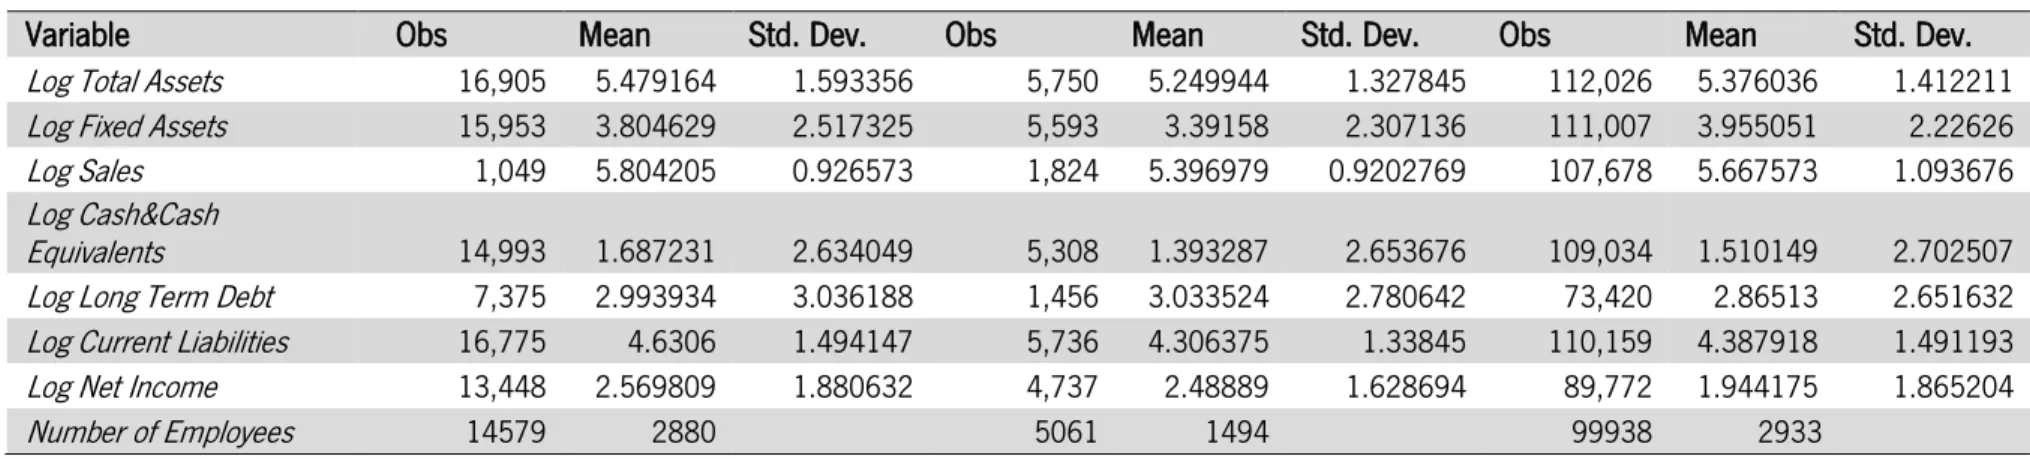
The difference in means column in Table 1 point to a higher value of Total Assets, Cash & Cash Equivalents, Long Term Debt, Current Liabilities and Net income for multinational subsidiaries and a higher value in Fixed Assets and Sales for local firms. However, if we separate multinationals subsidiaries by ultimate owner country, we see that local firms have higher values in all variables when compared to Japanese and Chinese subsidiaries. The relation between subsidiaries from UK and local firms seems more to what it should be expect because, except for fixed assets, for all the variables subsidiaries show higher values.
Manufacturing Wholesale Trade
Finance, Insurance and Real Estate Services Transportation and Public Utilities Retail Trade
Construction Mining NA 18.14 19.44 14.69 27.01 9.9 3.52 1.08 0.29 5.93
Table 1 Summary Statistics: Multinational subsidiaries versus local firms
Multinational Subsidiaries Local Firms Difference in Means
Variable Obs Mean Std. Dev. Obs Mean Std. Dev.
Log Total Assets 24,862 5.383779 1.510323 112,026 5.376036 1.412211 0.007743
Log Fixed Assets 23,743 3.62408 2.469873 111,007 3.955051 2.22626 -0.330971
Log Sales 3,844 5.519893 0.926325 107,678 5.667573 1.093676 -0.14768
Log Cash&Cash Equivalents 22,429 1.581823 2.614625 109,034 1.510149 2.702507 0.071674
Log Long Term Debt 9,479 2.956541 2.976243 73,420 2.86513 2.651632 0.091411
Log Current Liabilities 24,713 4.522765 1.445844 110,159 4.387918 1.491193 0.134847
Log Net Income 19,897 2.484996 1.817229 89,772 1.944175 1.865204 0.540821
Number of Employees 21714 2400 99938 2933 533
Table 1- shows the summary statistics for the logarithm of different variables collected. All variables are deflated into 2015 prices using CPI. Difference in means is the difference between the variable mean for multinational subsidiaries and the variable mean for local firms. The sample period is from 2008 until 2017.
British Subsidiaries American Subsidiaries Local Firms
Variable Obs Mean Std. Dev. Obs Mean Std. Dev. Obs Mean Std. Dev.
Log Total Assets 16,905 5.479164 1.593356 5,750 5.249944 1.327845 112,026 5.376036 1.412211
Log Fixed Assets 15,953 3.804629 2.517325 5,593 3.39158 2.307136 111,007 3.955051 2.22626
Log Sales 1,049 5.804205 0.926573 1,824 5.396979 0.9202769 107,678 5.667573 1.093676
Log Cash&Cash
Equivalents 14,993 1.687231 2.634049 5,308 1.393287 2.653676 109,034 1.510149 2.702507
Log Long Term Debt 7,375 2.993934 3.036188 1,456 3.033524 2.780642 73,420 2.86513 2.651632
Log Current Liabilities 16,775 4.6306 1.494147 5,736 4.306375 1.33845 110,159 4.387918 1.491193
Log Net Income 13,448 2.569809 1.880632 4,737 2.48889 1.628694 89,772 1.944175 1.865204
Number of Employees 14579 2880 5061 1494 99938 2933
Table 2 Summary statistics by Ultimate Owner country
Japanese Subsidiaries Chinese Subsidiaries
Variable Obs Mean Std. Dev. Obs Mean Std. Dev.
Log Total Assets 1,873 5.071785 1.205079 334 4.609591 0.9489707
Log Fixed Assets 1,872 2.991697 2.388987 325 2.405254 1.962962
Log Sales 698 5.479075 0.8620877 273 5.353022 0.8886706
Log Cash&Cash
Equivalents 1,808 1.370791 2.335683 320 0.9627684 2.181267
Log Long Term Debt 508 2.358704 2.665122 140 2.355429 2.512242
Log Current Liabilities 1,871 4.308624 1.269521 331 4.017999 0.9381257
Log Net Income 1,473 1.912444 1.650235 239 1.164355 1.555474
Number of Employees 1764 1285 310 953
Table 3 Summary of difference in means between subsidiaries by ultimate owner country and local firms Variable
JP Subs - Local
firms CH Subs - Local firms UK Subs - Local firms USA Subs - Local Firms
Log Total Assets -0.304251 -0.766445 0.103128 -0.126092
Log Fixed Assets -0.963354 -1.549797 -0.150422 -0.563471
Log Sales -0.188498 -0.314551 0.136632 -0.270594
Log Cash&Cash
Equivalents -0.139358 -0.5473806 0.177082 -0.116862
Log Long Term Debt -0.506426 -0.509701 0.128804 0.168394
Log Current Liabilities -0.079294 -0.369919 0.242682 -0.081543
Log Net Income -0.031731 -0.77982 0.625634 0.544715
Number of Employees -1648 -1980 -53 -1439
Table 3 shows the summary statistics for the logarithm of different variables collected. All variables are deflated into 2015 prices using CPI. In the columns we can see the difference in means between the variable mean for multinational subsidiaries and the variable mean for local firms. The sample period is from 2008 until 2017.
4. Results
4.1 Firms Performance during Depreciation Episodes
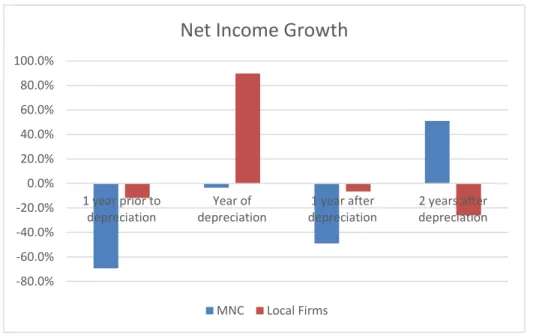
Starting with a simple comparison of reactions to depreciation episodes through growth in net income, sales and assets it is observable that sales and assets growth is always positive within the depreciation episode time, although the trend is a decrease in sales and assets growth (Figure 4 and Figure 5). The net income growth analysis indicates different patterns for multinational subsidiaries and local firms. Apart from two years after the depreciation episode, multinational subsidiaries show a decrease in net income growth, with values below the local firms’ values. Two years after the
depreciation episode, local firms show, on average, a decrease in net income by 25.9%, while multinational subsidiaries invert the decrease trend to increase net income, on average, by 51.0% (Figure 3). Sales growth is similar for multinational subsidiaries and local firms, although for local firms the values are more stable in the year of depreciation and the subsequent years (Figure 4). Asset growth doesn’t follow the same pattern and it is observable that despite the decrease in asset growth for multinational subsidiaries, they increase one year and two years after depreciation in relation to the year of depreciation value.
Local firms present a progressive decrease in asset growth. To point out that for any of the groups the sales and assets growth measures did not reach the values prior to depreciation episodes (Figure 5).
Figure 4 Sales growth during currency crisis 0.0% 0.2% 0.4% 0.6% 0.8% 1.0% 1.2% 1.4% 1.6% 1.8% 1 year prior to depreciation
Year of depreciation 1 year after
depreciation
2 years after depreciation
Sales Growth
Sales Growth MNC Sales Growth Local Firms
-80.0% -60.0% -40.0% -20.0% 0.0% 20.0% 40.0% 60.0% 80.0% 100.0% 1 year prior to depreciation Year of depreciation 1 year after depreciation 2 years after depreciation
Net Income Growth
Figure 5 Asset growth during currency crisis
Note: Figure 3, 4 and 5 compares the median assets growth of multinational affiliates and local firms. It is based on 3404 observations for MNC subsidiaries and on 94950 for local firms. The bars correspond to years relative to a depreciation episode. For this figure it was used the Yen depreciation episode of 2009, the Yen depreciation episode of 2011 and the Dollar depreciation episode of 2015. (The two years after depreciation calculation does not include the two years after Yen episode of 2009 data because it corresponds to the year of depreciation of Yen episode 2011)
From now on, I will use several regressions to get conclusions about my research hypotheses. 0.0% 0.2% 0.4% 0.6% 0.8% 1.0% 1.2% 1.4% 1 year prior to depreciation
Year of depreciation 1 year after
depreciation
2 years after depreciation
Assets Growth
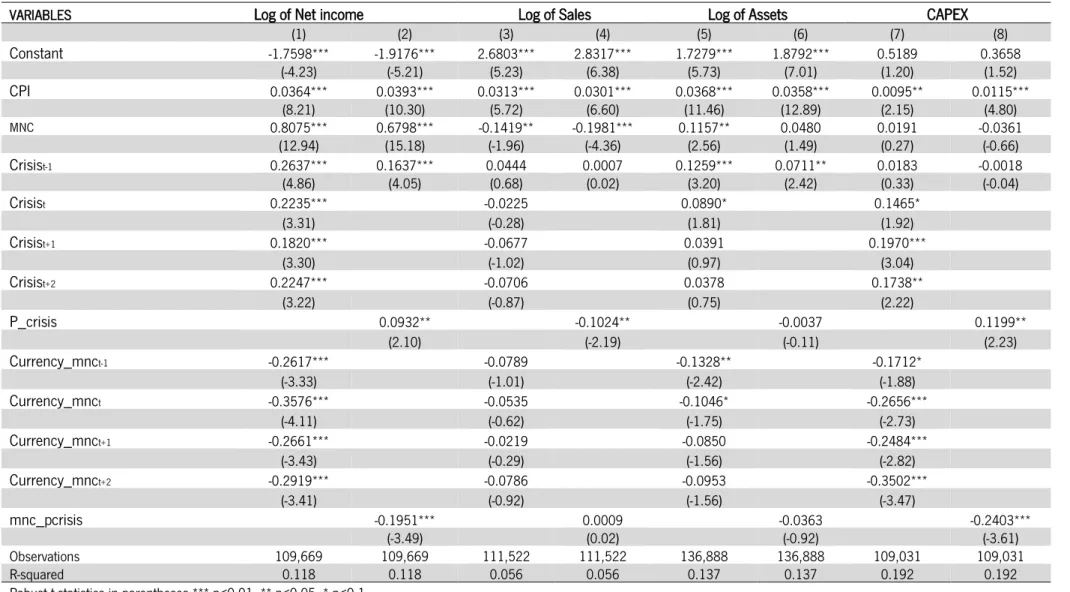
Table 4 Response of multinational subsidiaries and local firms to currency crisis
VARIABLES Log of Net income Log of Sales Log of Assets CAPEX
(1) (2) (3) (4) (5) (6) (7) (8) Constant -1.7598*** -1.9176*** 2.6803*** 2.8317*** 1.7279*** 1.8792*** 0.5189 0.3658 (-4.23) (-5.21) (5.23) (6.38) (5.73) (7.01) (1.20) (1.52) CPI 0.0364*** 0.0393*** 0.0313*** 0.0301*** 0.0368*** 0.0358*** 0.0095** 0.0115*** (8.21) (10.30) (5.72) (6.60) (11.46) (12.89) (2.15) (4.80) MNC 0.8075*** 0.6798*** -0.1419** -0.1981*** 0.1157** 0.0480 0.0191 -0.0361 (12.94) (15.18) (-1.96) (-4.36) (2.56) (1.49) (0.27) (-0.66) Crisist-1 0.2637*** 0.1637*** 0.0444 0.0007 0.1259*** 0.0711** 0.0183 -0.0018 (4.86) (4.05) (0.68) (0.02) (3.20) (2.42) (0.33) (-0.04) Crisist 0.2235*** -0.0225 0.0890* 0.1465* (3.31) (-0.28) (1.81) (1.92) Crisist+1 0.1820*** -0.0677 0.0391 0.1970*** (3.30) (-1.02) (0.97) (3.04) Crisist+2 0.2247*** -0.0706 0.0378 0.1738** (3.22) (-0.87) (0.75) (2.22) P_crisis 0.0932** -0.1024** -0.0037 0.1199** (2.10) (-2.19) (-0.11) (2.23) Currency_mnct-1 -0.2617*** -0.0789 -0.1328** -0.1712* (-3.33) (-1.01) (-2.42) (-1.88) Currency_mnct -0.3576*** -0.0535 -0.1046* -0.2656*** (-4.11) (-0.62) (-1.75) (-2.73) Currency_mnct+1 -0.2661*** -0.0219 -0.0850 -0.2484*** (-3.43) (-0.29) (-1.56) (-2.82) Currency_mnct+2 -0.2919*** -0.0786 -0.0953 -0.3502*** (-3.41) (-0.92) (-1.56) (-3.47) mnc_pcrisis -0.1951*** 0.0009 -0.0363 -0.2403*** (-3.49) (0.02) (-0.92) (-3.61) Observations 109,669 109,669 111,522 111,522 136,888 136,888 109,031 109,031 R-squared 0.118 0.118 0.056 0.056 0.137 0.137 0.192 0.192 Robust t-statistics in parentheses *** p<0.01, ** p<0.05, * p<0.1
Note: The dependent variable is the logarithm of net income in columns (1) and (2), the logarithm of sales in columns (3) and (4), the logarithm of assets in column (5) and (6) and capital expenditures (CAPEX) in columns (7) and (8). The sample used is based on 2009 Euro/Yen depreciation episode, 2011 Euro/Yen depreciation episode and 2015 Euro/Dollar depreciation episode. Each regression includes year/industry fixed effects. “CPI” is the consumer price index for euro area (Base=2015). The time sub-scripted “Crisis” variable is a set of dummies equal to 1 in the year prior to, the year of, and the two years following a depreciation episode. “P_crisis” is a dummy equal to 1 in the year of and the two years following a depreciation. The time sub scripted “Currency_mnc” is the interaction between “Crisis” variable and “mnc”. “mnc” is a dummy set equal to 1 for multinational subsidiaries. “mnc_pcrisis” is the interaction variable between “mnc” variable and “P_crisis”. In “Crisis” and “P_crisis” are not included the two years after de 2009 Yen depreciation episode, because 2011 is the year of another depreciation episode.
Table 4 analyze the levels of net income, sales, assets and capital expenditures (CAPEX) around the time of depreciation episodes using the equation described in the methodology. The dependent variable in columns (1) and (2) is the log of net income, measured in real euros, so that the coefficients on the interaction variables are interpreted as the additional value of net income relative to mean firm net income.
The coefficients in column (1) indicates an overall increase in net income during depreciation episodes by more than 18% each year. However, the interaction variables show different results, indicating a worst performance for multinational subsidiaries in relation to local firms. In the year of the depreciation episode multinational subsidiaries underperform local firms by 35.8% and the underperformance extends to the two following years by 26.6% and 29.2%. Column (2) of table 4 also present results for the level of net income. Although, the dummies for the year of depreciation and the two years following a depreciation episode are combined into one variable called “P_crisis”- post crisis. The results confirm the worst performance of multinational subsidiaries in relation to local firms. While firms, on average, increase the net income during the post crisis period by 9.3%, multinational subsidiaries underperform local firms 19.5%, meaning that multinational subsidiaries decrease net income in the post crisis period by 10.2% (this value corresponds to the sum between the average for all firms and the additional for multinational subsidiaries).
The regressions in columns (3) and (4) don’t provide statistically significant information about the performance of local firms and multinational subsidiaries in terms of sales.
The level of assets shows positive coefficients for firms in the year before and the year of the depreciation episode, although the lower increase in the year of depreciation episode. Multinational subsidiaries underperform local firms in the same years by 13.23% and 10.5%, respectively. On average, the level of assets reduces by 0.4% in the post crisis period but the reduction for multinational subsidiaries is ten times bigger for the same period (-4%).
Columns (7) and (8) analyze the investment behavior of local and multinational firms during depreciation episodes. It uses capex as measure of investment. Capex was defined as de difference between the log of property, plant and equipment in year T and the log of property, plant and equipment in year T-1, plus the log of depreciations and amortizations at year T. Capex regressions
coefficients confirm the indications given by the level of assets. While, on average, firms show positive values for capex in the year of the depreciation episode and the two following years, with an increase by 12% during the post crisis period, multinational subsidiaries present a decrease in capex in each year during the depreciation episode. In the year following a depreciation episode, capex was lower than the value for local firms by 24.8% and lower by 35% two years after the depreciation. The post crisis coefficient show that multinational subsidiaries invested less 24% than the average of firms in the post crisis period.
These results are based on three Euro depreciations episodes above 10% (real exchange rate) that include only Japanese and American multinational subsidiaries. With multinational subsidiaries from only two countries it is important analyze the performance of multinational subsidiaries by country. This will test if the worst multinational subsidiaries performance is transversal to both countries and if there are differences between groups.
4.2 Firms Performance during Depreciation Episodes by
Ultimate Owner Country
Separating the analysis of response and investment of subsidiaries and local firms to depreciation episodes by subsidiaries ultimate owner country allows to check if there are different patterns for different countries.
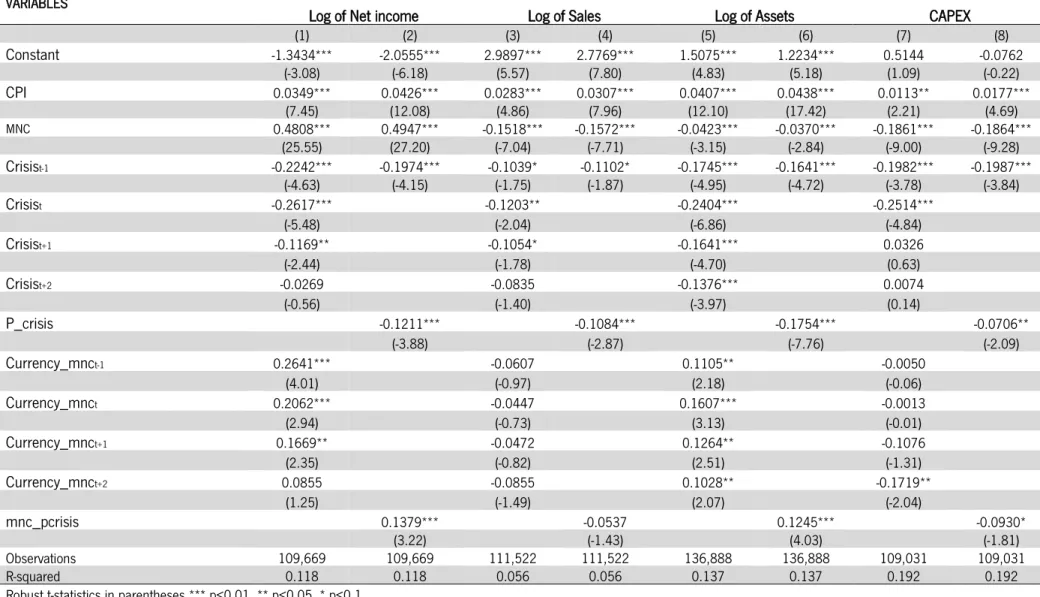
Table 5 Response of American multinational subsidiaries and local firms to currency crisis
VARIABLES
Log of Net income Log of Sales Log of Assets CAPEX
(1) (2) (3) (4) (5) (6) (7) (8) Constant -1.3434*** -2.0555*** 2.9897*** 2.7769*** 1.5075*** 1.2234*** 0.5144 -0.0762 (-3.08) (-6.18) (5.57) (7.80) (4.83) (5.18) (1.09) (-0.22) CPI 0.0349*** 0.0426*** 0.0283*** 0.0307*** 0.0407*** 0.0438*** 0.0113** 0.0177*** (7.45) (12.08) (4.86) (7.96) (12.10) (17.42) (2.21) (4.69) MNC 0.4808*** 0.4947*** -0.1518*** -0.1572*** -0.0423*** -0.0370*** -0.1861*** -0.1864*** (25.55) (27.20) (-7.04) (-7.71) (-3.15) (-2.84) (-9.00) (-9.28) Crisist-1 -0.2242*** -0.1974*** -0.1039* -0.1102* -0.1745*** -0.1641*** -0.1982*** -0.1987*** (-4.63) (-4.15) (-1.75) (-1.87) (-4.95) (-4.72) (-3.78) (-3.84) Crisist -0.2617*** -0.1203** -0.2404*** -0.2514*** (-5.48) (-2.04) (-6.86) (-4.84) Crisist+1 -0.1169** -0.1054* -0.1641*** 0.0326 (-2.44) (-1.78) (-4.70) (0.63) Crisist+2 -0.0269 -0.0835 -0.1376*** 0.0074 (-0.56) (-1.40) (-3.97) (0.14) P_crisis -0.1211*** -0.1084*** -0.1754*** -0.0706** (-3.88) (-2.87) (-7.76) (-2.09) Currency_mnct-1 0.2641*** -0.0607 0.1105** -0.0050 (4.01) (-0.97) (2.18) (-0.06) Currency_mnct 0.2062*** -0.0447 0.1607*** -0.0013 (2.94) (-0.73) (3.13) (-0.01) Currency_mnct+1 0.1669** -0.0472 0.1264** -0.1076 (2.35) (-0.82) (2.51) (-1.31) Currency_mnct+2 0.0855 -0.0855 0.1028** -0.1719** (1.25) (-1.49) (2.07) (-2.04) mnc_pcrisis 0.1379*** -0.0537 0.1245*** -0.0930* (3.22) (-1.43) (4.03) (-1.81) Observations 109,669 109,669 111,522 111,522 136,888 136,888 109,031 109,031 R-squared 0.118 0.118 0.056 0.056 0.137 0.137 0.192 0.192 Robust t-statistics in parentheses *** p<0.01, ** p<0.05, * p<0.1
Note: The dependent variable is the logarithm of net income in columns (1) and (2), the logarithm of sales in columns (3) and (4), the logarithm of assets in column (5) and (6) and capital expenditures (CAPEX) in columns (7) and (8). The sample used is based on 2015 Euro/Dollar depreciation episode. Each regression includes year/industry fixed effects. “CPI” is the consumer price index for euro area (Base=2015). The time sub-scripted “Crisis” variable is a set of dummies equal to 1 in the year prior to, the year of, and the two years following a depreciation episode. “P_crisis” is a dummy equal to 1 in the year of and the two years following a depreciation. The time sub scripted “Currency_mnc” is the interaction between “Crisis” variable and “mnc”. “mnc” is a dummy set equal to 1 for multinational subsidiaries. “mnc_pcrisis” is the interaction variable between “mnc” variable and “P_crisis”. In “Crisis” and “P_crisis” are not included the two years after de 2009 Yen depreciation episode, because 2011 is the year of another depreciation episode.
The analysis of American multinational subsidiaries performance shows different results from table 4 results. In table 4 multinational subsidiaries underperform local firms in relation to net income, assets and capex, however, the results in table 5 indicate a better performance for American
multinational subsidiaries in relation to local firms in almost all variables.
Columns (1) and (2) indicates a different pattern in the behavior of net income. While table 4 (column (1) and (2)) indicates an increase in net income levels, on average, and a negative additional for multinational subsidiaries, table 5 (columns (1) and (2)) indicates a decrease in each year in analysis (with the exception for two years after depreciation episode for which is not possible to draw conclusions due to lack of significance) resulting in a decrease by 12.1% in the post crisis period. The interaction coefficients exhibit positive values, meaning that American multinational subsidiaries overperform local firms during the post crisis period by 13.8% in relation to net income. Despite of the big difference between American multinational subsidiaries and local firms, American multinational subsidiaries increase, on average, net income by 1.7% during post crisis period.
Column (3) and (4) indicates that in the post crisis period firms reduce sales by 10.8%. The coefficients for the level of assets (column (5) and (6)) shows, on average, a decrease by 17.5% in the level of assets in the post crisis period. American multinational subsidiaries overperform local firms in each year in analyze. However, the overperformance from American multinational subsidiaries don’t represent an increase in the level of assets. In fact, the level of assets reduces by 5.1% during the post crisis period.
In the post crisis period, capex reduces, on average, by 7.1% Although, only statistically significant at the 10 percent level, American multinational subsidiaries underperform local firms by 9.3%, meaning a reduction in capex by 16.4% in the post crisis period.
Table 6: Response of Japanese multinational subsidiaries and local firms to currency crisis
VARIABLES Log of Net income Log of Sales Log of Assets CAPEX
(1) (2) (3) (4) (5) (6) (7) (8) Constant -3.4798*** -3.1642*** 2.5890*** 2.8877*** 0.8500*** 1.1991*** -0.3346 0.1131 (-8.49) (-8.26) (5.00) (6.09) (2.82) (4.26) (-0.81) (0.31) CPI 0.0554*** 0.0523*** 0.0315*** 0.0285*** 0.0457*** 0.0423*** 0.0195*** 0.0151*** (13.61) (13.73) (6.17) (6.10) (15.28) (15.14) (4.73) (4.22) MNC 0.6393*** 0.6270*** -0.1336*** -0.1419*** 0.1095*** 0.0991*** -0.1242*** -0.1242*** (33.35) (32.98) (-6.69) (-7.14) (7.86) (7.20) (-5.71) (-5.71) Crisist-1 0.2839*** 0.2381*** 0.1196** 0.0877* 0.2038*** 0.1574*** 0.0793 0.0347 (6.86) (6.40) (2.30) (1.86) (6.74) (5.77) (1.21) (0.66) Crisist 0.1356*** 0.0204 0.1653*** 0.1022** (3.57) (0.44) (5.94) (2.56) Crisist+1 -0.0091 -0.0856* 0.0162 0.0042 (-0.23) (-1.72) (0.56) (0.08) Crisist+2 -0.0112 -0.0606 0.0470 -0.0051 (-0.23) (-1.13) (1.39) (-0.10) P_crisis 0.0429 -0.0416 0.0795*** 0.0487 (1.56) (-1.29) (4.00) (1.54) Currency_mnct-1 -0.5256*** -0.1382 -0.2407*** -0.1125 (-3.75) (-1.34) (-3.07) (-0.54) Currency_mnct -0.6238*** -0.0588 -0.2554*** -0.1949* (-5.25) (-0.71) (-3.89) (-1.77) Currency_mnct+1 -0.1575 0.0557 -0.1087 -0.0320 (-1.35) (0.62) (-1.44) (-0.22) Currency_mnct+2 -0.3096** -0.0426 -0.2062** -0.1348 (-2.39) (-0.45) (-2.50) (-0.90) mnc_pcrisis -0.4619*** -0.0297 -0.2232*** -0.1395** (-6.79) (-0.58) (-5.31) (-1.99) Observations 109,669 109,669 111,522 111,522 136,888 136,888 109,031 109,031 R-squared 0.119 0.118 0.056 0.056 0.137 0.137 0.192 0.192 Robust t-statistics in parentheses *** p<0.01, ** p<0.05, * p<0.1
Note: The dependent variable is the logarithm of net income in columns (1) and (2), the logarithm of sales in columns (3) and (4), the logarithm of assets in column (5) and (6) and capital expenditures (CAPEX) in columns (7) and (8). The sample used is based on 2009 Euro/Yen depreciation episode, 2011 Euro/Yen depreciation episode. Each regression includes year/industry fixed effects. “CPI” is the consumer price index for euro area (Base=2015). The time sub-scripted “Crisis” variable is a set of dummies equal to 1 in the year prior to, the year of, and the two years following a depreciation episode. “P_crisis” is a dummy equal to 1 in the year of and the two years following a depreciation. The time sub scripted “Currency_mnc” is the interaction between “Crisis” variable and “mnc”. “mnc” is a dummy set equal to 1 for multinational subsidiaries. “mnc_pcrisis” is the interaction variable between “mnc” variable and “P_crisis”. In “Crisis” and “P_crisis” are not included the two years after de 2009 Yen depreciation episode, because 2011 is the year of another depreciation episode.
The overall Japanese multinational subsidiaries performance is different from the American multinational subsidiaries’ performance. While American multinational subsidiaries overperform local firms in all the variables in study, except for capex, Japanese multinational subsidiaries underperform local firms in all the variables.
Columns (1) and (2) shows an increase in net income, on average, by 13.6% in the year of depreciation episode, however, Japanese multinational subsidiaries underperform local firms by 62.4%. In the post crisis period, Japanese multinational subsidiaries underperform local firms by 46.2%.
The level of assets increases, on average, by 8% in the post crisis period, reflecting a slower increase in relation to the pre-crisis values (15.7% one year before the depreciation episode). Japanese multinational subsidiaries underperform local firms by 25.5% in the year of depreciation episode and shows a reduction on asset levels by 14.4% during the post crisis period (columns (5) and (6)).
Capex increase, on average, by 10.2% in the year of depreciation episode, however, Japanese multinational subsidiaries reduce capex by 9.3% in the same year (column (7)). During the post crisis period Japanese multinational subsidiaries underperform local firms by 14% in relation to capex (column (8)).
The comparison between American and Japanese multinational subsidiaries indicates a worst performance of Japanese multinational subsidiaries with general underperformance in relation to local firms, while American multinational subsidiaries overperform local firms in general, and a higher gap between them and local firms.
In order to evaluate if the bad performance of Japanese multinational subsidiaries is influencing the results from table 4, once, from the three currency crisis in analyze in table 4, the bigger two correspond to Euro devaluation face to Yen, I will test the robustness of the results, so far, doing a regression for all Euro devaluations bigger than 8% (RER).
4.3 Firms performance during Euro depreciation episodes
higher than 8%
Setting up a new devaluation value for to be considered as a depreciation episode increases the number of currency crisis for analyze. Between 2008 and 2017 were 8 euro depreciation episodes above 8%: 2011 Euro devaluation face to Chinese Yuan, 2015 Euro devaluation face to Chinese Yuan, 2009 Euro devaluation face to Japanese Yen, 2015 Euro devaluation face to Japanese Yen, 2016 Euro devaluation face to Japanese Yen, 2010 Euro devaluation face to British Pound, 2015 Euro devaluation face to American Dollar and 2016 Euro devaluation face to American dollar (the 2016 Euro devaluation face to American dollar is consider as a continuation of the episode in the year before and exclude from the analyze).
Table 7 Response of multinational subsidiaries and local firms to 8% currency crisis
VARIABLES Log of Net income Log of Sales Log of Assets CAPEX
(1) (2) (3) (4) (5) (6) (7) (8) Constant -1.5470*** -3.8386*** 3.2428*** 2.4075*** 2.1522*** 0.4792 0.5985 1.3185*** (-4.36) (-8.69) (8.50) (4.36) (8.51) (1.49) (1.14) (2.71) CPI 0.0375*** 0.0627*** 0.0256*** 0.0348*** 0.0345*** 0.0528*** 0.0103* 0.0034 (9.53) (12.90) (5.93) (5.71) (12.27) (14.95) (1.81) (0.72) MNC 0.5285*** 0.2964*** -0.1864*** -0.2957*** -0.0575* -0.2227*** -0.1034* -0.2313*** (10.63) (5.46) (-3.56) (-4.71) (-1.65) (-5.77) (-1.85) (-5.42) Crisist-1 -0.0477 -0.0162 -0.0001 -0.0013 -0.0890*** -0.0560*** -0.0559 -0.0929*** (-1.20) (-0.69) (-0.00) (-0.05) (-3.20) (-3.22) (-1.32) (-3.37) Crisist -0.1091*** -0.0117 -0.1052*** 0.0093 (-3.03) (-0.27) (-4.06) (0.23) Crisist+1 -0.0275 -0.0291 -0.0202 0.0456 (-0.74) (-0.72) (-0.78) (1.15) Crisist+2 -0.0511 -0.0571 -0.0603** 0.0567 (-1.34) (-1.33) (-2.20) (1.31) P_crisis -0.3567*** -0.1554** -0.2862*** -0.0750 (-6.68) (-2.46) (-7.49) (-1.55) Currency_mnct-1 -0.1237* 0.0126 0.0021 -0.0766 (-1.92) (0.21) (0.05) (-1.08) Currency_mnct -0.1570*** 0.0410 0.0107 -0.1300** (-2.91) (0.82) (0.29) (-2.14) Currency_mnct+1 -0.1398*** 0.0375 -0.0761** -0.0449 (-2.94) (0.77) (-2.26) (-0.90) Currency_mnct+2 -0.0195 0.0530 0.0427 -0.0538 (-0.40) (1.08) (1.22) (-0.98) mnc_pcrisis 0.1607*** 0.1825*** 0.2072*** 0.0414 (2.85) (2.88) (5.16) (0.86) Observations 109,669 109,669 111,522 111,522 136,888 136,888 109,031 109,031 R-squared 0.118 0.118 0.056 0.056 0.137 0.137 0.192 0.192 Robust t-statistics in parentheses *** p<0.01, ** p<0.05, * p<0.1
Note: The dependent variable is the logarithm of net income in columns (1) and (2), the logarithm of sales in columns (3) and (4), the logarithm of assets in column (5) and (6) and capital expenditures (CAPEX) in columns (7) and (8). The sample used is based on2011 Euro devaluation face to Chinese Yuan, 2015 Euro devaluation face to Chinese Yuan, 2009 Euro devaluation face to Japanese Yen, 2015 Euro devaluation face to Japanese Yen, 2016 Euro devaluation face to Japanese Yen, 2010 Euro devaluation face to British Pound, 2015 Euro devaluation face to American Dollar. Each regression includes year/industry fixed effects. “CPI” is the consumer price index for euro area (Base=2015). The time sub-scripted “Crisis” variable is a set of dummies equal to 1 in the year prior to, the year of, and the two years following a depreciation episode. “P_crisis” is a dummy equal to 1 in the year of and the two years following a depreciation. The time sub scripted “Currency_mnc” is the interaction between “Crisis” variable and “mnc”. “mnc” is a dummy set equal to 1 for multinational subsidiaries. “mnc_pcrisis” is the interaction variable between “mnc” variable and “P_crisis”. In “Crisis” and “P_crisis” are not included the two years after de 2009 Yen depreciation episode, because 2011 is the year of another depreciation episode.
When it is added more depreciation episodes, the results change in relation to the results from table 4. Columns (1) and (2) shows that, on average, firms decrease net income by 10.9% in the year of the depreciation episode and during the post period crisis decrease by 35.7%. In the year of
depreciation episode multinational subsidiaries underperform local firms by 15.7%, however, in the post crisis period they overperform local firms by 16.1%. Yet, this overperformance still means that
multinational subsidiaries decrease net income by 19.6% in the post crisis period.
The level of sales decrease, on average, by 15.5% in the post crisis period, however,
multinational subsidiaries overperform local firms by 18.3%, showing an increase in the level of sales by 2.8% in the same period.
Columns (5) and (6) indicate that multinational subsidiaries overperform local firms in the level of assets. On average, firms reduce assets in the year of depreciation episode by 10.5% and by 6% two years after the depreciation episode, meaning a decrease in the post crisis period by 28.6%. On the other hand, multinational subsidiaries underperform local firms one year after the depreciation episode by 7.6% but they overperform in the post crisis period by 20.7%. Although this is the variable with higher overperformance for multinational subsidiaries in the post crisis period, the analysis indicates that multinational subsidiaries reduce assets by 7.9% in that period.
Due to the lack of statistically significance for most of capex coefficients, the regression only indicates that in the year of the depreciation episode multinational subsidiaries underperform local firms by 13% in relation to capex.
Adding more depreciation episodes and multinationals subsidiaries, whose ultimate owner is from other countries, results in a general overperformance from multinational subsidiaries in relation to local firms. This difference in relation to the results from table 4 may indicates that the small sample of Japanese multinational subsidiaries is influencing the results, once they show a different performance in relation to American multinational subsidiaries (table 5 and 6) and, when in group with all
the objective to assess if the results for multinational subsidiaries improve when Japanese multinational firms are excluded from the regression, I create a new regression and the results are in table 8.
As expected, the results are slightly better now for multinational subsidiaries, and shows an increase in the additional over local firms in relation to net income and sales. Apart from capex (columns (8)), multinational subsidiaries still overperform local firms in the other three variables in study by 20% approximately. However, this overperformance doesn’t mean a positive value in net income or in assets levels. Indeed, multinational subsidiaries reduce net income by 10.4% in the post crisis period and assets levels by 6.7% (columns (2) and (6)). In contrast, multinational subsidiaries increase sales by 3.9% in the post crisis period.
Table 7 don’t provide statistically significant results for capex, however, table 8 do. On average, one year after depreciation episodes capex increase by 9.4% and in the post crisis period by 14.2%. Multinational subsidiaries underperform local firms one year after depreciation episodes by 13.7% and in the post crisis period by 18.6%, meaning that multinational subsidiaries show a reduction on investment by 4.4% in the period after a depreciation episode.
Table 8: Response of multinational subsidiaries and local firms to 8% currency crisis (Japanese firms excluded)
VARIABLES Log of Net income Log of Sales Log of Assets CAPEX
(1) (2) (3) (4) (5) (6) (7) (8) Constant -1.5885*** -3.5652*** 2.8774*** 2.3351*** 2.2272*** 0.6471** 0.6833 0.4917 (-4.08) (-8.10) (6.68) (4.28) (8.00) (2.02) (1.42) (1.22) CPI 0.0375*** 0.0595*** 0.0296*** 0.0356*** 0.0327*** 0.0503*** 0.0089* 0.0100** (8.94) (12.39) (6.32) (5.96) (10.88) (14.39) (1.80) (2.46) MNC 0.5276*** 0.3112*** -0.2316*** -0.2946*** 0.0185 -0.1713*** -0.0905* (15.30) (6.31) (-5.74) (-5.08) (0.75) (-4.84) (-1.76) Crisist-1 0.0258 0.1098*** -0.0301 0.0430 0.0243 0.0604** 0.0452 -0.0088 (0.62) (3.32) (-0.63) (1.07) (0.81) (2.53) (0.85) (-0.25) Crisist -0.0666* -0.0611 -0.0487* -0.0530 (-1.71) (-1.40) (-1.75) (-1.13) Crisist+1 -0.0537 -0.0582 -0.0134 0.0936** (-1.43) (-1.39) (-0.50) (2.04) Crisist+2 -0.0534 -0.1000** -0.0379 0.0606 (-1.27) (-2.11) (-1.27) (1.09) P_crisis -0.3257*** -0.1637*** -0.2576*** 0.1419*** (-6.20) (-2.65) (-6.83) (6.90) Currency_mnct-1 -0.0040 0.0959 -0.0448 -0.1120* (-0.08) (1.56) (-1.12) (-1.66) Currency_mnct -0.0601 0.1135** 0.0047 -0.0637 (-1.21) (1.99) (0.13) (-1.14) Currency_mnct+1 -0.0206 0.1008* -0.0398 -0.1375** (-0.41) (1.83) (-1.10) (-2.43) Currency_mnct+2 0.0126 0.1085* 0.0166 -0.0123 (0.25) (1.91) (0.46) (-0.21) mnc_pcrisis 0.2214*** 0.2026*** 0.1910*** -0.1863*** (4.09) (3.22) (4.90) (-7.76) Observations 109,669 109,669 111,522 111,522 136,888 136,888 109,031 109,031 R-squared 0.118 0.118 0.056 0.056 0.136 0.137 0.192 0.191 Robust t-statistics in parentheses *** p<0.01, ** p<0.05, * p<0.1
Note: The dependent variable is the logarithm of net income in columns (1) and (2), the logarithm of sales in columns (3) and (4), the logarithm of assets in column (5) and (6) and capital expenditures (CAPEX) in columns (7) and (8). The sample used is based on2011 Euro devaluation face to Chinese Yuan, 2015 Euro devaluation face to Chinese Yuan, 2010 Euro devaluation face to British Pound, 2015 Euro devaluation face to American Dollar. Each regression includes year/industry fixed effects. “CPI” is the consumer price index for euro area (Base=2015). The time sub-scripted “Crisis” variable is a set of dummies equal to 1 in the year prior to, the year of, and the two years following a depreciation episode. “P_crisis” is a dummy equal to 1 in the year of and the two years following a depreciation. The time sub scripted “Currency_mnc” is the interaction between “Crisis” variable and “mnc”. “mnc” is a dummy set equal to 1 for multinational subsidiaries. “mnc_pcrisis” is the interaction variable between “mnc” variable and “P_crisis”.
4.4 Comparison between tradable and non-tradable sectors
It is expected that firms in tradable sectors profit from a currency devaluation, once the products become cheaper, which can boost sales and net income. To assess if this competitive advantage extends to multinational subsidiaries within the area facing a currency depreciation, multinational subsidiaries were separated into two groups according to the sectors where they have operations: tradable sectors or non-tradable sectors (defined by their two digits SIC code).
The results from the regressions in table 9 compare multinational subsidiaries with local firms and multinational subsidiaries from the tradable sectors with the multinational subsidiaries from non-tradable sectors. The regressions are based on currency devaluations higher than 8%.
Multinational subsidiaries from tradable sectors underperform local firms in each year of analysis by more than 30% in relation to net income, meaning a reduction in net income by 26% one year after depreciation episode. On the contrary, multinational subsidiaries from non-tradable sectors overperformed local firms by 14.1% in the post crisis period, despite of the underperformance in the year of depreciation episode by 14.6%. However, this means that net income decreases by 7.8% in the period.
In relation to level of sales, most of the coefficients don’t provide statistically significant results, however, it should be noted that multinational subsidiaries from non-tradable sectors overperform local firms by 23.9%.
Although this analysis only regards net income and the level of sales and other variables could be useful to improve analysis, it indicates that multinational subsidiaries from non-tradable sectors overperform multinational subsidiaries from tradable sectors, suggesting that the competitiveness effects from a currency depreciation don’t extend to multinational subsidiaries or that due to the nature of business of non-tradable sectors, characterized with higher profit margins, on average, and with more ease of change, are a preponderant factor to multinational subsidiaries from tradable sectors don’t profit with a depreciation episode.
Table 9 Comparison between multinational subsidiaries from tradable and non-tradable sector
Tradable sectors Non-tradable sectors
VARIABLES Log of Net income Log of Sales Log of Net income Log of Sales
Constant -1.0023*** -3.0691*** 3.4070*** 2.1631*** -0.7694** -2.8676*** 3.4681*** 2.8198*** (-2.91) (-6.98) (9.13) (3.99) (-2.20) (-6.49) (9.41) (5.15) CPI 0.0288*** 0.0532*** 0.0232*** 0.0371*** 0.0261*** 0.0507*** 0.0224*** 0.0296*** (7.63) (10.93) (5.57) (6.19) (6.81) (10.35) (5.43) (4.87) MNC 0.7648*** 0.3906*** -0.1164** -0.2703*** 0.7638*** 0.4177*** -0.1455*** -0.2354*** (18.73) (6.90) (-2.58) (-4.22) (18.46) (7.41) (-3.20) (-3.59) Crisist-1 0.2051*** 0.0812*** 0.0542 0.0283 0.2222*** 0.1111*** 0.0717* 0.0646** (6.24) (2.89) (1.47) (0.90) (6.53) (3.91) (1.94) (2.03) Crisist 0.0602 -0.0056 0.0803** 0.0101 (1.58) (-0.12) (2.00) (0.23) Crisist+1 0.0611* -0.0255 0.0789** -0.0084 (1.82) (-0.66) (2.26) (-0.22) Crisist+2 0.0581 -0.0311 0.0852** -0.0239 (1.59) (-0.74) (2.29) (-0.58) P_crisis -0.2473*** -0.1785*** -0.2187*** -0.1007 (-4.60) (-2.86) (-4.04) (-1.59) mnct-1 -0.4916*** -0.1333** -0.1942*** 0.0757 (-6.81) (-2.19) (-3.68) (1.19) mnct -0.3613*** -0.0731 -0.1463** 0.1007 (-4.88) (-1.16) (-2.56) (1.52) mnct+1 -0.3215*** -0.0788 -0.0434 0.1035 (-4.47) (-1.31) (-0.77) (1.64) mnct+2 -0.3024*** -0.0545 -0.0503 0.1245* (-4.10) (-0.94) (-0.86) (1.93) mnc_pcrisis -0.0331 0.0628 0.1410** 0.2391*** (-0.51) (0.92) (2.40) (3.44) Observations 109,669 109,669 111,522 111,522 109,669 109,669 111,522 111,522 R-squared 0.118 0.118 0.056 0.056 0.118 0.118 0.056 0.056 Robust t-statistics in parentheses *** p<0.01, ** p<0.05, * p<0.1
Note: The dependent variable is the logarithm of net income in columns (1) and (2), the logarithm of sales in columns (3) and (4), the logarithm of assets in column (5) and (6) and capital expenditures (CAPEX) in columns (7) and (8). The sample used is based on2011 Euro devaluation face to Chinese Yuan, 2015 Euro devaluation face to Chinese Yuan, 2009 Euro devaluation face to Japanese Yen, 2015 Euro devaluation face to Japanese Yen, 2016 Euro devaluation face to Japanese Yen, 2010 Euro devaluation face to British Pound, 2015 Euro devaluation face to American Dollar. Each regression includes year/industry fixed effects. “CPI” is the consumer price index for euro area (Base=2015). The time sub-scripted “Crisis” variable is a set of dummies equal to 1 in the year prior to, the year of, and the two years following a depreciation episode. “P_crisis” is a dummy equal to 1 in the year of and the two years following a depreciation. The time sub scripted “Currency_mnc” is the interaction between “Crisis” variable and “mnc”. “mnc” is a dummy set equal to 1 for multinational subsidiaries. “mnc_pcrisis” is the interaction variable between “mnc” variable and “P_crisis”. In “Crisis” and “P_crisis” are not included the two years after de 2009 Yen depreciation episode, because 2011 is the year of another depreciation episode.
4.5 The impact of multinationals country currency
devaluations on subsidiaries investment
In order to assess if there is different investment performance between multinational
subsidiaries, whose multinational country currency is facing a depreciation and the others multinational subsidiaries it is necessary define the depreciation episodes. Based on Figure 1 (Section 2.2) it will be used four depreciation episodes with devaluations above 10% in relation to Euro: 2009 Pound
devaluation (29.23%), 2013 and 2014 Yen devaluation (15.19% and 24.25%, respectively) and the 2017 Pound devaluation (14.52%). To avoid depreciation episodes contamination, a two years consecutive devaluation face to Euro is considered as only one depreciation episode.
Table 10 shows that UK multinational subsidiaries overperform multinational subsidiaries competitors in each year of the depreciation episode. While, on average, capex reduces by 48% in the year of depreciation episode and by 39.9% in the post crisis period, UK multinational subsidiaries show an additional in capex by 32.8% and by 27.5%, respectively. However, UK multinational subsidiaries still reduce investment in the post crisis period by 12.4%.
The coefficients for Japanese multinational subsidiaries don’t provide statistically significant results and for that reason it is not possible confirm or deny if the overperformance from UK
multinational subsidiaries results from a specific characteristic or if multinational subsidiaries benefit from a home country currency depreciation.
Table 10 UK and Japanese subsidiaries performance during multinationals country currency devaluation
Note: The dependent variable is capex. The sample used in column (1) and (2) is based on 2009 and 2017 Pound
devaluation face to euro. Each regression includes firm fixed effects. “CPI” is the consumer price index for euro area (Base=2015). The time and country sub-scripted “Devaluation” variable is a set of dummies equal to 1 in the year prior to, the year of, and the two years following the devaluation episode. “P_crisis” is a dummy equal to 1 in the year of and the two years following a depreciation. The time sub scripted “UKmncsubs” is the interaction between “PoundDevaluation” variable and “UKsubs”. “UKsubs” is a dummy set equal to 1 for multinational subsidiaries from United Kingdom. “UKmncsubs_Pcrisis” is the interaction variable between “UKsubs” variable and “p_crisis”. The time sub scripted “JPmncsubs” is the interaction between “YenDevaluation” variable and“JPsubs”. “JPsubs” is a dummy set equal to 1 for multinational subsidiaries Japan. “JPmncsubs_Pcrisis” is the interaction variable between “JPsubs” variable and “p_crisis”. Becausethere is no data for 2008 capex, the variable UKdevaluationt-1 is not defined.
UK Subsidiaries Japanese Subsidiaries
VARIABLES CAPEX CAPEX
(1) (2) (3) (4) Constant 0.9570*** 0.8746*** 0.4907** 0.4898** (3.83) (3.65) (2.09) (2.09) Uksubs -0.0135 -0.0135 JPsubs -0.3229*** -0.2797*** (-0.63) (-0.63) (-4.86) (-4.58) CPI 0.0066*** 0.0074*** CPI 0.0112*** 0.0112*** (2.59) (3.02) (4.66) (4.66) YenDevaluation1t -0.1187*** -0.1007** (-2.61) (-2.27) PoundDevaluation -0.4801*** YenDevaluation -0.1095** (-6.20) (-2.38) PoundDevaluationt1 -0.3453*** YenDevaluationt1 -0.0055 (-4.72) (-0.12) PoundDevaluationt2 -0.3758*** YenDevaluationt2 0.0351 (-5.17) (0.79) UKp_crisis -0.3989*** JPp_crisis -0.0245 (-9.25) (-0.93) JPmncsubst-1 0.2868* (1.75) UKmncsubs 0.3284*** JPmncsubst 0.1747 (3.48) (1.05) UKmncsubst1 0.2162** JPmncsubst+1 0.0601 (2.41) (0.37) UKmncsubst2 0.2817*** JPmncsubst+2 0.0642 (3.20) (0.41) UKmncsubs_Pcrisis 0.2750*** JPmncsubs_Pcrisis 0.0544 (4.99) (0.52) Observations 109,031 109,031 Observations 109,031 109,031 R-squared 0.191 0.191 R-squared 0.191 0.191 Robust t-statistics in parentheses *** p<0.01, ** p<0.05, * p<0.1