UNIVERSIDADE DA BEIRA INTERIOR
Engenharia
Analysis of Network Attacks and Security Events
using Modern Data Visualization Techniques
Paulo Macedo Pereira
Dissertação para obtenção do Grau de Mestre em
Engenharia Informática
(2
ociclo de estudos)
Orientador: Prof. Doutor Pedro R. M. Inácio
Dedicatory
To my parents, my sister and my brother in law, for all the help, patience and encouragement throughout my career so far.
Acknowledgments
During my academic path, I had the help and support from many people, either directly or indirectly. It is due to them that I got to this stage of my life.
First of all, I want to thank my parents, Deolinda Macedo and Domingos Pereira, who provided me with an education and a future. They have always supported me and comprised my biggest incentive to write this dissertation. I am also grateful to my sister, Natalia Pereira and my brother in law, Sérgio Marques, who, similarly to my parents, always supported me in every aspect of my academic path, and helped me to keep the motivation to successfully end the dissertation.
Then, I want to acknowledge my supervisor, Professor Doutor Pedro R. M. Inácio, for having accepting me in this masters program, as well as for all the help and time spent in guiding me through the course of the masters program.
Last, but not least, I want to aknowledge the friends that helped, encouraged and motivated me the most, allowing me to overcome this challenge. João Catarino, João Ferreira, Patricia D'amil and Gonçalo Paiva: thank you very much.
Resumo
As técnicas de visualização de dados contêm recursos vitais em várias áreas, desde a pesquisa até há área pro ssional. Representações e cazes estão frequentemente a contribuir para a compreensão do quadro geral, a partir de um grande volume de dados, às vezes permite novas descobertas ou para uma síntese e ciente. Devido há grande quantidade de dados que os com-putadores lidam nos dias de hoje, muitas técnicas modernas de visualização de dados foram desenvolvidas para lidar com os grandes conjuntos de dados, permitindo perceber caracterís-ticas únicas. Na era da informação, os computadores (e os seus utilizadores) e as redes estão entre as maiores fontes de dados, embora eles também sejam utilizados no seu processamento e armazenamento. Muitos sistemas de monitorização de rede e dispositivos de segurança fazem uso de técnicas de visualização de dados tradicionais para reportar funcionalidades ou para fornecer informações pro ssionais sobre o estado dos dados.
O âmbito deste trabalho insere-se no cruzamento dos campos, das técnicas de segurança de rede e de visualização dos dados. Os objectivos são estudar abordagens modernas para repre-sentar os dados, que podem actualmente ser utilizados em outras áreas, e aplicar uma dessas abordagens na visualização de tráfego de rede e ataques. Avaliar a sua utilidade das visual-izações também era um objectivo, juntamente com a constituição de um grande conjunto de representações para várias classes de tráfego e ataques de rede clássicos.
A técnica conhecida como Circos, amplamente utilizada para representações genéticas, foi aplicada para alcançar os objectivos deste programa de mestrado. Muitas representações para pelo menos 18 conjuntos de tráfego diferentes foram produzidas ao longo deste trabalho, com muitas analisadas detalhadamente nesta dissertação. Esses conjuntos, contendo tráfego gera-dos pelas aplicações contemporâneas e ataques clássicos de rede ou actividades de sondagem, foram seleccionados a partir de dois conjuntos de dados. De forma a produzir o Circos, um conjunto mínimo de características de tráfego foram identi cadas, e foram implementados vários scripts para automatizar o processo. Para a parte nal deste trabalho, uma experiência baseada na comparação (humana) entre nove conjuntos conhecidos e nove desconhecidos foram criados. Para demonstrar que as representações foram úteis para identi car as classes de tráfe-gos ou ataques. Durante a experiência, foi possível identi car correctamente oito, dos nove conjuntos (um dos ataques foi incorrectamente classi cado como tráfego Hypertext Transfer
Palavras-chave
Ataques Informáticos de Rede, Circos, Classes de Tráfego, Monitorização de Tráfego de Rede, Representação Grá ca dos Dados, Técnicas de Visualização de Dados Modernas
Resumo alargado
Introdução
Esta secção é composta por um resumo alargado sobre o trabalho realizado nesta dissertação. Contém as ideias principais enumeradas ao longo da dissertação. Inicialmente, começa-se por efetuar a descrição do problema abordado e quais os objetivos especí cos, assim como são re-sumidamente descritas e mencionadas as principais contribuições resultantes do trabalho. De seguida, é apresentado um breve resumo de todos os capítulos da dissertação incluindo alguns detalhes mais importantes como a menção a trabalho relacionado na área e sobre outras téc-nicas de visualização, assim como os conjuntos de dados utilizados para o posterior desenvolvi-mento dos grá cos. O método utilizado para análise dos conjuntos e as tecnologias utilizadas ao longo do projeto também são aqui descritos, bem como uma sucinta análise dos resulta-dos obtiresulta-dos na fase nal do trabalho de mestrado. Por último, são apresentadas as principais conclusões.
Enquadramento, Descrição do Problema e Objetivos
A área da informática é uma área do conhecimento muito vasta. A tecnologia associada a esta área está em constante evolução, e afeta a vida humana muito signi cativamente. A prolifer-ação da Internet of Things (IoT), por exemplo, acabará por levar a uma grande conectividade pelo mundo dos dispositivos, capazes de interagir entre si e os seres humanos através da Inter-net. Essa tecnologia tem o potencial de tornar a vida humana melhor, mas também agravar os problemas de segurança existentes ou gerar novos.
Por causa da enorme utilização da Internet, muitas equipas têm de lidar com incidentes de segurança diariamente [Lou15], que vão desde ameaças amadoras nacionais até ataques es-truturados internacionais. Lidar com incidentes de segurança é difícil por muitas razões, mas principalmente porque alguns ataques são projetados ou executados para serem furtivos e difí-ceis de correlacionar. Por exemplo, um único ataque pode parecer uma série de incidentes isolados. Normalmente, os peritos de segurança recorrem a ferramentas para identi car visual-mente ameaças ou fazer correlações, mas estes sistemas não são perfeitos. Muitos ataques são realizados através da rede e podem atingir o objetivo através de diferentes caminhos. Como tal, as técnicas de visualização de eventos de rede ou classes de tráfego compreendem um subconjunto crítico da área acima mencionada, em que esta dissertação se foca. A visualização de tráfego é importante para muitos sistemas de monitorização (não só os relacionados com a
segurança), uma vez que proporcionam formas mais rápidas para entender o comportamento da rede, muito útil para administradores de rede e de sistemas. É comum que os Network based
Intrusion Detection System (NIDS), rewalls ou dispositivos de segurança criarem grá cos (por
exemplo, grá cos de linhas ou de barras) para métricas como a largura de banda, número de ligações por unidade de tempo, as estatísticas sobre pacotes descartados, entre outros, nos relatórios que produzem após os eventos de rede ou segurança. A visualização dos dados es-tá-se a tornar cada vez mais importante na monitorização e segurança das redes e sistemas, porque as redes estão mais complexas, devido ao aumento de dispositivos ligados e ao aumento do processamento de recursos. Apesar das técnicas de visualização tradicionais, tais como os grá cos clássicos de barras ou linhas, serem adequadas para muitos propósitos nesta área, vale a pena fazer o levantamento das técnicas de visualização, adaptá-las e veri car a sua utilidade para este propósito. Para alcançar os objetivos descritos, o trabalho de investigação desta dissertação foi dividido nas seguintes fases:
1. Revisão do estado da arte, em termos de ferramentas e técnicas utilizadas para a visual-ização de dados, assim como em termos de linguagens de programação para a potencial implementação de scripts;
2. Identi cação de técnicas de visualização de dados e ferramentas associadas, assim como um estudo aprofundado da técnica seleccionada, e preparação de várias experiências preliminares;
3. Focada na selecção dos dados a serem utilizados e na escolha das características que podem ser utilizadas para produzir as visualizações;
4. Desenvolvimento do(s) script(s) para produzir as visualizações sobre os dados;
5. Realização de experiências para avaliar a capacidade de classi car os grá cos produzidos com a técnica escolhida;
6. Escrita da dissertação.
Principais Contribuições
A principal contribuição desta dissertação consistiu na aplicação de técnicas modernas de visu-alização de dados para classi car ataques na rede. A técnica de visuvisu-alização conhecida como
Circos foi utilizada no âmbito deste trabalho. Entre o capítulo 3 e o capitulo 5 estão presentes
as várias representações desenvolvidas, sendo que no nal são discutidos os resultados. Emb-ora o processo descrito seja manual, é mostrado que é possível classi car grá cos de registos
de tráfego desconhecidos a partir de grá cos de tráfego conhecido. A abordagem fornece, as-sim, uma prova de conceito e conclui-se que é possível produzir uma classi cação automática, utilizando por exemplo, mecanismos de inteligência arti cial com processamento de imagem. A segunda contribuição provém da elaboração do estado da arte em termos de conceitos rela-cionados com a visualização de ataques e da construção de um grande conjunto de visualizações utilizando o Circos. O estudo da arte em termos de técnicas de visualização é o tema principal do capítulo 2, enquanto a descrição dos conjuntos de dados, scripts para construir o Circos e as amostras dos resultados estão incluídos nos capítulos 3, 4 e 5.
Estado da Arte
Para a elaboração do trabalho descrito nesta dissertação foi necessário primeiro estudar aborda-gens para a visualização de tráfego na rede existentes, assim como o estudo de várias técnicas de visualização de outras áreas. Este estudo é descrito no capítulo 2. Resumidamente é dito que as técnicas utilizadas para a criação de visualizações podem ser as mais variadas possíveis. São apresentadas técnicas de visualização de ataques, que propõem visualizações recorrendo a 3 Dimensions (3D) [JPLL09] [NUCB12] [CGM+13] [NAU+13], estando também discutida uma
técnica baseada no motor de um jogo [HA06], onde certos eventos de segurança despoletam várias ações, como por exemplo, a actualização das listas de controlo na rewall. As técnicas baseiam-se na visualização das atividades da rede, e quando existe alguma atividade fora dos padrões normais, esta é identi cada. Foram também analisadas várias técnicas de visualização de dados. Entre as várias técnicas temos por exemplo, a Edible Or Medical, uma técnica de visualização de dados que representa vários tipos de plantas, e se estas são possíveis de serem utilizadas para ns medicinais, comestíveis ou ambas. É possível também observar que existe um grá co interativo Paperscape, que é um repositório online sobre artigos cientí cos.
Circos e os Dados
O Circos [KSB+09] apresentado na secção 3.2 foi inicialmente desenvolvido para a visualização
de dados do genoma, mas rapidamente proliferou para outras áreas de investigação. É uma vi-sualização circular e é geralmente ideal para a observação de relações (ou falta delas). Ganhou popularidade devido à sua exibilidade de representação, de nindo as quantidades ou objectos que a superfície circular deve ligar, sendo que as ligações são curvas, de ponto a ponto, dentro de um circulo. Nesta mesma secção, são apresentados os primeiros grá cos Circos, obtidos a partir de tráfego Voice over IP (VoIP). Os conjuntos de dados utilizados no âmbito deste tra-balho provêm de duas fontes principais: alguns do Massachusetts Institute of Technology (MIT)
este trabalho foi realizado. Os conjuntos de dados do MIT contêm vários cheiros. Para este tra-balho, apenas os cheirostcpdump e list foram relevantes. O primeiro contém todos os pacotes que foram capturados, enquanto o segundo contém informação importante sobre o conjunto de dados. Os conjuntos de dados do laboratório são similares aos do MIT. Os cheiros estavam também no formatotcpdump, sendo que a única diferença entre eles são que os conjuntos de dados capturados no laboratório foram realizados recorrendo-se a aplicações legítimas e, nos do
MIT, os conjuntos contêm ataques. Para ser possível observar os dados, utilizou-se a aplicação Wireshark.
Método e Ferramentas
No capítulo 4 são mencionadas as ferramentas utilizadas para o desenvolvimento dos grá cos
Circos. Para realizar este projecto foi necessário o uso de várias tecnologias e software. As três
principais tecnologias/softwares utilizadas foram o Wireshark, para a análise, ltragem e pro-cessamento do tráfego de rede, Python, para criar scripts para a manipulação e transformação dos dados, e o software Circos (que é desenvolvido em Perl) para criar as representações
Cir-cos. A ferramenta Wireshark foi útil nesta parte do trabalho, através do qual foi possível aceder
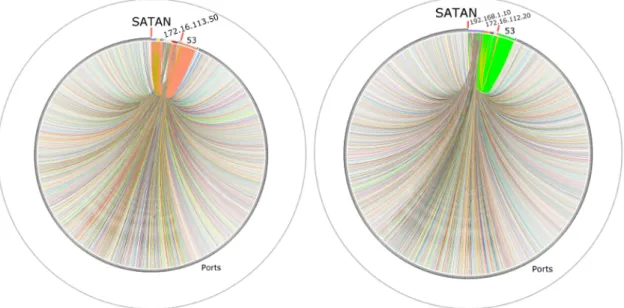
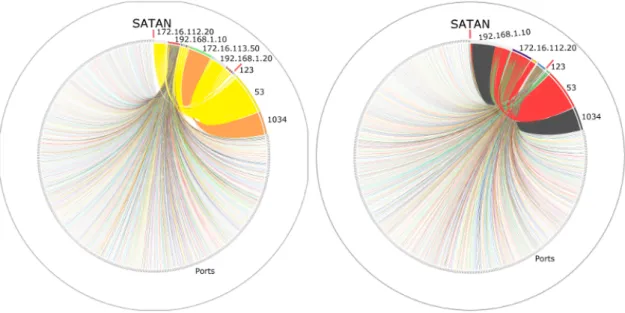
à informação relevante existente nos conjuntos de dados. É capaz de mostrar informação sobre os vários campos de vários protocolos, tais como os endereços Internet Protocol (IP) destino e fonte, números de porta, nome do protocolo, entre outras informações. Foram também apresentados os grá cos Circos relativos às investidas de uma ferramenta de catalogação de vulnerabilidades em rede, conhecida como Satan. Por último são explicados os scripts desen-volvidos (em Python). Para a execução dos scripts é necessária a informação de output do
Wireshark. Após transformar os dados fornecidos pelos Wireshark, os scripts produzem três
cheiros necessários para o software Circos. Cada um desses cheiros contém informação rele-vante, sendo que no primeiro contém informação sobre as etiquetas (IPs e portas), o segundo, tem informação sobre as ligações entre as várias etiquetas (ponto de origem, ponto de destino, entre outras), e terceiro e último cheiro guarda o nome das etiquetas e das cores associadas a cada uma.
Análise dos Resultados
No capítulo 5 são inicialmente apresentados os grá cos Circos criados a partir de tráfego legí-timo. Foram desenvolvidos grá cos para quatro conjuntos de dados legítimos, entre eles in-cluem-se VoIP, HTTP, Peer-to-peer (P2P) e Secure Shell (SSH). De seguida, apresentam-se e discutem-se os grá cos relativos a registos de tráfego cujo conteúdo é conhecido e se referem a ataques. Entre os ataques temos o Neptune, Back, NMAP, Dictionary e por último o Satan.
Após a apresentação dos grá cos conhecidos, foi realizada uma classi cação através de uma comparação com os grá cos desconhecidos com o objetivo de veri car se era possível
identi-car a que conjuntos de dados pertenciam os grá cos. Por último, o capítulo tem uma discussão sobre os resultados obtidos. Para ser possível identi car a que conjuntos de dados pertencem os grá cos, é necessário primeiramente saber as características de cada protocolo, assim como de cada ataque. De seguida é necessário observar atentamente os grá cos conhecidos e descobrir quais as características que podem ser únicas e úteis na identi cação dos tráfegos. Entre os nove conjuntos de dados desconhecidos utilizados, foi possível identi car oito. O ataque Satan foi o único cujo tráfego não foi identi cado. Por outro lado, entre os desconhecidos, foram classi cados dois conjuntos de dados como pertencendo ao tráfego HTTP.
Conclusões e Trabalho Futuro
Esta dissertação aborda o problema de produzir visualizações úteis de grandes quantidades de dados, nomeadamente para o tráfego de rede e ataques relacionados. Tudo começou com a análise de algumas visualizações de ataques na rede, para depois convergir para o objetivo mais especí co, o da classi cação de tráfego de rede e identi car ataques utilizando a téc-nica conhecida como Circos. Uma das principais conclusões é que o Circos pode realmente ser utilizado para esse m, utilizando características simples de tráfego. Os objectivos deste pro-grama de mestrado foram alcançados: um grande conjunto de grá cos Circos para tráfego de rede, e para ataques de rede clássicos, foram construídos durante o decorrer deste trabalho; visualizações com muitos dados foram discutidas nesta dissertação para identi car os aspetos que as visualizações enfatizam; a experiência e os resultados discutidos foram apresentados no capítulo 5 e provado que o Circos pode ser utilizado para identi car classes de tráfego de rede e ataques. Muitos grá cos foram criados e analisados. Para cada conjunto de dados foram criados pelo menos seis grá cos Circos diferentes. Dependendo da classe de tráfego ou a apli-cação associada, a maioria dos grá cos provou ser útil. Na fase nal do programa de mestrado, os grá cos foram divididos em dois grupos principais: um com grá cos cuja proveniência era conhecido; outro cuja as classes de tráfego ou ataques eram desconhecidos. Cada um destes grupos foi subdividido em 9 subgrupos, correspondente a 9 classes de tráfego diferentes ou ataques. Foi possível identi car 8 das 9 classes ou ataques, que foi mais que o esperado, tendo em conta o conjunto de características utilizadas. O conjunto que não foi corretamente
identi-cado pertencia a um ataque, com comportamento semelhante ao tráfego HTTP. Os resultados argumentam a favor do potencial desta técnica de visualização de dados aplicado ao tráfego de rede.
Abstract
Data visualization techniques comprise crucial resources in many research and professional ar-eas. Effective representations often contribute to the understanding of the overall picture behind a large volume of data, sometimes leading to novel discoveries or to an ef cient syn-thesis. Due to the large amount of data that computers handle nowadays, many modern data visualizations techniques were designed to deal with such large data sets, exhibiting unique characteristics. In the information era, computers (and their operators) and networks are also amongst the biggest sources of raw data, though they are also used in its processing and stor-age. Many network monitoring systems and security appliances make usage of traditional data visualization techniques in reporting functionalities or to provide practitioners with status in-formation.
The scope of this work falls within the intersection of the elds of network security and data visualization techniques. Its objectives are to study modern approaches to represent data, which may be currently being used in other areas, and apply one of those approaches in the visualization of network traf c and attacks. Assessing the usefulness of the visualizations was also an objective, along with the constitution of a large data set of representations for several traf c classes and classical network attacks.
A technique known as Circos, widely used for genomic representations, was the one applied for achieving the objectives of this masters program. Many representations for at least 18 different traf c traces were produced along this work, with many analyzed with detail in this disserta-tion. These traces, containing traf c generated by contemporary applications and classical network attacks or probing activities, were selected from two datasets. In order to produce the Circos, a minimal set of traf c characteristics was identi ed,and several scripts for au-tomating the processing were implemented. Towards the nal part of this work, an experiment based on the (human) comparison between nine labeled and nine unlabeled Circos was set up to demonstrate that the obtained representations were useful up to the point of being used to identify traf c classes or attacks. During the experiment, it was possible to correctly identify eight, out of the nine, traces (one of the attacks was incorrectly classi ed as HTTP traf c), proving the usefulness of this technique in this eld.
Keywords
Circos, Graphical Representation of Data, Network Based Attacks, Network Traf c Monitoring, Modern Data Visualization Techniques, Traf c Classes
Contents
1 Introduction 1
1.1 Motivation and Scope . . . 1
1.2 Problem Statement and Objectives . . . 2
1.3 Adopted Approach for Solving the Problem . . . 3
1.4 Main Contributions . . . 4
1.5 Dissertation Overview . . . 4
2 Related Work 7 2.1 Introduction . . . 7
2.2 Related Work on Visualization of Network Attacks . . . 7
2.3 Interesting Data Visualization Techniques . . . 16
2.4 Conclusions . . . 19
3 Data Visualization Techniques and Datasets 21 3.1 Introduction . . . 21
3.2 Circos The Data Visualization Technique Used in the Scope of this Work . . . 21
3.3 Datasets . . . 25
3.4 Conclusions . . . 28
4 Method and Experimental Setup 29 4.1 Introduction . . . 29
4.2 Technologies and Libraries . . . 29
4.3 Method for Analyzing of Network Traf c . . . 30
4.4 Scripts Prototype . . . 33
4.5 Conclusions . . . 34
5 Analysis of the Results 35 5.1 Introduction . . . 35
5.2 Data Visualizations of Legitimate Network Traf c . . . 35
5.3 Data Visualization of Known Attacks . . . 38
5.4 Classi cation via Comparison of Data Visualizations . . . 44
5.5 Discussion . . . 55
5.6 Conclusions . . . 56
6 Conclusions and Future Work 57 6.1 Main Conclusions . . . 57
6.2 Future Work . . . 58
List of Figures
2.1 Aerial front view visualization produced by 3DSVAT. . . 12
2.2 Screenshot of CyberVis (taken from [CGM+13]). . . 13
2.3 Real-Time Traf c View of Visual Firewall (taken from [LTG+05]). . . 13
2.4 A potential stealthy port scan (taken from [NAU+13]). . . 14
2.5 Virtual representation of the greynets with 25 addresses (taken from [HA06]). . . 14
2.6 Passive Visual Fingerprinting for the information ow starting at the external IP, passing to the external port, then to the internal port, and nally to the internal IP (taken from [CA04]). . . 15
2.7 Screenshot of the framework developed by Riad et al. [REHA11]. . . 16
2.8 Attack dependency graph outputted by RAVEN (taken from [HLH11]). . . 16
2.9 Representation for any mention of the word God in the Bible (taken from [Ein14]). 17 2.10 Representation for any Edible or Medical plant (taken from [Tul14]). . . 17
2.11 Representation of an interactive graphic to visualize an online repository for sci-enti c research papers (taken from [DG13]). . . 18
2.12 Representation of just over 10 million Wikipedia articles divided into categories(adapted from [PAC14]). . . 19
3.1 Circos representation obtained for destination port information from VoIP traf c. 23 3.2 Circos representation obtained for source port information from VoIP traf c. . . 23
3.3 Circos representation obtained for destination and source port information from VoIP traf c. . . 24
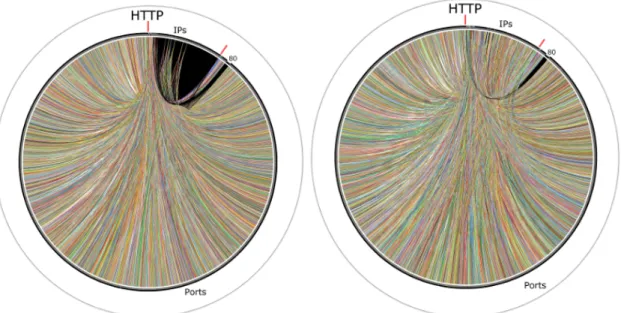
3.4 Circos representation obtained for destination port information from HTTP traf c. 26 3.5 Circos representation obtained for source port information from HTTP traf c. . . 27
3.6 Circos representation obtained for destination and source port information from HTTP traf c. . . 27
3.7 Circos representation obtained for TCP ag information from HTTP traf c. . . 28
4.1 Circos representation obtained for destination port information from a trace with a portscan. . . 31
4.2 Circos representation obtained for the source port information from a trace with a portscan. . . 32
4.3 Circos representation obtained for destination and source port information from a trace with a portscan. . . 32
4.4 Circos representation obtained for TCP ag information from portscan traf c. . . 33
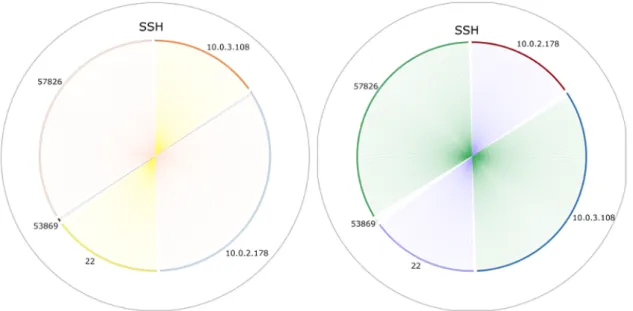
5.1 Circos representation obtained for destination port information from SSH traf c. 36 5.2 Circos representation obtained for source port information from SSH traf c. . . . 36
5.3 Circos representation obtained for destination and source port information from SSH traf c. . . 37 5.4 Circos representation obtained for destination port information from P2P traf c. 37 5.5 Circos representation obtained for destination and source port information from
P2P traf c. . . 38 5.6 Circos representation obtained for source port information from a DoS attack
against a webserver. . . 39 5.7 Circos representation obtained for destination and source port information from
a DoS attack against a webserver. . . 39 5.8 Circos representation obtained for destination port information from a trace
where a Dictionary attack is happening on a router with SNMP. . . 40 5.9 Circos representation obtained for destination and source port information from
a trace where a Dictionary attack is happening on a router with SNMP. . . 40 5.10 Circos representation obtained for destination port information from a SYN ood
attack. . . 41 5.11 Circos representation obtained for source port information from a SYN ood attack. 42 5.12 Circos representation obtained for destination and source port information from
a SYN ood attack. . . 42 5.13 Circos representation obtained for TCP ag information from syn ood attack. . . 43 5.14 Circos representation obtained for destination port information generated by a
scan tool. . . 43 5.15 Circos representation obtained for destination and source port information
gen-erated by a scan tool. . . 44 5.16 Circos representation obtained for destination port information for unknown
traf-c (later traf-classi ed as VoIP traf traf-c). . . 45 5.17 Circos representation obtained for destination and source port information for
unknown traf c (later classi ed as VoIP traf c). . . 45 5.18 Circos representation obtained for source port information for unknown traf c
(later classi ed as SSH traf c). . . 46 5.19 Circos representation obtained for destination and source port information for
unknown traf c (later classi ed as SSH traf c). . . 46 5.20 Circos representation obtained for source port information for unknown traf c
(later classi ed as P2P traf c). . . 47 5.21 Circos representation obtained for destination and source port information for
unknown traf c (later classi ed as P2P traf c). . . 47 5.22 Circos representation obtained for destination port information for unknown
traf-c (later traf-classi ed as Batraf-ck attatraf-ck traf traf-c). . . 48 5.23 Circos representation obtained for destination and source port information for
5.24 Circos representation obtained for destination port information for unknown traf-c (later traf-classi ed as Neptune attatraf-ck traf traf-c). . . 49 5.25 Circos representation obtained for destination and source port information for
unknown traf c (later classi ed as Neptune attack traf c). . . 49 5.26 Circos representation obtained for TCP ag information for unknown traf c (later
classi ed as Neptune attack traf c). . . 50 5.27 Circos representation obtained for source port information for unknown traf c
(later classi ed as HTTP traf c). . . 50 5.28 Circos representation obtained for destination and source port information for
unknown traf c (later classi ed as HTTP traf c). . . 51 5.29 Circos representation obtained for destination port information for unknown
traf-c (later traf-classi ed as HTTP traf traf-c also). . . 51 5.30 Circos representation obtained for destination and source port information for
unknown traf c (later classi ed as HTTP traf c also). . . 52 5.31 Circos representation obtained for destination port information for unknown
traf-c (later traf-classi ed as NMAP attatraf-ck traf traf-c). . . 52 5.32 Circos representation obtained for destination and source port information for
unknown traf c (later classi ed as NMAP attack traf c). . . 53 5.33 Circos representation obtained for source port information for unknown traf c
(later classi ed as Dictionary attack traf c). . . 53 5.34 Circos representation obtained for destination and source port information for
unknown traf c (later classi ed as Dictionary attack traf c). . . 54
List of Tables
Acronyms and Abbreviations
3D 3 Dimensions
2D 2 Dimensions
3DSVAT 3D Stereoscopic Vulnerability Assessment Tool ACK Acknowledge
ACM Association for Computing Machinery
API Application Programming Interface
ASR Attack Surface Reduction
BPMN Business Process Modeling and Notation
CPAN Comprehensive Perl Archive Network
CSS Cascading Style Sheets
DARPA Defence Advanced Research Projects Agency DDoS Distributed Denial-of-Service
DoS Denial-of-Service
EAS External Attack Surface
FIN Finished
FPS First Person Shooter
FTP File Transfer Protocol
FRE3DS Framework for Rendering Enhanced 3D Stereoscopic Visualizations for Network
Security
HIDS Host based Intrusion Detection System
HTTP Hypertext Transfer Protocol
HVS Human Visual System
IAS Internal Attack Surface
IDE Integrated Development Environment
IDS Intrusion Detection System
IoT Internet of Things
IP Internet Protocol
LLC Logical Link Control
MIT Massachusetts Institute of Technology
NCR National Cyber Range
NIDS Network based Intrusion Detection System
OS Operative System
OSI Open System Interconnection
P2P Peer-to-peer
PCF Partial completion Filters
PERL Practical Extraction and Report Language
PHP Hypertext Preprocessor
PSF Python Software Foundation
QoS Quality of Service
RINSE Real-Time Immersive Network Simulation Environment
SNMP Simple Network Management Protocol
SIEM Security Information and Event Management
SIMTEX Simulator Training Exercise Network SSH Secure Shell
SYN Synchronize
TCP Transmission Control Protocol
TDNN Time Delay Neural Network
UDP User Datagram Protocol
Chapter 1
Introduction
This dissertation describes visualization techniques to network attacks and security events. In this chapter, the motivation and the scope to approach this subject is discussed, followed by the problems statement and objectives and how to overcome these problems. The adopted approach to solve the problem, the main contributions are the two next sections. In the last section, the contents of each chapter of the dissertation will be described.
1.1 Motivation and Scope
Computer science is a very dynamic area of knowledge. The technology associated with this area is constantly evolving and effectively changing the life of humans. For example, mobile devices are growing both in number and in terms of processing and storage capabilities [Tri15]. The proliferation of the IoT will eventually lead to a highly connect world of devices, capa-ble of interacting amongst themselves and the humans via the Internet. Prospectively, such technology has the potential to make human life better, but also to worsen existing security problems or spawn new ones. In the internetworked world of today, many response teams have to handle security incidents in a daily basis [Lou15], spanning from amateur national threats to structured international attacks. Dealing with security incidents is dif cult due to many rea-sons, but mostly because some attacks are designed or performed to be stealthy and hard to correlate. E.g., a single attack may look like a series of isolated incidents. Typically, incident response teams or cyber-security experts use tools that aid them to visually identify threats or correlations, though these systems are not perfect.
Many attacks are network based and may reach their target via different paths. As such, techniques for the visualization of network events or traf c classes comprise a critical subset of the aforementioned eld, on which this dissertation is focused on. Traf c visualization is important for many monitoring systems also (not only security related), since they provide quicker ways to understand the behavior of a network, very useful for network and system administrators. It is common for NIDS, rewalls or security appliances to output charts (e.g., bar or line charts) concerning bandwidth usage, number of connections per time unit, statistics on dropped packets, amongst others, in the reports that they produce after network or security
events [Cis15] [Spl15] [DEL15] [Rev14], e.g., Allot communications e CISCO]. Data visualization is becoming increasingly important on traf c monitoring and security because networks are also becoming more complex, as the number of connected devices and processing capabilities increase. Though traditional data representation and visualization techniques, such as classic bar or line charts, are suitable for many purposes in this eld, it is worthwhile to keep surveying the techniques for data visualization, trying to adapt them, and assess their usefulness.
This mater's dissertation is focused on assessing the usefulness of applying modern data visu-alization techniques to computer network security and traf c monitoring. More speci cally, it will try to assess if particular data visualizations can be used to classify network traf c, detect intrusions or identify attacks. Within the computer science area, it falls in the intersection between the two major axis of traf c analysis and classi cations, and security. By choice, it converges to the assessment of the possibility of taking advantage of data visualizations for classi cation of classical attacks. Under the 2012 version of the Association for Computing Ma-chinery (ACM) Computing Classi cation System, a de facto standard for computer science, the scope of the master's program, re ected in this dissertation, falls within the categories named:
• Security and privacy∼Intrusion detection systems
• Security and privacy∼Denial-of-service attacks
• Security and privacy∼Firewalls
• Networks∼Network monitoring
1.2 Problem Statement and Objectives
This dissertation addresses the problem of nding ef cient means to graphically represent large sets of data, namely for the case of network traf c. The speci city of the problem spans from the fact that the data of interest refers, in the scope of this work, to computer based attacks, which are dominated by arti cial processes, to the complex nature of source of such data (computer networks). The events that the attacks generate are often dif cult to represent in a human friendly manner, but such representations are useful for the detection, classi cation, understatement and reporting of such events.
The main objectives of this work are thus to study modern data visualization techniques, ap-plied in other areas of science with different purposes, and assess the applicability of at least one of those techniques in the context of the analysis of network attacks. Secondary objectives
of the master's program include identifying the best set of network traf c characteristics for producing the representations; constructing a large set of data visualizations for contemporary network traf c and analyzing them; delivering fresh visual representations for well known clas-sical attacks using the implemented technique(s); and implementing a proof-of-concept that demonstrates its usefulness. Achieving such goal will most certainly require the de nition of datasets for analysis and investigate how to adapt the data related with computer networks, attacks and security incidents to these techniques.
1.3 Adopted Approach for Solving the Problem
To accomplish the objectives described in the previous section, the research work of this mas-ters program was divided into the following phases:
• Phase 1 consisted in the revision of the state-of-the-art in terms of data visualization techniques and tools, intrusion detection, security events correlation and Security In-formation and Event Management (SIEM) systems; getting acquainted with the research problem, identify and get to know the tools and technologies useful in the context of this work, namely in terms of potential programming languages for implementing scripts and required software packages;
• Phase 2 was focused on the identi cation of data visualizations techniques and associated tools, which led to the in-depth study of the selected data visualization technique and related software library and to the preparation of several preliminary experiments for getting acquainted with the way of functioning of such library;
• Phase 3 was focused on the selection of data to be analyzed, namely of traf c traces containing normal and attack related traf c. The traf c characteristics that would be used to produce the data visualizations were also identi ed in this phase, which required using and adapting the software for producing the data visualization technique, studying the correct syntax for input data and how to control the outputs;
• Phase 4 included the prototyping of scripts to automatically process the datasets and produce a structured set of graphical representations for the characteristics identi ed in Phase 3 using the technique selected in Phase 2. This phase included also a preliminary analysis of the results;
• Phase 5 consisted in conducting a series of experiments for showing that it is possible to
this work;
• Phase 6 was devoted to the structuring of the obtained material and to the writing of the
master's dissertation.
1.4 Main Contributions
The main contribution of this master's program consisted on applying modern data visualization techniques to network traf c classi cation, namely to the identi cation and classi cation of network attacks. The data visualization technique known as Circos was used within the scope of this work. Data representations of several aspects of network traf c are included in the dissertation from Chapter 3 to Chapter 5, with the main results showing that the classi cation is possible discussed in the later. Though the procedure described herein is completely manual, it shows that by comparing data visualizations from both known and unknown traces, it is possible to classify the unknown ones. It provides a proof of concept, on which it is possible to elaborate in order to produce an automatic classi cation procedure, e.g., combining arti cial intelligence mechanisms with image processing.
The survey over the state-of-the-art in terms of concepts related with visualization of network attacks and the constitution of a large structured dataset of data visualizations using Circos, for contemporary network traf c and for classical attacks, comprise secondary contributions of this work. The study of the state-of-the-art in terms of techniques for data visualization and their applications in network monitoring is the main subject of chapter 2, while the description of the datasets, scripts for building the Circos and samples of the resulting representations are included in chapters 3, 4 and 5. Notice that this work included the identi cation of the most meaningful traf c characteristics, in terms of the output of Circos, and the preparation of the suitable inputs for its packages. Additionally, it was necessary to adapt some functions of the libraries in order for them to support larger inputs.
1.5 Dissertation Overview
This dissertation is organized in six main chapters. The body of this dissertation is constituted by four chapters, preceded by the introductory chapter and succeeded by the conclusions and future work. The contents of each one of the chapters can be summarily described as follows:
de-scribed in this dissertation, as well as the problems and objectives. The adopted approach for solving the problem is also outlined in this chapter, along with main contributions of the underlying research work. The organization of the dissertation is the last subsection in this chapter.
• Chapter 2 - Related Work - contains a discussion on visualizations used for network attacks and a overview of data visualization techniques. It also contains a review of works on this area, with focus on the related works about network attacks and visualizations.
• Chapter 3 Data Visualization Techniques and Datasets contains a description of the visualization techniques used in the scope of this work. The focus is on the visualizations using the so-called Circos technique, explained in detail in an initial section of the chapter. One of the sections of this chapter is dedicated to the description of the datasets using along this work to produce the several visualizations and obtaining the results discussed afterwards.
• Chapter 4 Method and Experimental Setup outlines the technologies and libraries utilized to automate the analysis and produce data visualizations. The ow evolves to the explanation of the procedures used for the analysis of network traf c from the datasets and, at the end of the chapter, some of the most important scripts implemented in the scope of this work are brie y discussed.
• Chapter 5 Analysis of the Results starts by presenting many visualizations for sev-eral legitimate network traf c classes, complementing the set of data representations included in other chapters of the dissertation. Subsequently, it includes the analysis of Circos obtained for classical network based attacks. Towards the end of the chapter, a discussion on how the data visualizations can be used to easily classify some of the attacks and network traf c is included.
• Chapter 6 Conclusions and Future Work is devoted to presenting the main conclu-sions of this dissertation, with the focus on the results obtained, and to pointing out the potential future lines of research.
Chapter 2
Related Work
2.1 Introduction
The community working in computer security, specially intrusion detection, has been actively working on means to visualize and detect attacks, signaling the importance of the visualization aspect in this eld. Data visualization results normally in improved detection, correlation, classi cation and reporting of attacks. This subject, nonetheless, is not that explored yet, though there are several different and interesting approaches in the literature. This chapter is devoted to the description of some of those approaches, namely to some of the most peculiar ones (e.g., one based in a First Person Shooter (FPS) game), which may offer helpful insights to the work presented herein. The data visualization technique used in the scope of this work (Circos) will be described in the following chapter. The discussion is divided into two main parts: section 2.2 presents related works in the speci c topic of network attacks visualization; while section 2.3 presents an overview of other interesting data visualization techniques.
2.2 Related Work on Visualization of Network Attacks
In this section, some publications related to visualization of network attacks and network at-tacks are introduced and summarized. While it is possible to nd numerous publications regard-ing network attacks in scienti c databases, papers on the theme that adds the data visualization keywords are more scarce.
Article [KLS13] describes a visualization technique that analyzes the HTTP headers of requests and their responses to detect and visualize web attacks. In the results are included visualiza-tions of scanning vulnerabilities, password brute force, and position tracking of the attacker. In one of the proposals, the system structure a database of patterns of attacks using SNORT. When an anomaly is detected, an alarm is activated. In the case of the vulnerability be password brute force or scanning is used the 'Nikto', which is a scanning tool to discover vulnerabilities in the server or application. In another test, where attackers insert 'random' text string to perform login, the frequency of requests and the text is saved and may indicate an attempted
attack. The tool includes the striker position display through the use of Google Maps Application Programming Interfaces (APIs), and the position displayed on the world map. The article focuses on the research, visualization and threat detection.
The IDSRadar [ZZF+13] monitors the network using pie charts in real-time using ve categories
of entropy functions to analyze irregular behavior. Summarizes the interactions and ltered possible to detect intruders. First, the Intrusion Detection System (IDS) logs (captured with the SNORT) are stored in a MySQL database, then the IDSRadar reads the data (source IP, destination IP and the types of alerts) in user-de ned time intervals, calculating statistical information on the attacks. Then the IDS presents the alerts and information calculated in graph form. IDSRadar allows to view a variety of information, including the begin of the attacks, and who are the attackers and victims. The IDSRadar is a tool to assist in understanding the IDS alerts and identify abnormal behavior in the network in order to reduce the number of false positives.
Paper [MMB06] presents a port-based display system (Transmission Control Protocol (TCP) and User Datagram Protocol (UDP)) for ef cient identi cation of network and port scan. It also presents some guidelines to incorporate this view in IDS systems. Among other features, the port scans and network scans can usually be readable with the methods presented, despite the limitations of the data collected. You can identify characteristics about safety. The tool used was divided into three levels: high, mid and low-level. At each level the dataset is different. In the high-level is used throughout the dataset, the mid-level displays all the ports in a time interval, and the low-level its possible to visualize a port in any time interval. The approach allows the display patterns at a level, which can go unnoticed on a different level. According to the authors, port scans that occur in a slow manner and with a random order will always be dif cult to detect. However, this problem may be overcome by reducing the dataset. Overall, the tool is able to provide the network status without compromising the network infrastructure.
The authors of [FMK+08] present a system to analyze NetFlow data through a relational database
system. The NetFlow data is interconnected with an IDS alerts to explore suspicious activities on the network. Information is displayed through TreeMap. In the case studies is checked how the tool can be used to highlight the importance of alerts, revealing distributed attacks and analyze the services used in the network. Authors present a NFlowVis system providing an abstract visualization of the entire network and aggregate visualizations of the IDS data for future analysis of the goal, your network traf c, and what are the victim systems. The article uses the combination of TreeMap view a clustering algorithm and Hierarchical Edge Bundle to group information in a meaningful way. The Hierarchical Edge bundle is a exible and generic method that can be used in conjunction with existing visualization techniques tree, allowing users to choose the tree technique, facilitating their integration. This technique reduces the visual clutter when dealing with a large number of edges.
Article [CDK+09] is a survey of the state of the art detection and defense against network
attacks. Due to the increasing development of systems and computer networks, also the number and complexity of threats and vulnerabilities of these systems is increasing, ful lling a major concern of large companies. This evolution makes them more dependent on systems, extending from horizon to attack by malicious individuals, who are also more and more. There are certain attacks that are easy to identify through the network traf c analysis, others are easily detected on the machines that contain the attacked application. The article concludes that its necessary to continue to invest in community analysis of available data, because the attacks continue to evolve. The intrusion detection and network monitoring are the most important ways to approach in the context of security.
The authors of [AH13] propose a real-time NIDS unattended for high-speed networks that work in normal or encrypted communications through the network behavior monitoring. In normal communications, the system own the ability to detect Denial-of-Service (DoS), Distributed De-nial-of-Service (DDoS) attacks or scanning, obtaining a huge amount of data. In encrypted communications, the system lists the traf c of the attackers to discover similarities from previ-ous communications in order to detect possible Bot-Masters. On the lines of future work, the authors report that will still implement your model and test it with traf c samples with differ-ent types of attacks as well as use the model simulations by connecting it to a public network. Your objective is to test it in real-time.
The main objective of the authors of [ECS05] is to identify, in advance, the attacks before they are successful, by monitoring and visualization. Majority systems relating to intruders failure to provide a good view to interpret and generate information. Historically, the visualization techniques are applied to monitoring and analysis of network, mainly for quality and perfor-mance of the network, the individual packets and even email messages, but it does not provide enough details about the attack. In the case of the attacks that are more sophisticated, such as the case of a port-scan camou aged, that will always become more dif cult to detect, display offering allows the accumulation of temporal events for further analysis. The authors suggest that new techniques must be added in order to increase the range of attacks that can be an-alyzed. While this work focuses on the identi cation and analysis of attacks, its necessary to implement the future defense of these attacks.
According to the authors of [vHPBI13], two methodologies were presented in order to test the effects of attacks and defense mechanisms. One approach consists in reproduce the effects via simulation. The second approach is to construct a test bed on which the operating systems and applications are installed and utilized. That last approach allows a more precise analysis. In this paper the authors describe a virtualized testbed network for creating test scenarios attacks and malware detection. This article aims not only to exhibit the ease with which the simulated
traf c can be added to a test network, but also to illustrate the importance of the generated traf c. In a typical network may be easier to detect anomalies, since any increase in traf c could indicate an attack. The simulated traf c is described in this study simulates accurate volumes of a small-scale enterprise, without the use of expensive tools.
In article [NJKJ05], some new visualization techniques are described to deal with the com-plexity of attack graphs. A visual way is introduced that reduces the comcom-plexity and improve the representation. The described techniques may be applied individually or in combination, provide multiple visualizations of the attacks. Each visualization own its strengths, and their combination can be applied to increase its effectiveness. The authors introduced a technique for ltering attacks, restrictions based on a hierarchy that allows the user to navigate the hi-erarchy to interactively control the subset (network) which was attacked. Its also able to link events detected the topology, allowing his exploration to trace and realize the impact of the attack. These techniques can be adapted to other techniques (common) visualizations based on network vulnerabilities and/or detection systems.
The authors of [AJA14] propose an intrusion detection system based on neural networks Time Delay Neural Network (TDNN). In the rst test, the authors compare your system with the SNORT, and conclude that your system has recognized all the attacks described in the article, while the SNORT failed some of these attacks. Its assumed, with new rules SNORT would detect the attacks that have failed. In the second test, with the Defence Advanced Research Projects Agency (DARPA) datasets from MIT, the proposed system was able to recognize once again all attacks with a gear to SNORT. Tests show that the proposed system can detect attacks on different timelines. In the pre-processing phase, relevant features are extracted from various attacks to the neural network, which produces outputs that represent possible attacks.
Paper [SJ14] starts by differentiating External Attack Surface (EAS) Internal Attack Surface (IAS) and Attack Surface Reduction (ASR), and IAS is larger than the EAS. Administrators can usually reduce the EAS, by having access to the entire network and its components, while the attackers necessitate to discover the vulnerabilities of the system. In this article, the authors propose to extend the EAS instead of reducing the IAS, making false vulnerabilities that act as bait for attackers, so that these waste your time on these vulnerabilities, rather than on the real vulnerabilities of the system. The authors discuss three case studies. In Case 1, Expanding Surface Attack through Virtual Identities propose create a number of IPs virtual, modifying them periodically, so that the actual IP system mix the virtual. Case 2, Expanding Attack Surface through Secret Moving Proxy, the authors propose to create many proxies, and only some will be utilized, chosen at random. Case 3, Expanding Attack Surface through Dynamic Virtual Networks, is proposed to constantly modify IP, network topology, control access and routing through a virtualized network, thus producing many false systems, which gives the
possibility to analyze the behavior of the attackers as the administrators attack the virtual components.
Article [KSV07] focuses in three types of attacks: the Partial Completion Attacks, the Attacks That Do Scanning and Bandwidth Attacks. The authors propose a new technique called Partial completion Filters (PCF) to be scalable detection of attacks. In this article, are described the algorithm PCF, their behavior and their use in detection, and demonstrated their effectiveness in various types of attacks mentioned above. It also referred to the importance of network security, and its necessary evolution, as compared to other Internet functions, this is delayed compared to the forwarding, classi cation, Quality of Service (QoS).
Article [LPCB11] is divided into two parts: one dedicated to the private sector and academic research, and the second part focused on the area simulation cyber attacks. In the private and academic part starts by talking about cyber attacks utilizing various network simulation tools and attacks in order to be able to analyze future data. Among these tools are the ARENA, the Real-Time Immersive Network Simulation Environment (RINSE), the SECUSIM, the OPNET and NetEngine. The biggest problem encountered for the applications used in academic research is that does not allow users to realize the impact that the attacks can cause companies or countries. In the public sector, the tools mentioned and produced by government organizations around the world are Simulator Training Exercise Network (SIMTEX) [McB07], the CAAJED [ML08], the Cyber Storm [DoHS15] (I, II and III), DARPA National Cyber Range (NCR) [Age15] and India's Divine Matrix [Sin10]. In this sector, governments have increasingly invested in staff training and the defenses cons various scenarios in cyber security that may happen. In conclusion, there are many efforts to increase the quality of the simulations and better understand the problems of cyber attacks, both private and public level.
In [JPLL09], the authors propose a visual interactive network connection system called NetViewer. This tool is designed in 3D view for representing traf c activities from the network ows and their patterns. The system is based in 3 parts, capture subsystem, database and network security visualization framework. WildPackets and OmniPeek are used to capture subsytem. NetViewer have 3 main interactive methods used: (1) Selection technique, this method make user view the data easily. (2) Filter technique, enables users to change the set of data based on some conditions. (3) Recon guration technique, allow users to change the way data items are arranged in order to provide different perspectives on the dataset. The experiments show that NetViewer can detect DDoS attacks, network scans and port scans.
In [SW04], it is explained how to specify and analyze attack models on the network, making the data input into the tool that generates charts automatically, and analyzes system vulnera-bilities, the authors always refer to the toolkit. The authors created, implemented and tested algorithms to automatically generate chart attacks, to perform different types of analysis of
vulnerabilities that can be found,it also was created a support toolkit to create these graphics. At this point the authors are conducting various types of experiences, from different settings, in different sub-sets to determine different objectives of the attackers. The toolkit was created in two integrated systems, MITRE Corp.'s Outpost and the Lockheed Martin's ANGI.
The authors of [NUCB12] introduced the stereoscopic 3D visual framework called Framework for Rendering Enhanced 3D Stereoscopic Visualizations for Network Security (FRE3DS). This framework utilizes state-of-the-art 3D rendering techniques to assist secure visualizations in applications running over the network. They propose, through the framework, the 3D Stereo-scopic Vulnerability Assessment Tool (3DSVAT) tool, which is an assistant for the rapid detection and correlation of vulnerabilities. The tool provides the monocular and binocular visualizations, which are different visualization levels for improving the administrator experience. This tool is able to perform a quick analysis of the vulnerabilities of data on the network, reduces visual noise, which is detected in some visualizations. The tool also reveals vulnerability characteris-tics in local networks and correlate information between nodes. An example of the visualization produced using 3DSVAT is included in Figure 2.1.
Figure 2.1: Aerial front view visualization produced by 3DSVAT.
The authors of [CGM+13] propose a tool called CyberVis, which combines the icons of traditional
network diagrams with Business Process Modeling and Notation (BPMN). This logic connects the network layer, business processes and tasks, offers a exible framework of support of any of them in intrusion alerts. Instead of lling the user with excessive information, CyberVis abstracted the visual part, to exhibit important information about attacks, and indicates the potential impact on the network and the tasks of the company. The CyberVis was designed in accordance with the guiding lines of the Human Visual System (HVS), resulting in emphasizing of serious attacks, or many small attacks with great impact, and relationship to other components in the visualization. The tool possesses two more functions. Deep-Dive, which allows the use of data, similar to a database interface, and the Forensic Mode, which allows playback (in the style of a lm) of alerts that have passed on user-de ned settings for analysis. Figure 2.2
includes a screenshot of the tool.
Figure 2.2: Screenshot of CyberVis (taken from [CGM+13]).
Visual Firewall, discussed [LTG+05], has 4 implemented views: real-Time traf c, visual
signa-ture, statistics and IDS alarm. These four views provide various levels of detail and temporal information that the system administrator needs to monitor systems in a passive and active manner. Each of the four visualizations, separately, provides speci c details about the network traf c, the ow of packets, transfer rates and suspicious activities. The four perspectives com-bine to form a coherent network status illustration. Figure 2.3 contains an image of one of the views of the Visual Firewall.
Figure 2.3: Real-Time Traf c View of Visual Firewall (taken from [LTG+05]).
The authors of [NAU+13] developed NAVSEC, a visualization module, which is a prototype system
for navigating security visualization tools in a 3D network. The NAVSEC is a tool to reduce the noise that sometimes is included in views, especially for beginners. NAVSEC is illustrated in a case where a probation (scan) attack is disguised in a transfer of les with multiple connections, showing that, when using the tool, even a novice user is able to detect attacks that only experienced users were able to. NAVSEC utilize advanced visualization techniques based on a
database of interaction sequences from a community of experts to improve the experience of a novice user, provide an easy interpretation of the 3D network security, and perform a quick analysis of data network, increasing its ef ciency. Figure 2.4 contains an illustration of what a port scan may look like in NAVSEC.
Figure 2.4: A potential stealthy port scan (taken from [NAU+13]).
The system described in [HA06] contains a 3D game engine that is used to transform network events into game entities. A user of the system is able to control the parts and features of the network that were translated into the game by playing it and interacting with the visual
metaphors that was created. abnormal behaviors are targets for the players (administrators)
that may resort to in-game weapons or actions, such as shooting or cure, to ght the threats and defend the network. These actions are translated back to appropriate network operations (for example, update the access control in the rewall). The orthogonal visual metaphors are actually embedded features with particular functions (e.g., detecting abnormal behavior on the network) and characteristics learned from network monitoring activities and NIDSs.
Administra-Figure 2.5: Virtual representation of the greynets with 25 addresses (taken from [HA06]).
tors can trigger (gun), heal (syringe) and adapt (pliers). These tools allow a user to interact with the virtual environment and, at the same time, make changes in real time to the network.
Shooting puts access control lists on the rewall, the pliers allows restrictions on bandwidth and heal undo operations. Figure 2.5 shows a virtual representation of the 3D game engine.
This article [CA04] examines visual ngerprints forgotten in several popular attack tools to bet-ter understand the methods used by the attackers, as well as the characbet-teristics that identify these tools. These techniques are applied by attacker in a passive and virtually undetectable manner. This research explores various applications of visualization techniques and their useful-ness to identify the tools utilized by attackers without the typical IDSs. The results demonstrate that these popular tools can be easily detected by passively snif ng and representing the result-ing data with appropriate views. A major concern is that some tools, like NMAP, are extremely
exible, and experienced users can build attacks that trick this system. The visualization pro-duced by passive visual ngerprint is shown in Figure 2.6.
Figure 2.6: Passive Visual Fingerprinting for the information ow starting at the external IP, passing to the external port, then to the internal port, and nally to the internal IP (taken from [CA04]).
Riad et al. [REHA11] present a new framework with a visualization technique for the analysis of data coming from SNORT. This framework utilizes Hypertext Preprocessor (PHP) and Cascading Style Sheets (CSS) to accomplish its objectives. The intrusion detection is an intensive process and can not be performed without the aid of a computer. It is necessary to analyze poten-tially large amounts of data in real-time to be able to report abnormal use of networks and systems. The proposed framework creates bar charts from traf c, dividing the bars by proto-cols. The framework was proven effective to visualize intrusions detected by a SNORT system. A screenshot of the framework during execution is shown in Figure 2.7.
The authors of [HLH11] propose a research tool based on gestures named Real-time Attack Vi-sualization Environment (RAVEN). It offers analysis features combined with a graphical environ-ment for multiple users. Initially, the tool was designed to generate graphical representations of attacks and was later integrated in an IDS with improved visualization techniques and inter-action, and adapted to the network model University of Tulsa. The architecture includes four
Figure 2.7: Screenshot of the framework developed by Riad et al. [REHA11].
main components: (i) the acquisition of the model, (ii) creation of attack graphs, (iii) visual-ization and (iv) analysis. RAVEN was proven to be an effective platform to assess the impact of technical Humam-Computer Interaction (HCI) on the analysis of graphs concerning attacks. RAVEN requires the network system to be analyzed to be modeled rst. Only then, the system is ready to start producing the network visualizations and perform analysis. Each component of the visualization has a different colored badge, denoting the level of risk associated with each condition. It was argued that these visualizations are suitable to be used in professional envi-ronments after minor improvements. Figure 2.8 contains an image illustrating the dependency graph produced by RAVEN.
Figure 2.8: Attack dependency graph outputted by RAVEN (taken from [HLH11]).
2.3 Interesting Data Visualization Techniques
This section presents some contemporary data visualization techniques used in other areas of knowledge. It is interesting and sometimes inspiring to see how researchers create or adapt (known) techniques for their own purpose. The included data representations are amongst those that the author thinks that better transmit the objective of a good visualization technique, notably the ability to emphasize details and help learn novel facts from the data.
Figure 2.9: Representation for any mention of the word God in the Bible (taken from [Ein14]).
The rst chart (Figure 2.9) of this section is a bar chart with an unusual amount of bars. In order to create the chart, the author represented the length of all verses of the Bible as bars, to then connect the word God to all of the places where it was found in this lengthy classical text. The result is a beautiful image, where the apparently Gaussian nature of several parts of the Bible are emphasized. In many sections of the chart, it is possible to see what seems like to be Gaussian noise. The several books composing the Bible are also seen in the gure. The word God, with uppercase G, was found 4,500 times.
Figure 2.10: Representation for any Edible or Medical plant (taken from [Tul14]).
Figure 2.10 visually represents various types of plants. Plants can be edible, medicinal, or of other use for humans. The image shows the names/types of the edible plants and, on the left side, it shows the respective medical usefulness. In case more than 50 plants are connected to a feature, this feature is highlighted in the representation, in a directly proportional manner,
resulting in a very expressive highlight of the best edible plants which, in this case, are the leaves and fruits. The diuretic effect is the medicinal effect easier to achieve.
Figure 2.11: Representation of an interactive graphic to visualize an online repository for scienti c research papers (taken from [DG13]).
Figure 2.11 is composed by two screenshots of the interactive graphic known as Paperscape [DG13]. Paperscape is an online repository for scienti c research papers. The upper screenshot shows constellations named after the areas in which the several papers orbit. As one zooms into the gure, the sub-areas come into focus. At the end, several large or smaller circles populate the screen, whose size is directly proportional to the importance of the paper they represent in that speci c eld. he larger the circle, the more relevant the paper is, since the size is related with the number of citations of that paper.
Figure 2.12 contains a graphical representation of the the organization of Wikipedia in terms of categories, subcategories and articles. The representation is superb in emphasizing the subdivisions and the number of articles at the edges. For example, according to this chart, 2,424,305 Wikipedia articles are about people.
Figure 2.12: Representation of just over 10 million Wikipedia articles divided into categories(adapted from [PAC14]).
2.4 Conclusions
This chapters discussed some of the works in the specialized literature using different visu-alization techniques to model networks, represent traf c and attacks, and even manage the infrastructure and systems. The discussion shows that many researchers contributed to the development of new, and sometimes exquisite, techniques for different types of visualizations, also recognizing the importance it may have for the complex computer networking scenario. In spite of these efforts, there is still room for research and development in this eld, namely in the network traf c monitoring and intrusion detection topics. From the analysis, and given the dynamic nature of the subjects at hands (computer networks and attacks), it can be concluded that it is important to constantly try to nd new means that help minimize damage, categorize traf c and threats and help maintain increasingly large networks.
It is possible to nd both 2 Dimensions (2D) and 3D data visualization techniques applied to network traf c monitoring, analysis and administration, as well as intrusion detection. Some of these techniques were developed under the assumption that they could ease the process of detecting attacks, for example for novices in the area. One proposal is based on translating the network administration into a FPS, which is uncommon, but proves that imagination may also be helpful in this area. Most works end proving that different data visualization techniques are useful to emphasize some aspects of the attacks, many times easing the process of detecting them.
This chapter provides a more detailed context to this master's program, enabling to better position this work and also justify its motivation. The next chapters can now be focused on the experimental part of the work, starting from the description of the visualization technique and
![Figure 2.7: Screenshot of the framework developed by Riad et al. [REHA11].](https://thumb-eu.123doks.com/thumbv2/123dok_br/18041771.862215/40.892.108.787.105.267/figure-screenshot-framework-developed-riad-et-al-reha.webp)
![Figure 2.11: Representation of an interactive graphic to visualize an online repository for scienti c research papers (taken from [DG13]).](https://thumb-eu.123doks.com/thumbv2/123dok_br/18041771.862215/42.892.150.701.210.726/figure-representation-interactive-graphic-visualize-repository-scienti-research.webp)