Validation of the Martin Method for
Estimating Low-Density Lipoprotein
Cholesterol Levels in Korean Adults: Findings
from the Korea National Health and Nutrition
Examination Survey, 2009-2011
Jongseok Lee1, Sungok Jang1,2, Heejeong Son3*
1School of Business Administration, Hallym University, Chuncheon, Korea,2Korea Association of Health Promotion Gwangju-Jeonnam Branch, Gwangju, Korea,3Department of Anesthesiology, Kangwon National University School of Medicine, Chuncheon, Korea
Abstract
Despite the importance of accurate assessment for low-density lipoprotein cholesterol (LDL-C), the Friedewald formula has primarily been used as a cost-effective method to esti-mate LDL-C when triglycerides are less than 400 mg/dL. In a recent study, an alternative to the formula was proposed to improve estimation of LDL-C. We evaluated the performance of the novel method versus the Friedewald formula using a sample of 5,642 Korean adults with LDL-C measured by an enzymatic homogeneous assay (LDL-CD). Friedewald LDL-C
(LDL-CF) was estimated using a fixed factor of 5 for the ratio of triglycerides to
very-low-den-sity lipoprotein cholesterol (TG:VLDL-C ratio). However, the novel LDL-C (LDL-CN)
esti-mates were calculated using the N-strata-specific median TG:VLDL-C ratios, LDL-C5and
LDL-C25from respective ratios derived from our data set, and LDL-C180from the 180-cell
table reported by the original study. Compared with LDL-CF, each LDL-CNestimate
exhib-ited a significantly higher overall concordance in the NCEP-ATP III guideline classification with LDL-CD(p<0.001 for each comparison). Overall concordance was 78.2% for LDL-CF,
81.6% for LDL-C5, 82.3% for LDL-C25, and 82.0% for LDL-C180. Compared to LDL-C5,
LDL-C25significantly but slightly improved overall concordance (p= 0.008). LDL-C25and
LDL-C180provided almost the same overall concordance; however, LDL-C180achieved superior
improvement in classifying LDL-C<70 mg/dL compared to the other estimates. In subjects with triglycerides of 200 to 399 mg/dL, each LDL-CNestimate showed a significantly higher
concordance than that of LDL-CF(p<0.001 for each comparison). The novel method offers
a significant improvement in LDL-C estimation when compared with the Friedewald formula. However, it requires further modification and validation considering the racial differences as well as the specific character of the applied measuring method.
a11111
OPEN ACCESS
Citation:Lee J, Jang S, Son H (2016) Validation of the Martin Method for Estimating Low-Density Lipoprotein Cholesterol Levels in Korean Adults: Findings from the Korea National Health and Nutrition Examination Survey, 2009-2011. PLoS ONE 11(1): e0148147. doi:10.1371/journal.pone.0148147
Editor:Alberto G Passi, University of Insubria, ITALY
Received:September 3, 2015
Accepted:January 13, 2016
Published:January 29, 2016
Copyright:© 2016 Lee et al. This is an open access article distributed under the terms of theCreative Commons Attribution License, which permits unrestricted use, distribution, and reproduction in any medium, provided the original author and source are credited.
Data Availability Statement:All relevant data are within the paper and its Supporting Information files. Additional data are available from thehttps://knhanes. cdc.go.kr/knhanes/index.do.
Introduction
Because low-density lipoprotein cholesterol (LDL-C) is a major modifiable risk factor for car-diovascular disease (CVD) [1], its accurate assessment is important for therapeutic decisions. In routine clinical practice worldwide, it is typically calculated using the Friedewald formula [2]. In the Korea National Health Screening Program (KNHSP), LDL-C is calculated but not directly measured when triglyceride levels are lower than 400 mg/dL. Of 11,380,246 partici-pants who examined their triglyceride levels in the 2013 KNHSP, there were 11,143,810 per-sons (98%) with triglyceride levels under 400 mg/dL [3], implying that LDL-C was directly measured for only 2% of the participants. From the outset, the formula’s inaccuracies at triglyc-eride levels400 mg/dL were recognized by Friedewald et al. [4]. However, even when triglyc-eride levels are under 400 mg/dL, a number of studies have suggested that LDL-C estimates by the formula (LDL-CF) underestimate LDL-C and thus misclassify CVC risk [5–8], particularly in individuals with high levels of triglycerides [5–7] and LDL-C less than 70 mg/dL [8].
In a recent study by Martin et al. [9], an alternative to the Friedewald formula was proposed to improve estimation of LDL-C at triglyceride levels under 400 mg/dL. The Friedewald equa-tion calculates LDL-C as LDL-CF= [total cholesterol]–[high-density lipoprotein cholesterol (HDL-C)]–[triglycerides / 5], where the final term is the estimate of very-low-density lipopro-tein cholesterol (VLDL-C). This equation therefore uses a fixed factor of 5 for the ratio of tri-glycerides to VLDL-C (TG:VLDL-C); however, the Martin equation applies an adjustable factor determined as the N-strata-specific median TG:VLDL-C ratio based on triglyceride and non-HDL-C concentrations to estimate the novel LDL-C (LDL-CN). Compared with LDL-CF, LDL-CNwas reported to be closer to directly measured LDL-C (LDL-CD) and improved con-cordance in guideline risk classification with LDL-CD, especially at LDL-C less than 70 mg/dL.
For adoption of the novel method, external validation is required in independent popula-tions based on various races and the use of other laboratory techniques. Martin et al. [9] derived the strata-specific TG:VLDL-C ratios using a large cohort of United States patients with LDL-C measured by the vertical auto profile (VAP) method. To our knowledge, none have validated the Martin equation in a Korean population. We therefore evaluated the perfor-mance of the LDL-CNestimation method using an independent sample, nationally representa-tive data from the Korea National Health and Nutrition Examination Survey (KNHANES) conducted from 2009 through 2011, in which LDL-C was directly measured by an enzymatic homogenous assay.
Materials and Methods
This study was reviewed and approved by the Kangwon National University Hospital’s institu-tional review board (KNUH-2015-07-012). The Korea center of Disease Control and Preven-tion received the informed consent from all participants. The data are publicly available in website [https://knhanes.cdc.go.kr/knhanes/index.do].
Study population
This study was performed using data from the 2009–2011 KNHANES[10,11]. The KNHANES is a nationwide, population-based, cross-sectional survey conducted by the Korean Center for Disease Control and Prevention since 1998. This survey used a stratified, multistage, clustered probability sampling method to select a representative sample of the non-institutional, civilian Korean population. All participants in this survey provided written informed consent.
The number of KNHANES participants was 10,533 in 2009; 8,958 in 2010; and 8,518 in 2011. Among those who participated in the survey, this study included 5,790 adults aged 20 years and older who completed examination of total cholesterol, HDL-C, triglycerides, and Competing Interests:The authors have declared
LDL-CD. Additionally, 198 subjects with triglyceride levels of 400 mg/dL and higher were excluded, leaving 5,642 subjects (2,723 males and 2,919 females) for the main analysis. The number of subjects by year was as follows: 1,881 in 2009; 1,867 in 2010; and 1,894 in 2011.
Measurements and Estimations
Blood samples were drawn from the antecubital vein of each subject the morning after fasting for at least 8 hours. Serum lipid concentrations were directly measured by an enzymatic method using an automated analyzer (Hitachi Automatic Analyzer 7600, Hitachi, Tokyo, Japan), including measurements of total cholesterol (Pureauto S CHO-N; Sekisui Medical, Tokyo, Japan), HDL-C (Cholestest N HDL; Sekisui Medical), and triglycerides (Pureauto S TG-N; Sekisui Medical). Serum LDL-C concentrations (LDL-CD) were directly measured using an enzymatic homogenous assay with Cholestest-LDL (Sekisui Medical). Non-HDL-C was cal-culated by subtracting HDL-C from total cholesterol. VLDL-C was calcal-culated using the follow-ing subtraction equation: VLDL-C = [non-HDL-C]–[LDL-CD].
LDL-CFwas estimated as [non-HDL-C]–[triglycerides / 5] [4]. LDL-C180was calculated as [non-HDL-C]–[triglycerides / AF], where AF is an adjustable factor in the 180-cell table described by Martin et al. [9]. In addition, two LDL-CNestimates were calculated using strata-specific TG:VLDL-C ratios derived from our data set: LDL-C5based on 5 strata of triglycerides and LDL-C25based on 25 strata of triglyceride and non-HDL-C levels.
Statistical analysis
The data were analyzed using SPSS for Windows (version 21.0; SPSS Inc., Chicago, IL, USA). All statistical outcomes were based on two-sided tests, and ap-value less than 0.05 was consid-ered statistically significant. Data are summarized as median and range for continuous vari-ables, and frequency and percentage for categorical variables. To compare the two triglyceride groups (subjects with triglycerides400 mg/dL and those with>400 mg/dL), the median test
was used for continuous variables, and Fisher’s exact test was used for categorical variables. Multiple regression analysis was performed to investigate the extent to which VLDL-C was explained by triglycerides, non-HDL-C, HDL-C, and age.
When triglyceride levels were lower than 400 mg/dL, the Wilcoxon signed rank test was conducted to examine the difference between each estimated LDL-C and LDL-CDvalue, and to determine whether LDL-CNestimates more closely approximated LDL-CDcompared with LDL-CF. The median test was used to compare the median TG:VLDL-C ratios among five strata based on triglyceride levels. One-way analysis of variance (ANOVA) was performed for multiple comparison of the mean VLDL-C: TG ratios among the triglyceride strata.
Directly measured and estimated LDL-C values were classified according to the National Cholesterol Education Program Adult Treatment Panel III (NCEP-ATP III) guideline cutoffs [1] of 70, 100, 130, 160, and 190 mg/dL. Concordance in classification between LDL-C esti-mates and LDL-CDwas examined through cross-tabulations by LDL-C categories in subjects with triglycerides lower than 400 mg/dL. McNemar’s exact test for correlated proportions was performed to compare overall concordance between LDL-C estimates.
Results
male]. In this triglyceride group, the median TG:VLDL-C ratio was 4.9, the IQR was 3.7–6.1, the 5th to 95th percentile was 2.3 to 8.4, the 1st to 99th percentile was 1.6 to 11.5, and the full range was 0.6 to 285.7.
Fig 1illustrates the relationship between triglyceride and VLDL-C values. When triglyceride levels are lower than 400 mg/dL, triglycerides explained 62.3% of the variance in VLDL-C. Adding non-HDL-C as an independent variable, as shown in Model 1 ofTable 2, the explained proportion of the variance increased slightly to 64.4%. In this model, triglycerides had a partial R2value of (0.733)2= 0.537, whereas that of non-HDL-C was (0.263)2= 0.069, implying that triglycerides accounted for 7.8 times more of the variance than did non-HDL-C. Controlling for non-HDL-C, HDL-C, and age in Model 2 ofTable 2, triglycerides and VLDL-C showed a relatively strong relationship (partialR= 0.748) compared to the other independent variables.
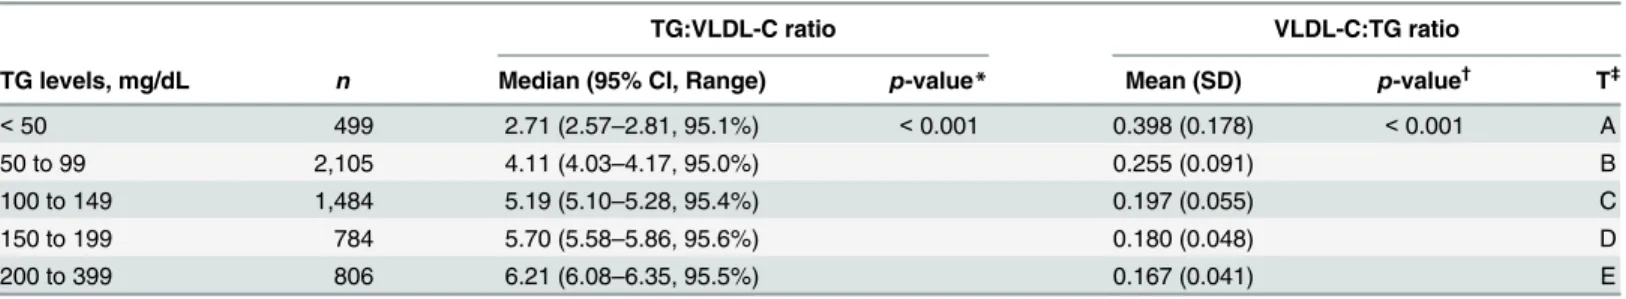
For stratification, we first used only triglycerides and then added non-HDL-C to capture each performance of the two parameters in improving LDL-C estimation. Based on strata of triglycerides, the 5-cell table is shown inTable 3. The median TG:VLDL-C ratio was signifi-cantly different among triglyceride groups (p<0.001) and increased as triglyceride levels went
up. The median TG:VLDL-C ratio of each triglyceride strata ranged from 2.71 to 6.21.The 25-cell table, based on strata of triglyceride and non-HDL-C values, is shown inTable 4. For the same triglyceride group, the median TG:VLDL-C ratio generally decreased as non-HDL-C levels increased.
To generate LDL-CNestimates, the strata-specific median TG: VLDL-C ratios were applied in subjects of our data set with triglyceride levels under 400 mg/dL. That is, the 5-cell table (Table 3) was used for LDL-C5, the 25-cell table (Table 4) for LDL-C25, and the 180-cell table described by Martin et al. [9] for LDL-C180. Comparing each estimated LDL-C and LDL-CD value by the 5 strata of triglyceride levels using the Wilcoxon signed rank test (seeS1through
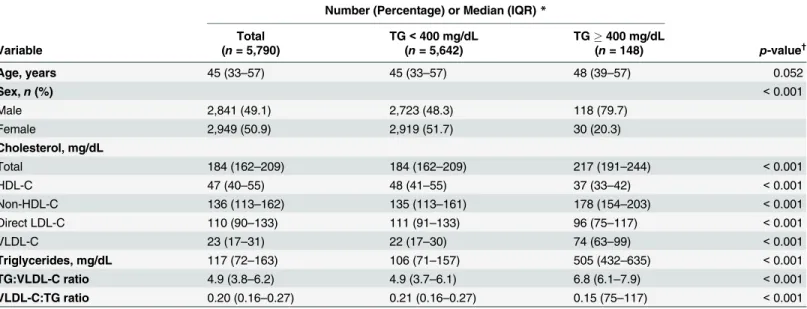
Table 1. Characteristics of the study population by triglyceride strata.
Number (Percentage) or Median (IQR)*
Total TG<400 mg/dL TG400 mg/dL
Variable (n= 5,790) (n= 5,642) (n= 148) p-value†
Age, years 45 (33–57) 45 (33–57) 48 (39–57) 0.052
Sex,n(%) <0.001
Male 2,841 (49.1) 2,723 (48.3) 118 (79.7)
Female 2,949 (50.9) 2,919 (51.7) 30 (20.3)
Cholesterol, mg/dL
Total 184 (162–209) 184 (162–209) 217 (191–244) <0.001
HDL-C 47 (40–55) 48 (41–55) 37 (33–42) <0.001
Non-HDL-C 136 (113–162) 135 (113–161) 178 (154–203) <0.001
Direct LDL-C 110 (90–133) 111 (91–133) 96 (75–117) <0.001
VLDL-C 23 (17–31) 22 (17–30) 74 (63–99) <0.001
Triglycerides, mg/dL 117 (72–163) 106 (71–157) 505 (432–635) <0.001
TG:VLDL-C ratio 4.9 (3.8–6.2) 4.9 (3.7–6.1) 6.8 (6.1–7.9) <0.001
VLDL-C:TG ratio 0.20 (0.16–0.27) 0.21 (0.16–0.27) 0.15 (75–117) <0.001
IQR indicates interquartile range; TG, triglyceride; HDL-C, high-density lipoprotein cholesterol; Direct LDL-C, low-density lipoprotein cholesterol measured by the enzymatic homogeneous assay; VLDL-C, very low-density lipoprotein cholesterol; TG:VLDL-C ratio, ratio of TG to VLDL-C; VLDL-C:TG ratio, ratio of VLDL-C to TG.
*Data are expressed as medians (IQR) for continuous variables and frequencies (percentages) for categorical variables.
†Statistical signi
ficance was assessed using Fisher’s exact test or median test.
S4Tables), LDL-CFsignificantly overestimated LDL-CDat triglyceride levels under 100 mg/dL (p<0.001) while LDL-CFunderestimated LDL-CDat triglyceride levels of 100–399 mg/dL (p<
0.001). LDL-C5and LDL-C25did not significantly underestimate or overestimate LDL-CDat any triglyceride level; however, LDL-C180significantly overestimated LDL-CDat all triglyceride levels (p<0.001). At triglyceride levels under 400 mg/dL, LDL-CNestimates were closer overall
to LDL-CDthan LDL-CFestimates (p<0.001 for each comparison, seeS5 Table). The median for (LDL-CF)–(LDL-CD) was 0.6 mg/dL (IQR, -5.1 to 5.7; 5th-95th percentile, -15.2 to 13.5). Examining LDL-CN−LDL-CD, the median was 0.0 mg/dL (IQR, -4.2 to 4.5; 5th-95th percentile, -9.9 to 13.2) for LDL-C5, 0.0 mg/dL (IQR, -4.1 to 4.4; 5th-95th percentile, -10.0 to 12.3) for LDL-C25, and 1.5 mg/dL (IQR, -2.5 to 5.9; 5th-95th percentile, -8.1 to 14.0) for LDL-C180.
Fig 1. Relationship between triglyceride and very low-density lipoprotein cholesterol levels(VLDL-C indicates very low-density lipoprotein cholesterol; TG, triglyceride).The dark right-upward line represents the values of triglycerides divided by 5, the estimates of VLDL-C used in the Friedewald formula. If the true VLDL-C value is greater than the triglycerides/5 value (dots above the line), then the Friedewald equation will tend to underestimate VLDL-C, and vice versa if the true VLDL-C is less than the triglycerides/5 (dots below the line). Overall, the Friedewald formula showed a tendency to overestimate VLDL-C and thus underestimate LDL-C as triglyceride levels increased. The broken line displays the fitted regression of triglycerides on VLDL-C when triglyceride levels are lower than 400 mg/dL.
Table 2. Multiple regression results using very low-density lipoprotein cholesterol (VLDL-C) as the dependent variable in 5642 Korean adults aged 20 to 87 years with triglyceride concentrations<400 mg/dL.
Model Dependent variable: VLDL-C
Independent variable b (95% CI) p-value R PartialR AdjustedR2
Model 1 0.644
Triglycerides, mg/dL 0.120 (0.117, 0.123) <0.001 0.789 0.733
Non-HDL-C, mg/dL 0.055 (0.049, 0.061) <0.001 0.480 0.263
Constant 2.467 (1.710, 3.225) <0.001
Model 2 0.680
Triglycerides, mg/dL 0.129 (0.126, 0.132) <0.001 0.789 0.748
Non-HDL-C, mg/dL 0.045 (0.039, 0.050) <0.001 0.480 0.200
HDL-C, mg/dL 0.188 (0.170, 0.206) <0.001 -0.181 0.267
Age, years 0.120 (0.090, 0.115) <0.001 0.312 0.208
Constant -11.012 (-12.305, -9.718) <0.001
HDL-C indicates high-density lipoprotein cholesterol;b, unstandardized coefficient; CI, confidence level;R, zero-order correlation; PartialR, partial correlation.
doi:10.1371/journal.pone.0148147.t002
Table 3. Median for the ratio of triglycerides to very low-density lipoprotein cholesterol by triglyceride strata (5-cell).
TG:VLDL-C ratio VLDL-C:TG ratio
TG levels, mg/dL n Median (95% CI, Range) p-value* Mean (SD) p-value† T‡
<50 499 2.71 (2.57–2.81, 95.1%) <0.001 0.398 (0.178) <0.001 A
50 to 99 2,105 4.11 (4.03–4.17, 95.0%) 0.255 (0.091) B
100 to 149 1,484 5.19 (5.10–5.28, 95.4%) 0.197 (0.055) C
150 to 199 784 5.70 (5.58–5.86, 95.6%) 0.180 (0.048) D
200 to 399 806 6.21 (6.08–6.35, 95.5%) 0.167 (0.041) E
TG indicates triglyceride; VLDL-C, very low-density lipoprotein cholesterol; TG:VLDL-C ratio, ratio of TG to VLDL-C; VLDL-C:TG ratio, ratio of VLDL-C to TG; CI, confidence interval; SD, standard deviation.
*P-value for median comparison among TG groups was calculated by median test.
†
P-value for mean comparison among TG groups was calculated by one-way analysis of variances.
‡
The same letters indicate non-significant difference between groups (α= 0.05) on Tamhane’s multiple comparison test.
doi:10.1371/journal.pone.0148147.t003
Table 4. Median for the ratio of triglycerides to very low-density lipoprotein cholesterol by non-high-density lipoprotein cholesterol and triglyceride strata (25-cell).
Non-HDL-C, mg/dL
TG levels, mg/dL <100 100 to 129 130 to 159 160 to 189 190
<50 2.8 2.7 2.5 2.7 2.1
50 to 99 4.2 4.2 4.0 3.9 3.8
100 to 149 5.5 5.5 5.1 4.9 4.5
150 to 199 6.3 6.1 5.9 5.5 4.9
200 to 399 7.1 6.7 6.4 6.2 5.5
TG indicates triglyceride; HDL-C, high-density lipoprotein cholesterol.
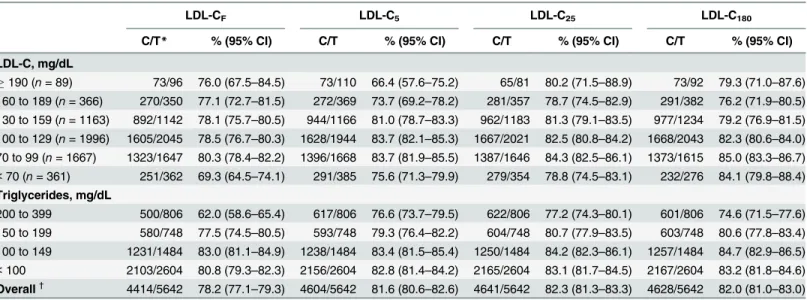
Table 5shows concordances in the NCEP-ATP III guideline classification between LDL-C estimates and LDL-CDand between LDL-C estimates when triglyceride levels are lower than 400 mg/dL. Compared with LDL-CF, LDL-CNestimates exhibited a significantly higher overall concordance (p<0.001 for each comparison). In subjects with triglyceride levels of 200 to 399
mg/dL, LDL-CNestimates showed significantly higher concordances than those of LDL-CF estimates (p<0.001 for each comparison). In particular, LDL-C25provided a significantly
higher concordance than LDL-C180(p= 0.026). In other triglyceride categories, LDL-CN esti-mates incrementally improved concordance compared with LDL-CF.
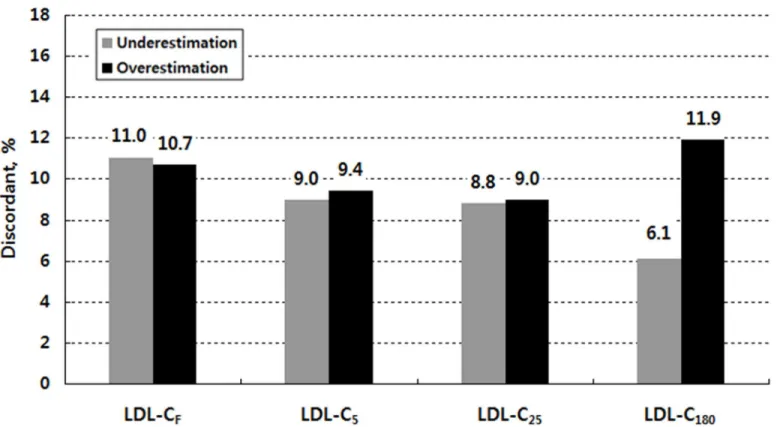
Fig 2shows overall discordance in the NCEP-ATP III guideline classification by LDL-C esti-mate when triglyceride levels are lower than 400 mg/dL. Within the misclassified subjects, there were two groups: those who were classified in a lower category and those who were classi-fied in a higher category compared with their LDL-CDcategory (seeS6 Table). When we referred to the former as underestimated and the latter as overestimated in their LDL-C catego-ries, the number of underestimated subjects was similar to that of the overestimated subjects for LDL-CF, LDL-C5, and LDL-C25: 623 underestimated subjects (11.0%) versus 605 overesti-mated subjects (10.7%) for LDL-CF; 509 subjects (9.0%) versus 529 subjects (9.4%) for LDL-C5; and 495 subjects (8.8%) versus 506 subjects (9.0%) for LDL-C25. For LDL-C180, however, the number of overestimated subjects was about two times larger than that of the underestimated subjects; 672 subjects (11.9%) were classified in a higher category, but 342 subjects (6.1%) were classified in a lower category.
Discussion
We compared the performance of the novel method and the Friedewald formula on estimating LDL-C using a sample of 5,642 Korean adults with LDL-C measured by the enzymatic homog-enous assay. As novel estimates, LDL-C5and LDL-C25were calculated using the strata-specific
Table 5. Concordance in the NCEP-ATP III guideline classification by Friedewald vs. novel estimates of low-density lipoprotein cholesterol (LDL-C) in relation to direct LDL-C when triglycerides are lower than 400 mg/dL.
LDL-CF LDL-C5 LDL-C25 LDL-C180
C/T* % (95% CI) C/T % (95% CI) C/T % (95% CI) C/T % (95% CI)
LDL-C, mg/dL
190 (n= 89) 73/96 76.0 (67.5–84.5) 73/110 66.4 (57.6–75.2) 65/81 80.2 (71.5–88.9) 73/92 79.3 (71.0–87.6) 160 to 189 (n= 366) 270/350 77.1 (72.7–81.5) 272/369 73.7 (69.2–78.2) 281/357 78.7 (74.5–82.9) 291/382 76.2 (71.9–80.5) 130 to 159 (n= 1163) 892/1142 78.1 (75.7–80.5) 944/1166 81.0 (78.7–83.3) 962/1183 81.3 (79.1–83.5) 977/1234 79.2 (76.9–81.5) 100 to 129 (n= 1996) 1605/2045 78.5 (76.7–80.3) 1628/1944 83.7 (82.1–85.3) 1667/2021 82.5 (80.8–84.2) 1668/2043 82.3 (80.6–84.0) 70 to 99 (n= 1667) 1323/1647 80.3 (78.4–82.2) 1396/1668 83.7 (81.9–85.5) 1387/1646 84.3 (82.5–86.1) 1373/1615 85.0 (83.3–86.7)
<70 (n= 361) 251/362 69.3 (64.5–74.1) 291/385 75.6 (71.3–79.9) 279/354 78.8 (74.5–83.1) 232/276 84.1 (79.8–88.4) Triglycerides, mg/dL
200 to 399 500/806 62.0 (58.6–65.4) 617/806 76.6 (73.7–79.5) 622/806 77.2 (74.3–80.1) 601/806 74.6 (71.5–77.6) 150 to 199 580/748 77.5 (74.5–80.5) 593/748 79.3 (76.4–82.2) 604/748 80.7 (77.9–83.5) 603/748 80.6 (77.8–83.4) 100 to 149 1231/1484 83.0 (81.1–84.9) 1238/1484 83.4 (81.5–85.4) 1250/1484 84.2 (82.3–86.1) 1257/1484 84.7 (82.9–86.5)
<100 2103/2604 80.8 (79.3–82.3) 2156/2604 82.8 (81.4–84.2) 2165/2604 83.1 (81.7–84.5) 2167/2604 83.2 (81.8–84.6) Overall†
4414/5642 78.2 (77.1–79.3) 4604/5642 81.6 (80.6–82.6) 4641/5642 82.3 (81.3–83.3) 4628/5642 82.0 (81.0–83.0)
LDL-C indicates low-density lipoprotein cholesterol; LDL-CF, Friedewald LDL-C; LDL-C5, 5-cell method LDL-C; LDL-C25, 25-cell method LDL-C; LDL-C180, 180-cell method LDL-C (Martin et al. [9]); C/T, concordant number / total number; CI, confidence interval.
*Initial classification was defined by the LDL-C estimates: concordance was determined according to direct LDL-C.
†
P-value for difference in overall concordance rates between LDL-CFand each LDL-CNestimate isp<0.001.
median TG:VLDL-C ratios derived from our data set, together with LDL-C180using the 180-cell table described by Martin et al. [9]. Each of these LDL-CNestimates was significantly more similar to LDL-CDthan LDL-CFin subjects with triglyceride levels lower than 400 mg/dL (p<0.001 for each comparison).
To estimate LDL-C, the novel method uses an adjustable factor for the TG:VLDL-C ratio according to triglyceride and non-HDL-C levels, whereas the Friedewald equation applies a fixed factor of 5. Some previous studies [12–14] have attempted to determine an optimal fixed factor. For example, DeLong et al. [12] and Puavilai et al. [13] suggested a higher fixed factor of 6 instead of 5 while Hata and Nakajima [14] proposed a lower fixed factor of 4. However, the overall median TG:VLDL-C ratio of 4.9 in our sample is closer to the original Friedewald factor of 5. In contrast, McNamara et al. [15] found that the optimal factor varied by triglyceride level and suggested different factors based on triglyceride values: 4 for triglyceride levels50 mg/ dL, 4.5 for levels of 51–200 mg/dL, and 5 for levels of 201–400 mg/dL. Compared with the McNamara method, the novel method extends its basis for applying the strata-specific TG: VLDL-C ratios from triglycerides to non-HDL-C values. Considering the broken line inFig 1, the novel method is assumed to be useful for the more correct estimation of LDL-C in Korean people.
In this study, we first generated LDL-C5based on only triglyceride strata. The median TG: VLDL-C ratio was significantly different among triglyceride strata (p<0.001) and increased as
triglyceride levels went up (Table 3), which is similar to the findings of McNamara et al. [15]. Next, we generated LDL-C25based on the 25 strata of triglyceride and non-HDL-C levels. For the same triglyceride group, the median TG:VLDL-C ratio roughly decreased as non-HDL-C
Fig 2. Overall discordance (underestimation vs. overestimation) in the NCEP-ATP III guideline classification by low-density lipoprotein cholesterol (LDL-C) estimate when triglycerides are lower than 400 mg/dL.LDL-C indicates low-density lipoprotein cholesterol; LDL-CF, Friedewald LDL-C; LDL-C5, 5-cell method LDL-C; LDL-C25, 25-cell method LDL-C; LDL-C180, 180-cell method LDL-C (Martin et al. [9])
levels increased (Table 4), as in the 180-cell table of Martin et al. [9]. However, we were able to observe a difference between the median TG: VLDL-C ratio of LDL-C25and that of LDL-C180 at triglyceride levels less than 50mg/dL, with ranges from 2.1 to 2.8 versus ranges from 3.1 to 3.5 for LDL-C25and LDL-C180, respectively. Wang et al. [16] suggested that, similar to high TG levels, low TG levels affect LDL-CF, resulting in overestimation. They attributed this to a low-fat, low-protein diet. Considering the carbohydrate-oriented dietary life pattern of Koreans, their lipid profile may differ from that of Westerners.
The majority of previous studies have suggested that the Friedewald formula underestimates directly measured LDL-C [5–8]. In our sample, LDL-CFsignificantly underestimated LDL-CD at levels of 100–399 mg/dL, but significantly overestimated LDL-CDat triglyceride levels under 100 mg/dL. On the other hand, LDL-C180significantly overestimated LDL-CDfor the entire tri-glyceride range.LDL-C5and LDL-C25did not show any tendency of over/underestimation.
Compared with LDL-CF, each of the LDL-CNestimates exhibited a significantly higher overall concordance with LDL-CDin the NCEP-ATP III guideline classification (p<0.001 for each comparison). Overall concordance was 78.2% for LDL-CF, 81.6% for LDL-C5, 82.3% for LDL-C25, and 82.0% for LDL-C180(Table 5). Compared with LDL-C5, LDL-C25significantly improved overall concordance (p= 0.008). LDL-C25and LDL-C180provided almost the same overall concordance. In comparison to the overall concordance of 85.4% for LDL-CFversus 91.7% for LDL-C180(p<0.001) reported by Martin et al. [9], LDL-CFand LDL-C180in our sample have shown relatively low overall concordance with LDL-CD. Meeusen et al. [17] found that overall concordance was similar to that of our results as 76.9% [95% CI, 75.2–79.4] for LDL-CFversus 77.7% [95% CI, 76.0–79.6] for LDL-C180.In our sample, however, LDL-C180has shown significantly higher overall concordance than LDL-CF.Compared with LDL-CFby LDL-C category, LDL-C5was more concordant only when LDL-C was under 160 mg/L; how-ever, LDL-C25and LDL-C180were more concordant in all LDL-C categories. When LDL-C was lower than 70 mg/dL, as reported by Martin et al. [9], LDL-C180improved greatly in concor-dance compared with LDL-CF.This was particularly apparent in subjects with high triglyceride levels (seeS1 Fig). In subjects with triglyceride levels of 200 to 399 mg/dL, LDL-C25provided a significantly higher concordance than LDL-CF(p= 0.001) and LDL-C180(p= 0.026).
However, a point of precaution is that while there may be high concordance in a special stratum, the specific method in that stratum may not be the most appropriate method. LDL-C180showed high concordance of 84.1% for LDL-C less than 70mg/dL, but in reality, 129 out of 361 subjects with LDL-C less than 70mg/dL showed overestimation (seeTable 5,S6 Table). The overall concordance of 82.3% for LDL-C25was the highest. Compared to the Frie-dewald formula, it showed higher concordance at all LDL-C levels, and the 78.8% concordance at LDL-C less than 70mg/dL was lower than that of LDL-C180, but still accurately categorized more subjects (279 individuals,Table 5). The purpose of the clinical screening test is to accu-rately diagnose a greater number of patients and apply appropriate treatments. Thus, simply analyzing the concordance can lead to erroneous results. Instead, multiple points must be con-sidered, such as each method’s trend of diagnosis, sensitivity, specificity, and perceived ease of use in actual application, in addition to the concordance.
being prone to LDL-C underestimation [5]. The overestimation observed in our study, there-fore, may be actually due to the Sekisui assay missing some elements of LDL-C.
Another possible explanation is that the overestimation of LDL-C by LDL-C180can be attributed to racial differences and related difference in dietary patterns. This could be postu-lated to impact TG:VLDL-C ratio. We have partly identified the differences in the median TG: VLDL-C ratio by triglyceride and non-HDL-C strata between Korean and American. For example, the median TG:VLDL-C ratio of subjects with TG of<50 mg/dL and non-HDL-C of <100 mg/dL was 2.7 in our study versus 3.5 in Martin et al.’s study [9]. However, we calculated
VLDL-C as non-HDL-C minus LDL-CD,so it could be also affected by direct measuring method of LDL-C.
The application of strata-specific TG:VLDL-C ratios, like Martin’s novel method, can esti-mate a more accurate LDL-C of LDL-C levels under 70mg/dL than the Friedewald formula. In 2012, there were approximately 15 million target subjects for the Korea National Health Screening Program (KNHSP), 11.5 million of those that were actually screened, and approxi-mately 865,000 of total screened subjects in the LDL-C<70mg/dL category [18]. In addition to
subjects with TG>400mg/dL, direct measurement is needed for precise detection of the
sub-jects with LDL-C<70mg/dL, rather than the use of Friedewald formula. However, the use of
LDL-C25or LDL-C180allows for even more accurate estimation of LDL-C as well as the lower-ing of testlower-ing costs.
One of the limitations of this study is that the direct measurement method of LDL-C is not the same asβ–quantification used by Martin et al. [9]. It has been reported that liquid selective detergent method, such as Sekisui Medical, revealed a negative deviation from the Friedewald’s equation andβ-quantification in hypercholesterolemia [19–21]. Considering this effect for higher levels of LDL-C categories, the overestimation of LDL-C180may be somewhat exagger-ated than the actual value, although our study population mainly consists of normal healthy subjects. Miller et al. have compared and analyzed various homogenous assays withβ -quantifi-cation [22]. In their study, Sekisui assay fulfilled the NCEP total error goal in non-diseased sub-jects. Other studies also have reported that some homogenous assays, including Sekisui Medical, showed a good correlation with Friedewald equation orβ-quantification for common disease and healthy subjects with satisfactory precision. The authors suggested that homoge-nous assays could be used in epidemiologic studies, both in fasting and non-fasting samples [23,24].
Another limitation of this study is that VLDL was not directly measured, but rather it was calculated using the formula TC—HDL-C—LDL-C. In this calculation, concentrations of chy-lomicron, IDL-C, and others were not considered. Thus, cases such as a high level of chylomi-cron could increasingly lead to erroneous readings. However, the relative proportion of chylomicron in total cholesterol is very small, and all subjects were under strict eight hour fast-ing conditions, so the likelihood of error in this area was likely minimized as much as possible.
Conclusions
LDL-C25showed higher concordance in all levels and no bias in diagnostic tendencies. There-fore, it is worth considering Martin’s novel method as a trustworthy and economical method for the estimation of LDL-C among Koreans. However, the level of racial specificity of this method as well as the specific character of the applied measuring method should be considered, and the method requires further modification and validation using strata-specific TG:VLDL-C ratios derived from data specific to Koreans.
Supporting Information
S1 Fig. Concordance of direct measurement with Friedewald and novel estimates in classi-fying LDL-C lower than 70 mg/dL by triglyceride strata.LDL-C indicates low-density lipo-protein cholesterol; LDL-CF, Friedewald LDL-C; LDL-C5, 5-cell method LDL-C; LDL-C25, 25-cell method LDL-C; LDL-C180, 180-cell method LDL-C (Martin et al. [9]).
(TIF)
S1 Table. Results ofthe Wilcoxon signed ranks test for the median score difference between LDL-CFand LDL-CDvalues (LDL-CF—LDL-CD) by TG levels.LDL-C indicates low-density lipoprotein cholesterol; LDL-CF, Friedewald LDL-C; LDL-CD, LDL-C measured by the enzy-matic homogeneous assay; TG, triglycerides. Under the null hypothesis of no difference, the sum of the ranks relating to the positive and negative difference should be the same. If SP>SN, where SP = the sum of the positive ranks and SN = the sum of the negative ranks,
then LDL-CFoverestimates LDL-CD; if SN>SP, then LDL-CFunderestimates LDL-CD. (DOCX)
S2 Table. Results of the Wilcoxon signed ranks test for the median score difference between LDL-C5and LDL-CDvalues (LDL-C5—LDL-CD) by TG levels.LDL-C indicates low-density lipoprotein cholesterol; LDL-C5, 5-cell method LDL-C; LDL-CD, LDL-C measured by the enzy-matic homogeneous assay; TG, triglycerides. Under the null hypothesis of no difference, the sum of the ranks relating to the positive and negative difference should be the same. If SP>SN, where SP = the sum of the positive ranks and SN = the sum of the negative ranks,
then LDL-C5overestimates LDL-CD; if SN>SP, then LDL-C5underestimates LDL-CD. (DOCX)
S3 Table. Results ofthe Wilcoxon signed ranks test for the median score difference between LDL-C25and LDL-CDvalues (LDL-C25—LDL-CD) by TG levels.LDL-C indicates low-den-sity lipoprotein cholesterol; LDL-C25, 25-cell method LDL-C; LDL-CD, LDL-C measured by the enzymatic homogeneous assay; TG, triglycerides. Under the null hypothesis of no differ-ence, the sum of the ranks relating to the positive and negative difference should be the same. If SP>SN, where SP = the sum of the positive ranks and SN = the sum of the negative ranks,
then LDL-C25overestimates LDL-CD; if SN>SP, then LDL-C25underestimates LDL-CD. (DOCX)
S4 Table. Results ofthe Wilcoxon signed ranks test for the median score difference between LDL-C180and LDL-CDvalues (LDL-C180—LDL-CD) by TG levels.LDL-C indicates low-den-sity lipoprotein cholesterol; LDL-C180, 180-cell method LDL-C (Martin et al. [9]); LDL-CD, LDL-C measured by the enzymatic homogeneous assay; TG, triglycerides. Under the null hypothesis of no difference, the sum of the ranks relating to the positive and negative difference should be the same. If SP>SN, where SP = the sum of the positive ranks and SN = the sum of
the negative ranks, then LDL-C180overestimates LDL-CD; if SN>SP, then LDL-C180 underes-timates LDL-CD.
S5 Table. Results of the Wilcoxon signed ranks test for the median score differences between | LDL-CF-LDL-CD| and | LDL-CN-LDL-CD|values.LDL-C indicates low-density lipoprotein cholesterol; LDL-CF, Friedewald LDL-C; LDL-C5, 5-cell method LDL-C; LDL-C25, 25-cell method LDL-C; LDL-C180, 180-cell method LDL-C (Martin et al. [9]); LDL-CD, LDL-C measured by the enzymatic homogeneous assay. Under the null hypothesis of no difference, the sum of the ranks relating to the positive and negative difference should be the same. If SP>SN, where SP = the sum of the positive ranks and SN = the sum of the negative ranks,
then LDL-CNmore closely approximated LDL-CD; if SN>SP, then LDL-CFmore closely approximated LDL-CD.
(DOCX)
S6 Table. Concordance of the NCEP-ATP III guideline classification between LDL-CDand LDL-C estimates when triglycerides are lower than 400 mg/dL.LDL-C indicates low-density lipoprotein cholesterol; LDL-CD, LDL-C measured by the enzymatic homogeneous assay; LDL-CF, Friedewald LDL-C; LDL-C5, 5-cell method LDL-C; LDL-C25, 25-cell method LDL-C; LDL-C180, 180-cell method LDL-C (Martin et al. [9]).
(DOCX)
S7 Table. Results of McNemar’s exact test for the comparison of overall concordance rates between LDL-CFand each LDL-CNestimate when triglycerides are lower than 400 mg/dL. LDL-C indicates low-density lipoprotein cholesterol; LDL-CF, Friedewald LDL-C; LDL-C5, 5-cell method LDL-C; LDL-C25, 25-cell method LDL-C; LDL-C180, 180-cell method LDL-C (Martin et al. [9]).
(DOCX)
S8 Table. Results of McNemar’s exact test for the comparison of concordance rates between LDL-CFand each LDL-CNestimate by triglyceride levels.LDL-C indicates low-density lipo-protein cholesterol; LDL-CF, Friedewald LDL-C; LDL-C5, 5-cell method LDL-C; LDL-C25, 25-cell method LDL-C; LDL-C180, 180-cell method LDL-C (Martin et al. [9]); TG, triglycer-ides.
(DOCX)
Acknowledgments
The authors are grateful to the editor, Alberto G Passi, two anonymous referees at PLOS ONE, as well as Hyesu Lee, OhkhyunRyu, and Yongsup Kim. The authors also thank seminar partici-pants at Hallym University, Kangwon National University, and Korea Advanced Institute of Science and Technology.
Author Contributions
Conceived and designed the experiments: JL HS. Performed the experiments: SJ HS. Analyzed the data: JL HS SJ. Contributed reagents/materials/analysis tools: JL SJ. Wrote the paper: HS JL SJ. Interpretation of the results: JL HS. Critical revision of manuscript for important intellectual content: JL SJ HS.
References
2. Stein EA. Measuring LDL cholesterol: for old and new calculations, is there an optimal formula? Chin Chem 2014; 60: 1466–68.
3. National Health Insurance Service. 2013 National Health Screening Statistical Yearbook. 2014. 4. Friedewald WT, Levy RI, Fredrickson DS. Estimation of the concentration of low-density lipoprotein
cholesterol in plasma, without use of the preparative ultracentrifuge. Chin Chem 1972; 18: 499–502. 5. Nauck M, Warnick GR, Rifai N. Methods for measurement of LDL-cholesterol: a critical assessment of
direct measurement by homogenous assays versus calculation. Clin Chem 2002; 48: 236–54. PMID:
11805004
6. Martin SS, Blaha MJ, Elshazly MB, Brinton EA, Toth PP, McEvoy JW, et al. Friedewald-estimated ver-sus directly measured low-density lipoprotein cholesterol and treatment implications. J Am Coll Cardiol 2013; 62: 732–9. doi:10.1016/j.jacc.2013.01.079PMID:23524048
7. Oliveira MJ, van Deventer HE, Bachmann LM, Warnick GR, Nakjima K, Nakamura M, et al. Evaluation of four different equations for calculating LDL-C with eight different direct HDL-C assays. Clin Chem Acta 2013; 423: 135–40.
8. Scharnagl H, Nauck M, Wieland H, März W. The Friedewald formula underestimates LDL cholesterol at low concentrations. ClinChem Lab Med 2001; 39: 426–31.
9. Martin SS, Blaha MJ, Elshazly MB, Toth PP, Kwiterovich PO, Blumenthal RS, et al. Comparison of a novel method vs the Friedewald equation for estimating Low-Density Lipoprotein cholesterol levels from the standard lipid profile. JAMA 2013; 310: 2061–8. doi:10.1001/jama.2013.280532PMID:
24240933
10. Korea Centers for Disease Control and Prevention. The Fourth Korea National Health and Nutrition Survey (KNHANES IV). Available:http://knhanes.cdc.go.kr/.
11. Korea Centers for Disease Control and Prevention. The Fifth Korea National Health and Nutrition Sur-vey (KNHANES V). Available:http://knhanes.cdc.go.kr/.
12. DeLong DM, DeLong ER, Wood PD, Lipppel K, Rikind BM. A comparison of methods for the estimation of plasma low- and very low-density lipoprotein cholesterol: the Lipid Research Clinics Prevalence Study. JAMA 1986; 256: 2372–7. PMID:3464768
13. Puavilai W, Deerochanawong C, Muthapongthavorn N, Srilert P. The accuracy in using modified Frie-dewald equation to calculate LDL for non-fast triglycerides: A pilot study. J Med Assoc Thai 2009; 92: 182–7. PMID:19253792
14. Hata Y, Kakajima K. Application of Fridewald’s LDL-cholesterol estimation formula to serum lipids in the Japanese population. Japanese Circulation Journal 1986; 12: 1191–1200.
15. McNamara JR, Cohn JS, Wilson PWF, Schaefer EJ. Calculated values for low-density lipoprotein cho-lesterol in the assessment of lipid abnormalities and coronary disease risk. Chin Chem 1990; 36: 36– 40.
16. Wang Teh Y, Wang Thomas S. Low Triglycerides levels affect calculation of Low-Density Lipoprotein Cholesterol values. Archives of Pathology & Laboratory Medicine 2001; 125(3): 404–5.
17. Meeusen JW, Lueke AJ, Jaffe AS, Saenger AK. Validation of a proposed novel equation for estimating LDL cholesterol. ClinChem 2014; 60: 1519–23.
18. National Health Insurance Service. 2012 National Health Screening Statistical Yearbook. 2013 19. Yamada K., Tsuji N., Fujita T., Tanaka M., Kuribayashi K., Kobayashi D., et al. Comparison of four
direct homogenous methods for the measurement of Low-Density Lipoprotein Cholesterol. Clin Lab 2010; 56: 327–333 PMID:20857897
20. Zhang B, Kawachi E, Matsunaga A, Imaizumi S, Noda K., Uehara Y., et al. Reactivity of direct assays for Low-Density Lipoprotein (LDL) Cholesterol toward charge-modified LDL in hypercholesterolemia. Circ J 2012; 76: 2241–2248. PMID:22785328
21. Yamashita S., Kawase R., Nakaoka H., Nakatani K., Inagaki M., Yuasa-Kawase M., et al. Differential reactivities of four homogeneous assays for LDL-cholesterol in serum to intermediate-density lipopro-teins and small dense LDL: Comparisons with the Friedewald equation. Clin Chim Acta2009; 410: 31– 38. doi:10.1016/j.cca.2009.09.010PMID:19751710
22. Miller WG, Myers GL, Sakurabayashi I, Bachmann LM, Caudill SP, Dziekonski A, et al. Seven direct methods for measuring HDL and LDL Cholesterol compared with ultracentrifugation reference mea-surement procedures. Clin Chem 2010; 56(6): 977–986. doi:10.1373/clinchem.2009.142810PMID:
20378768