ISSN 1 5 1 7 - 7 0 7 6
Revista Matéria, v. 12, n. 4, pp. 612 – 617, 2007 http://www.materia.coppe.ufrj.br/sarra/artigos/artigo10899
Autor A. V. Cardoso Data de envio: 11/08/06 Data de aceite: 16/03/07
Cortical bone porosity visualization using
mercury porosimetry intrusion data
CARDOSO, Antônio V.; OLIVEIRA, Walisson José; VAZ, G.J.O. Laboratório de Reologia, Setor de Análises Químicas, Fundação Centro Tecnológico de Minas Gerais (CETEC)
Av. José Candido da Silveira nº 2000, CEP 31170-000, Belo Horizonte (MG), Brasil. e-mail: [email protected], [email protected], [email protected].
ABSTRACT
Cortical bone porosity of bovine tibia samples has been investigated using the mercury intrusion porosimetry (MIP) technique. Cortical bone porosity range from 10 nm (caniculae) to 40 μm (Harvers canals), well in the measuring range region for the MIP technique. Samples from fresh bovine cortical bone were treated, dried and cut into ~ (3x1x1) cm pieces .The aim of the work was twofold: 1- To investigate bone porosity structure and direction quantitatively; 2- To obtain tri-dimensional scientific visualization (SV) images of cortical bone porosity. The MIP experiments associated with SV seem to be a good tool for studies of bone loss mechanisms, bone porosity distribution and bone growth phenomena.
Keywords: bone porosity, mercury porosimetry, scientific visualization.
1 INTRODUCTION
Bone mass loss is one of worst health problems occurring with aged people. Consequences are higher porosity and decrease in bone mechanical strength. Fractures are frequent and might result in long resting times and eventually permanent physical disability. [1]
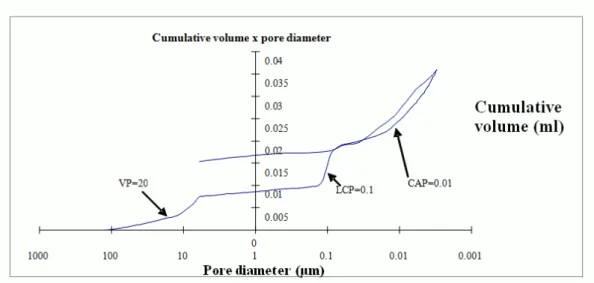
Where the porosity is located is still a matter of debate. Cowin [2] has classified cortical bone porosity in four types of porosity: a- vascular (VP); b- lacunae-caniculae (LCP); c- collagen-apatite (CAP); d- intertrabecular (ITP). Vascular porosity is the set of the Havers and Volkman canals with radius around 20
μm [3]. Lacunae-caniculae porosity is compound by caniculae and lacunae with average radius approximately 0.1 μm. Collagen-apatite porosity are empty spaces left between collagen fibers and apatite crystals. Intertrabecular porosity is spaces on the trabecula with dimensions larger than 1 mm. Here, we are concerned with micrometer (from 3 nm to 360 µm) porosities which, of course, do not include the intertrabecular porosity. Scientific visualization is a software tool for helping one to transform experimental data in numerical format on images instead of graphics [4]. Experimental data from MIP technique is specially suitable to such an exercise because a considerable amount of data concerning sample porosity can be obtained in one single experiment.
Mercury intrusion porosimetry (MIP) is a commercial characterization technique for the analyses of average open porosity, pore size distribution, etc; and is routinely used as a characterization technique for ceramics, metals and minerals [5, 6, 7]. The principles of porosity size using MIP are based on the fact that mercury is a non-wetting liquid and the diameter of the open pore can be associated with the applied pressure via the Washburn equation:
P
D= −4γcosθ (1)
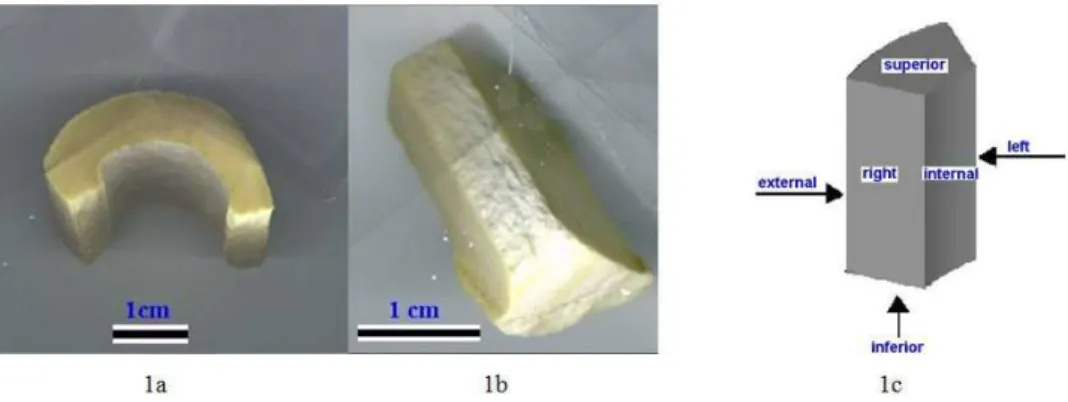
Figure 1: (a) Bovine tibia sample after treatment; (b) sealed shape sample; c) Nomenclature used for the faces of the bone samples in the sealed faces MIP experiment.
To investigate from which sample face (Figure 1.c) the open pores have originated we have performed MIP experiments with sealed faces of the bone sample. Sealing has been accomplished by applying a commercial instantaneous glue film over the bone surface sample. To identify each side we have nominated the sides of the sample as indicated in Figure. 1.c. The software utilized for the pore structure visualization was VTK (Visualization Toolkit) [8, 9, 10] and the algorithms were written using the language TCL (Tool Command Language) [11, 12].
3 RESULTS AND DISCUSSION
Figure 2: (a) SEM micrograph of the bone sample prior to MIP test. (b) SEM micrograph after mercury intrusion test. Bar: 10 microns.
Figure 3: Incremental intrusion volume of mercury versus pore diameter.
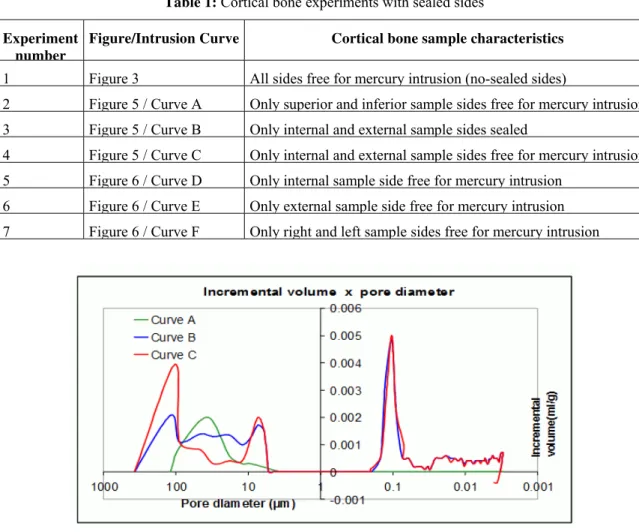
Table 1: Cortical bone experiments with sealed sides
Experiment number
Figure/Intrusion Curve Cortical bone sample characteristics
1 Figure 3 All sides free for mercury intrusion (no-sealed sides)
2 Figure 5 / Curve A Only superior and inferior sample sides free for mercury intrusion 3 Figure 5 / Curve B Only internal and external sample sides sealed
4 Figure 5 / Curve C Only internal and external sample sides free for mercury intrusion 5 Figure 6 / Curve D Only internal sample side free for mercury intrusion
6 Figure 6 / Curve E Only external sample side free for mercury intrusion 7 Figure 6 / Curve F Only right and left sample sides free for mercury intrusion
Figure 5: Incremental intrusion volume of mercury versus pore diameter
Figure 6: Incremental intrusion volume of mercury versus pore diameter
All curves display approximately the same porosity with the exception of curve A. Havers/Volkmann vascular hollows seem to initiate at all six faces of the bovine tibia bone sample. The tested samples have indicated that the lacunae-caniculae system initiates from external and internal faces, as well as from right and left sides. However, there are no mercury intrusions into lacunae-caniculae porosity from superior and inferior bovine tibia bone sample sides. Further studies will be needed to test the hypothesis that caniculae and lacunae might be organized approximately in orthogonal planes to the Havers canals.
On the other hand, hysteresis is normally observed in porosimetry runs (see Figure 4) and it is associated with the contact angle change between the mercury intrusion and extrusion cycle. Figure 4 shows the extrusion curve close to the intrusion curve for pore sizes lower than 0.1 μm diameter. It seems that once the mercury has entered pores ≥ 0.1 μm it is retained there. One possible explanation is that these pores are caniculae.
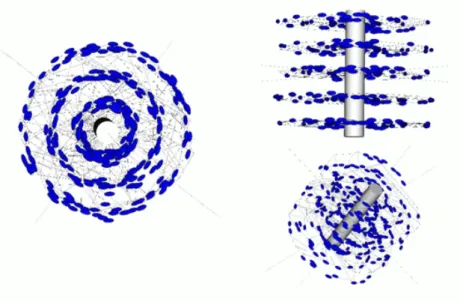
Using MIP data (total porosity for each type) and knowing the mean pore diameter of vascular, lacunae, and the caniculae it was possible to calculate the volume occupied by each pore type in a (1. h = variable) mm3 unitary cell volume. Figure 7 presents the visualization of such a cylinder shaped cell of the porous structure of the bovine tibia sample. In this visualization the vascular and lacunae-caniculae porosity form one Havers system. The vascular porosity shows a central cylinder, one Havers canal. The lacunae-caniculae porosity is represented by ellipsoids (lacunae) and by very small cylinders (lacunae-caniculae). Due to the scale of the structure cylinders appear as lines.
[2]COWIN, S.C., “Bone poroelasticity”, Journal of Biomechanics, v. 32, n. 3, pp. 217-238, 1999. [3] HAM, A.W., Histologia (transl.), 2 ed, Rio de Janeiro, Guanabara Koogan S.A, 1977.
[4] COSTA, L.F., OLIVEIRA, M.C.F., MINGHIM, R., “De olho nos Neurônios: as formas virtuais do pensamento”, Ciência Hoje, Brasil, v. 28-167, pp. 44 - 51, 01 mar. 2000.
[5] WEBB, P.A., ORR, C., Analytical Methods in Fine particle Technology, 1 ed., Micromeritics Instrument Corp, Norcross, 1997.
[6] AUTO-PORE II 9220, Operator’s Manual, Norcross, Micromeritics Instrument Corp, 1990.
[7] WEBB, P.A., “An introduction to the physical characterization of materials by mercury intrusion porosimetry with emphasis on reduction and presentation of experimental data”, Micromeritics
Instrument Corp, Norcross, 2001.
[8] SCHROEDER, W.J., AVILA, L.S., HOFFMAN, W., “Visualizing with VTK: A Tutorial”, IEEE
Computer Graphics and Applications, v. 20, n. 5, pp. 20-27, Sep./Oct., 2000.
[9] SCHROEDER, W.J., MARTIN, K., LORENSEN, B., The Vizualization Toolkit: An Object-Oriented
Approach To 3D, 1 ed. New Jersey, Graphics, Prentice-Hall, 1996.
[10] “THE VISUALIZATION TOOL KIT”, Available in: http://public.kitware.com/VTK/, Accessed: 05 October 2007.
[11] “TCL and TK made easy”, Available in: http://www.csc.calpoly.edu/~dbutler/tutorials/winter96/tcl/, Accessed: 05 October 2007.