Vol.47, n. 4 : pp. 553-558, August 2004
ISSN 1516-8913 Printed in Brazil
BRAZILIAN ARCHIVES OF
BIOLOGY AND TECHNOLOGY
A N I N T E R N A T I O N A L J O U R N A L
Use of a Proteolytic Enzyme in Cocoa (
Theobroma cacao
L.)
Processing
Edy Sousa de Brito
1∗, Nelson Horacio Pezoa García
2and Allan César Amancio
21
Embrapa Agroindústria Tropical; R. Dra. Sara Mesquita, 2270; 60511 110; Fortaleza - CE - Brazil.
2
Departamento de Tecnologia em Alimentos; Faculdade de Engenharia de Alimentos; Universidade Estadual de Campinas - UNICAMP; Campinas - SP - Brazil
ABSTRACT
Protein hydrolysis using an exogenous protease on cocoa nibs was performed to verify the formation of precursors and the effect on cocoa flavour. An experimental design was used to check the influence of temperature
(30 to 70 oC) and enzyme : substrate ratio [E/S] (97.5 to 1267.5 U g-1 of protein). The % Degree of Hydrolysis
(% DH) was affected mainly by [E/S] leading to a 4-fold increase (from 5 to 20 %) after 6 hours of treatment. During cocoa nibs roasting, there was a greater consumption of hydrolysis compounds in the sample treated with protease as compared to the control, indicating their participation in the Maillard reaction. An increased perception of chocolate flavour and bitter taste was observed in a product formulated with protease treated cocoa.
Key words: Cocoa, flavour, protein hydrolysis, processing
∗
Author for correspondence
INTRODUCTION
Fermented and dried cocoa beans constitute the raw material used by the chocolate industry to produce various different products, which are largely appreciated for their characteristic flavour. During fermentation the pulp surrounding the seeds is metabolized by the microorganisms resulting in a temperature rise and a drop in pH, which are responsible for cotyledon death. During this some other substances such as ethanol, acetic and lactic acids and the formation of flavour precursors, basically peptides, free amino acids and reducing sugars (Reinnecius et al., 1972; Mohr et al., 1976) are also produced. These precursors participate in the Maillard reaction during cocoa roasting, leading to the characteristic chocolate flavour.
The use of enzymes in cocoa nibs was proved to be successful in reducing polyphenol contents by nearly 25% (Yoshiyama and Ito, 1996; Fernández Barbery, 1999). These authors found a greater polyphenol reduction in autoclaved nibs, which facilitated enzyme penetration into tissues and action. Fernández Barbery (1999) also demonstrated that bitter taste and astringency were reduced by polyphenoloxidase action, which contributed to a better acceptance of the cocoa products.
The purpose of this work was to study the effect of using an exogenous proteolytic enzyme in previously fermented and dried cocoa nibs. Enzyme concentration and temperature of the process were evaluated in order to improve protein hydrolysis.
MATERIAL AND METHODS
Sample
Fermented cocoa beans of the Forastero variety collected from an IAC experimental station in Pariquera Açu, São Paulo, Brazil were used. The tegument and germ tissues were removed and the cotyledons were broken into nibs. The material sieved through a 3.5 mesh screen but retained by an 8 mesh screen was autoclaved at 121oC for 15 min prior to enzyme treatment.
Enzymatic Treatment
A proteolytic enzyme (Flavourzyme MG, type A), with an activity of 1,000 Leucine Aminopeptidase
Units (LAPU) g-1 was provided by Novo Nordisk A/S (Bagsvaerd, Denmark). The enzyme was dissolved in 90 mL of distilled water and placed in a beaker containing 150 g of cocoa nibs. The samples were then subjected to a 200 mm Hg atmosphere for 1 min. During the experiments samples were maintained in a water bath at the desired temperature and the nibs were mixed at 15 min intervals. At appropriate times the reaction was stopped by drying samples at 65oC for 30 min and then kept at -18oC until analysed.
An experiment with an enzyme/substrate ratio [E/S] of 682.5 and 50oC (central point) was done and samples were collected after 1, 2, 4 and 6 hours of reaction. Reaction times of 4 and 6 hours were chosen for further sensorial studies. A central composite rotatable design (CCRD) (Barros Neto et al., 1996) with two variables was used to study the response pattern, degree of hydrolysis, and to establish a model for cocoa protein hydrolysis. The variables studied were temperature and enzyme/substrate ratio, each one at five levels. Table 1 shows the symbols and levels.
Results were evaluated by response surface methodology (RSM) and adequacy of the model was assessed by analysis of variance (P<0.10) using the software STATISTICA (Statsoft, v. 5.0). In order to verify the model and to carry out a sensory evaluation, cocoa nibs were treated with enzyme or water (control) at a fixed condition and roasted at 150oC for 38 min (PRE 1Z sample roaster, Probat-Werke,Germany).
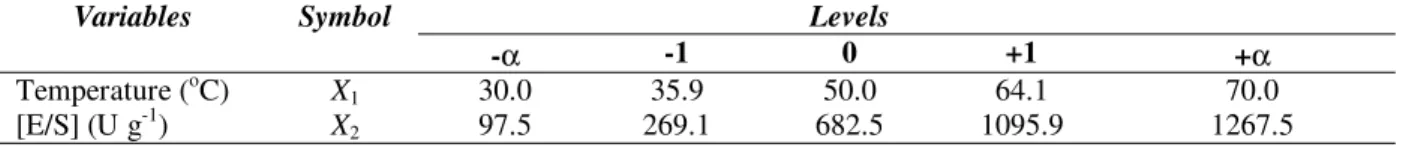
Table 1 - Variables and their levels for CCRD.
Variables Symbol Levels
-α -1 0 +1 +α
Temperature (oC) X1 30.0 35.9 50.0 64.1 70.0
[E/S] (U g-1) X2 97.5 269.1 682.5 1095.9 1267.5
Analyses
The amino groups (α-N) were extracted with a mixture of trichloroacetic acid/sodium acetate/ acetic acid (0.11 M:0.22 M:0.33 M) (Murthy et al., 1997) and determined spectrophotometrically after reacting with o-phthaldialdehyde (Church, 1985). The values were expressed as glycine content (mg g-1). The absorbance of the resulting extract was also read at A275 to determine levels of
amino acids and peptides with aromatic groups (Murthy et al., 1997). Total nitrogen was estimated
by a semi-micro Kjehdal procedure (AOAC, 1997).
Degree of protein hydrolysis (DH) was established as the ratio between amino-terminal groups and total nitrogen and expressed on a percentage base (equation 1).
Sensory Evaluation
The roasted nibs were milled in a cooled three-roll mill. The mass obtained was mixed with sugar and dairy cream (35% fat) in a proportion of 48.8:26.2:25 (w/w), respectively. The resulting product was cooled and cut into pieces (10 g weight) for sensory evaluation. A just right scale was used to evaluate the intensity of chocolate and bitter taste. The samples were presented to judges (N=30) who were asked to indicate the strength of the taste, in a 9-point structured scale raging from “much too weak” to “much too strong” (Meilgaard et al., 1987).
RESULTS AND DISCUSSION
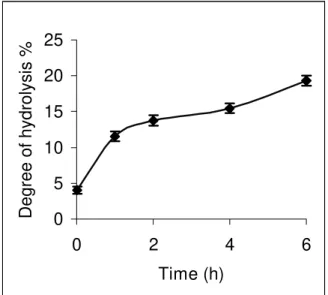
Fig. 1 shows the dynamics of protein hydrolysis at fixed conditions (central point). At the beginning of the process a 5 %DH was found. This value could be explained by the natural hydrolysis that happened during the fermentation. After 6 hours of treatment the DH experienced a 4 -fold increase. Table 2 shows the conditions and %DH after enzyme treatment for 4 and 6 hours. Data were analysed for main effects and interactions. The models expressed by equations 2 and 3 were generated, representing the %DH at 4 and 6 hours, respectively, as a function of the more significant variables (P<0.10).
%DH4 hours = 15.64 + 1,12X2 - 1,45X1X2 (eq. 2) %DH6 hours = 19 + 1.04X2 - 2,4X22 (eq. 3) The F-test showed that the model for A275 was not
reliable since the calculated F0.1 values were lower
than the tabled values (data not shown). These results indicated that aromatic amino acids were not released during proteolysis or that A275
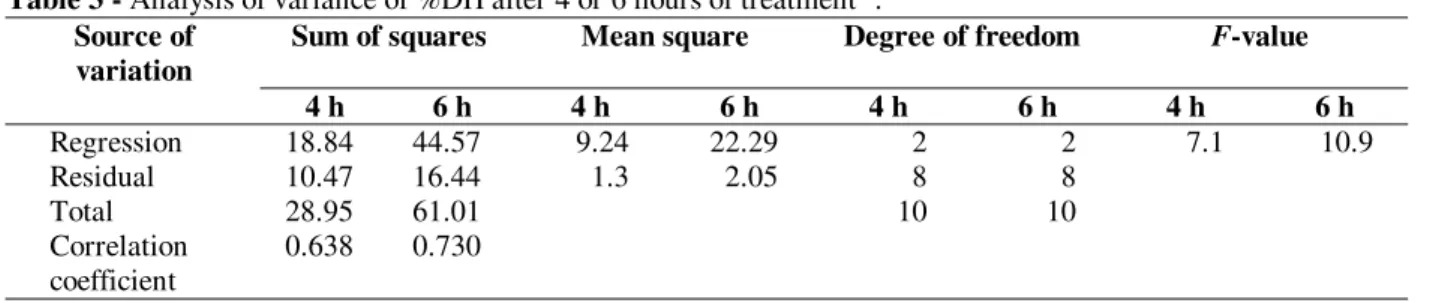
estimation was not a useful procedure to follow proteolysis in cocoa. Table 3 shows the analysis of variance for the %DH after 4 and 6 hours of treatment. The F0.1 value for %DH4 hours was lower
than the tabled one, and the %DH6 hours was greater
than it, but not 3-5 times greater which would indicate a model with high predictive power (Barros Neto et al., 1999). Despite this fact, it was decided to evaluate the model for 6 hours of treatment and its effect on % DH and on sensory properties. In order to determine the most adequate conditions and analyze the process, the response surface was plotted using Eq. (3) (Fig. 2). The non-significant effect of temperature on %DH
could be explained by non-uniform heat distribution inside the nibs due to their size (5 mm) and distribution inside the beaker. As the temperature had no influence in %DH, it was decided to use the lower temperature (30 oC), which implied a lower energy cost. For [E/S] it was decided to use the central point value since the highest %DH was obtained near this point.
An additional experiment was performed at a fixed condition (X1=-α, X2=0) and a control sample with
water instead of enzyme solution. The results are shown in Table 4. The % DH (18.1%) obtained in this latter experiment was lower than the values observed previously (20.0 %) and predicted (19 %) by the model, but it was higher than the control. The high level of %DH in the control could be explained by the action of endogenous enzymes (Hansen et al., 1998) that were brought to a suitable condition during the experiment. After roasting, the enzyme treated sample presented a greater consumption of hydrolysis products as compared to the control. These results indicated that the products formed during enzymatic hydrolysis were consumed at a higher extent during roasting, probably due to their participation in the Maillard reaction.
0 5 10 15 20 25
0 2 4 6
Time (h)
Degree of hydrolysis %
Figure 1 - Dynamics of protein hydrolysis with time. Test was performed at fixed conditions ([E/S]=682.5 and 50 oC). Values are mean of three replicates ± SD.
chocolate flavour and bitter taste, the treated sample presented a distribution more right-dislocated than the control, which indicated a stronger perception of the attributes. Such behaviour indicates that there are too many hydrolysis products available to form the flavour
components during roasting. The results in this work also emphasize the need for a good fermentation process, since during this process proteolysis occurred naturally.
Figure 2 - Response surface diagram of % DH at 6 hours as function of [E/S] and temperature.
Table 2 - Conditions and results for percentage degree of protein hydrolysis (%DH) at 4 and 6 hours according to central composite rotatable design.
Treatment No
X1 X2 Responses (%DH)
4 h 6 h
1 +1 +1 16.29 18.61
2 -1 +1 18.06 18.65
3 +1 -1 16.02 16.84
4 -1 -1 11.97 15.04
5 +α 0 14.74 15.92
6 -α 0 14.49 20.04
7 0 +α 18.00 14.56
8 0 -α 16.17 12.44
9 0 0 15.88 18.65
10 0 0 15.82 19.36
Table 3 - Analysis of variance of %DH after 4 or 6 hours of treatment a.
Source of variation
Sum of squares Mean square Degree of freedom F-value
4 h 6 h 4 h 6 h 4 h 6 h 4 h 6 h
Regression 18.84 44.57 9.24 22.29 2 2 7.1 10.9
Residual 10.47 16.44 1.3 2.05 8 8
Total 28.95 61.01 10 10
Correlation coefficient
0.638 0.730
a
F0.90;2;8 = 9.37
Table 4 - Degree of hydrolysis as predicted by the model and for cocoa samples treated with water and enzyme for 6 hours, before and after roasting.
Sample Degree of hydrolysis (%)
Observeda 20,0
Predicted by the model 19,0
Controlb 17,4
Control roasted 13,7
Enzyme treated 18,1
Enzyme treated roasted 12,2
a - experiment 6, table 2 b - treated with water
Figure 3 - Percentage of responses for chocolate flavour (a) and bitter taste (b) for cocoa products formulated with
enzyme treated cocoa (■) and control ( ) (1=much too weak, 5=just right, 9=much too strong).
CONCLUSION
The use of a proteolytic enzyme was useful in improving cocoa flavour precursors and affected the flavour perception in their products. The difficulty to establish a model could be suppressed
by changing the process in such a way to enhance the access of enzyme to substrate and a better heat transfer.
0 5 10 15 20 25 30 35
1 2 3 4 5 6 7 8 9
just right scale
fr
e
que
nc
y
(
%
)
a
0 5 10 15 20 25 30
1 2 3 4 5 6 7 8 9
just right scale
fr
e
q
ue
ncy
(
%
)
ACKNOWLEDGMENT
This work was supported by CNPq and FAPESP.
RESUMO
Foi feita uma hidrólise da proteína dos nibs de cacau usando-se uma protease para verificar a formação de precursores e o efeito sobre o sabor do cacau. Um desenho experimental foi usado para verificar a influência da temperatura (30 a 70 oC) e razão enzima : substrato [E/S] (97,5 a 1267,5 U g-1 de proteína). O grau de hidrólise % (%DH) foi afetado principalmente pela [E/S], tendo sofrido um aumento de 4 vezes (de 5 para 20 %) após 6 horas de tratamento. Durante a torração dos nibs houve um consumo maior dos compostos de hidrólise na amostra tratada com protease em comparação com o controle, indicando a participação desses compostos na reação de Maillard. Foi observado um aumento na percepção do sabor de chocolate e do gosto amargo em um produto formulado com o cacau tratado com a protease.
REFERENCES
Abeygunasekera, D. D. and Jansz, E. R. (1989), Effect of the maturation process on fermented cocoa beans I: Free amino acids and volatile carbonyls. Journal
National Science Council Sri Lanka, 17, 23-33.
AOAC (1997), Cacao bean and its products. In: Cunniff, P. (ed.). Official Methods of Analysis of
AOAC International. 16th ed. Washigton. pp. 1.
Barros Neto, B.; Scarminio, I. S. and Bruns, R. E. (1996), Planejamento e otimização de experimentos. 2. ed. Campinas : Unicamp.
Church, F. C.; Porter, D. H.; Catignani, G. L. and Swaisgood, H. E. (1985), An o-phthaldehyde spectrophotometric assay for proteinases. Analytical
Biochemistry., 146, 343-348.
Fernández Barbery, S. D. (1999), Estudo do
melhoramento do sabor de cacau (Theobroma cacao
L.) utilizando polifenoloxidase extraida da pinha (Annona squamosa L.) e tratamento térmico não
convencional. Tese (Doutorado), UNICAMP,
Campinas, Brasil.
Hansen, C. E.; Olmo, M. and Burri, C. (1998), Enzyme activities in cocoa beans during fermentation. Journal
Science Food Agriculture, 77, 273-281.
Lerceteau, E.; Rogers, J.; Pétiard V. and Crouzillat D. (1999), Evolution of cacao bean proteins during fermentation: a study by two-dimensional electrophoresis. Journal Science Food Agriculture,
79, 619-625.
Meilgaard, M.; Civille, G. V. and Carr, B. T. (1987),
Sensory Evaluation Techniques. Boca Raton : CRC
Press.
Mohr, W.; Landschreiber, E. and Severin, T. (1976), Zur spezifitat des kakaoaromas. Fette Seifen
Anstrichmittel, 78, 88-95.
Murthy, M. V. R.; Padmanabhan, S.; Ramakrishna, M. and Lonsane, B. K. (1997), Comparison of nine different caseinolytic assays for estimation of proteinase activity and further improvement of the best method. Food Biotechnology, 11, 1-23.
Reineccius, G. A.; Andersen, D. A.; Kavanagh, T. E. and Keeney, P. G. (1972), Identification and quantification of free sugars in cocoa beans. Journal
Agriculture Food Chemistry, 20, 199-202.
Seiki, K. (1973), Chemical changes during cocoa bean fermentation using the tray method in Nigeria.
International Chocolate Review, 28, 38-42.
Voigt, J.; Biehl, B.; Heinrichs, H.; Kamaruddin, S.; Marsoner, G. C. and Hugi, A. (1994a), In-vitro formation of cocoa-specific aroma precursors: aroma-related peptides generated from cocoa -seed protein by co-operation of an aspartic endoprotease and a carboxipeptidase. Food Chemistry, 49, 173-80. Voigt, J.; Heinrichs, H.; Voigt, G. and Biehl, B.
(1994b), Cocoa-specific aroma precursors are generated by proteolytic digestion of the vicilin-like globulin of cocoa seeds. Food Chemistry, 50, 177-84. Yoshiyama, M. and Ito, Y. (1996), Decrease of
astingency of cacao beans by na enzymatic treatment.
Nippon Shokuhin Kagaku Kaishi, 43, 124-129.