ISSN: 1809-4430 (on-line)
Proceedings of the XII SIBGRAPI (October 1999) 101-104 _________________________
1 Article developed in the discipline “Data Mining and Knowledge Discovery” in the postgraduate program in Agricultural
Engineering – PGEAGRI, Western Paraná State University - Cascavel, in 2015.
DATA MINING FOR THE ASSESSMENT OF MANAGEMENT AREAS IN PRECISION
AGRICULTURE1
Doi:http://dx.doi.org/10.1590/1809-4430-Eng.Agric.v37n1p185-193/2017
ELDER E. SCHEMBERGER2*, FABIANE S. FONTANA3, JERRY A. JOHANN3,
EDUARDO G. DE SOUZA3
2*Corresponding author. Federal University of Technology - Paraná/ Toledo - PR, Brasil. E-mail: [email protected]
ABSTRACT: Precision Agriculture (PA) uses technologies with the aim of increasing productivity and reducing the environmental impact by means of site-specific application of agricultural inputs. In order to make it economically feasible, it is essential to improve the current methodologies as well as proposing new ones, in which data regarding productivity, soil, and compound indicators are used to determine Management Areas (MAs). These units are heterogeneous areas within the same region. With these methodologies, data mining (DM) techniques and algorithms may be used. In order to integrate DM techniques to PA, the aim of this study was to associate MAs created for soy productivity using the Fuzzy C-means algorithm by SDUM software over a 9.9-ha plot as the reference method. It was in opposition to the grouping of 2, 3, and 4 clusters obtained by the K-means classification algorithms, with and without the Principal Component Analysis (PCA), and the EM algorithm using chemical and physical data of the soil samples collected in the same area during the same period. The EM algorithm with PCA modeling had a superior performance than K-means based on hit rates. It is noteworthy that the greater the number of analyzed MAs, the lower the percentage of hits, in agreement with the result shown by SDUM, which shows that two MAs compose the best configuration for this studied area.
KEYWORDS: algorithms,EM, KDD, K-means, Weka.
INTRODUCTION
Associating technology to agriculture has been increasingly relevant because of the need for increased productivity and profitability, less use of pesticides, and reducing the environmental impact on several rural areas (MOLIN et al., 2015). This later approach is the basis of Precision Agriculture (PA).
PA implementation and maintenance costs are generally a problem for smallholder farmers. Hence, the division of agricultural areas into smaller homogeneous units, known as Management Areas (MAs), is considered as an alternative for the application of PA (DOERGE, 2000) since it allows the use of conventional equipment as well as decreasing the number of soil analyses required to setting input recommendations.
MAs can be defined in several manners. JOHANNSEN et al. (2000) show an approach using remote sensing to obtain vegetation indexes and associate them to soil sampling grids. Other approaches consider the farmer sensitivity from empirical knowledge, although the most disseminated method in the literature for the setting-up of MAs consists in grouping chemical and physical soil parameters as well as relief data, taken from strategic georeferenced areas (MOLIN; FAULIN, 2013). Several farmers own a large volume of data related to their property, from which new information and standards can be retrieved to support the decision-making process (CARVALHO; MILANI, 2013; LUNARDELLI et al., 2014).
created for this to be feasible. To resolve this, the implementation of clusters may indicate how many MAs need to be created based on statistical criteria thereof (ODEH et al., 1992).
To find out the number of clusters (in this case MAs) should be generated, it is considered that the lower the count of clusters, the easier it will be for farmers to apply inputs at variable rates on their crops (PEDROSO, 2010; BAZZI et al., 2013). When using empirical methods, the ideal number is estimated to be between three or four MAs (SUSZEK, et al., 2012) without disregarding the use of two MAs.
Computational tools stand out among the technologies associated with PA, within which data mining (DM) is inserted. DM is the process of discovering new information (whether known or unknown) from large volumes of data (TAN et al, 2012). FAYYAD (1996) presented a definition from the perspective of machine learning, stating that DM is a step towards the knowledge of the discovery process, which consists of analyzing data and applying discovery algorithms which produce a set of data standards. These stages constitute the KDD process (Knowledge Discovery in Databases).
The KDD process is a non-trivial, interactive, and iterative method of identifying comprehensible, valid, new, and potentially useful standards from large data sets. Moreover, it is constituted by selection, process, transformation, DM, and assessment stages (FAYYAD, 1996), involving a series of areas related in a multidisciplinary manner (CARVALHO & DALLAGASSA, 2014).
Among the algorithms associated with DM are those for data grouping. Therefore, data is partitioned into homogeneous clusters, maximizing the similarity of objects within the same cluster, thus minimizing that of objects of different clusters (TAN et al, 2012). The algorithms may be standardized to create clusters from 2 to n (n is the total number of data).
These algorithms use similarity measures to generate clusters for the decision-making process, determining the data distribution on the respective groups. There are several measures to calculate similarity, including distance, correlation, and association (TAN et al., 2012). When the data set is constituted by quantitative attributes, distance metrics may be applied to calculate the similarity among the data (METZ & MORNARD, 2006).
Using such DM techniques and inherent concepts from PA, the needs (excess or lack of nutrients) on the georeferenced collection point could be detected. Each point is categorized into a cluster, precisely orienting the actions for each sampled point to be normalized according to recommendations from relevant entities.
Although several computational tools offer assistance with DM algorithms, all the results generated must be analyzed and interpreted by specialists in the area, creating a useful knowledge (TAN et al., 2012). It is important to highlight that DM algorithms are independent of cropped area or of the number of collected samples for analysis, which confirms their potential in PA.
The overall aim of this study was to use data mining techniques to assess management areas in Precision Agriculture. Thus, the generated groupings with EM (Expectation–maximization) and K-means algorithms (with Euclidean Distance, with and without Principal Component Analysis) were overlapped with soil physical and chemical data from one farming area split into two, three, and four MAs, with the Fuzzy C-means algorithm by SDUM Software with productivity data from this area.
MATERIAL AND METHODS
Study Area and Parameters Used
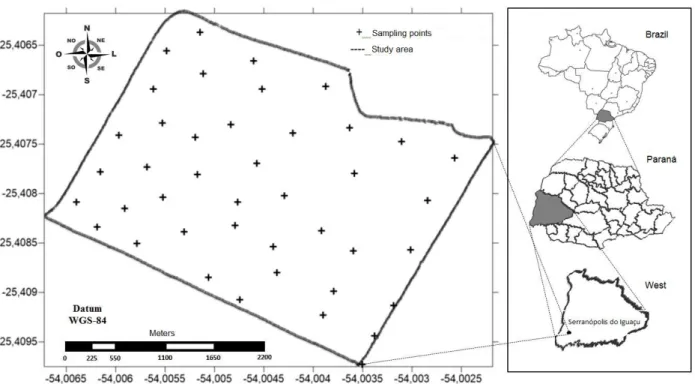
Data were gathered in 2014 from 42 georeferenced samples (points highlighted in Figure 1) which compose the database panel. The records consisted of altitude; contents of sand, clay, silt and organic matter; pH, being the soil classified as type 3 according to the normative instruction number 2 (October 9, 2008, Ministry of Agriculture, Livestock and Supply); arithmetic average of the standardized soybean yield for the years of 2012, 2013 and 2014; soil resistance to penetration measured by an automatic soil compaction meter (SoloTrack - PLG5200) for the depth layers of 0 to 10 cm, 10 to 20 cm and 20 to 30 cm.
FIGURE 1. Location map of the study area with georeferenced data collection points.
Computing Tools
Software Weka1, Surfer2, and SDUM3 were used.
Weka was used for data pre-processing, cleaning, and normalization, as well as for conducting the K-means and EM algorithms, assisting in the constitution of the Principal Component Analysis (PCA) to re-implement K-means.
Surfer was used to interpolating the productivity data as well as generating the contour maps and showing the clusters, which are the visual forms of MAs.
SDUM was used to execute the Fuzzy C-means algorithm on average productivity data from 2012, 2013, and 2014, considering these results as the reference method for data overlapping and visual comparison with data grouped on Weka, both for two, three, and four MAs. In addition, this tool highlights the best configuration of management areas further generated, facilitating thus a comparative analysis.
Pre-Processing of Data
During this phase, data was prepared to reduce discrepancies and possible inconsistencies introduced by failures or noises. At this time, the data were modified according to proper formats suitable for DM by aggregation, generalization, normalization, building and selection of attributes or even data reduction (TAN et al, 2012). The collected data showed no missing values, and outliers
1 http://www.cs.waikato.ac.nz/ml/weka/
and inconsistencies were not found.
The data were normalized to a single scale, between zero and one, achieving parametric uniformity for algorithms, which must be conducted to establish a data standard, excluding the hypothesis of algorithm influence on data. It has no effect on data representation in the field since the relationship between them still has the same original ratio; however, they are suitable for the application of necessary algorithms in the Weka software.
Neither dimensionality nor data discretization had to be made since the number and format were already adequate to execute the algorithms.
Data Processing
Principal Component Analysis (PCA) was carried out in order to indicate possible exclusions of attributes in the database, with the aim of attaining better results of the grouping algorithms.
These data were subjected to the K-means, Fuzzy C-means, and EM algorithms with the purpose of identifying possible clusters. Since the groups to which each object belongs are unknown beforehand, non-supervised learning techniques were used.
Euclidean Distance was performed for all executions of the K-means and Fuzzy C-means algorithms, and the variations of two, three, and four clusters for all algorithms. Algorithm EM has no distance parameter for execution since it is based on probabilistic models.
The inverse squared distance was used to interpolate data, being applied to the pre-established clusters by the grouping algorithms, showing the generated MAs.
After normalizing the data, processing was carried out in six steps, as follows:
1. Execution of the K-means algorithm on the data set for two, three, and four clusters; 2. Principal Component Analysis following criteria described by Jolliffe (JOLLIFFE, 1972). 3. Execution of the K-means algorithm on the data set after PCA conversion, removing
attributes suggested in step 2 for two, three, and four clusters;
4. Execution of the EM algorithm on the data set after PCA conversion, removing attributes suggested in step 2 for two, three, and four clusters;
5. Creation of dot maps containing the generated clusters;
6. Execution of the Fuzzy C-means algorithm on the same data used for the other algorithms, by means of SDUM software.
Steps 1 to 5 were carried out with the support from Weka tool and Surfer was used for georeferencing of clusters.
Step 6 consisted of executing the results assumed as the reference method, in addition to performing the Fuzzy C-means algorithm using the same data from the other algorithms. These analyses were performed through SDUM software, which implements interpolator and applies ANOVA at a 5% significance comparing the average productivity of each area and, thereby, identifying which of management area created is the best, among two, three or four clusters.
RESULTS AND DISCUSSION
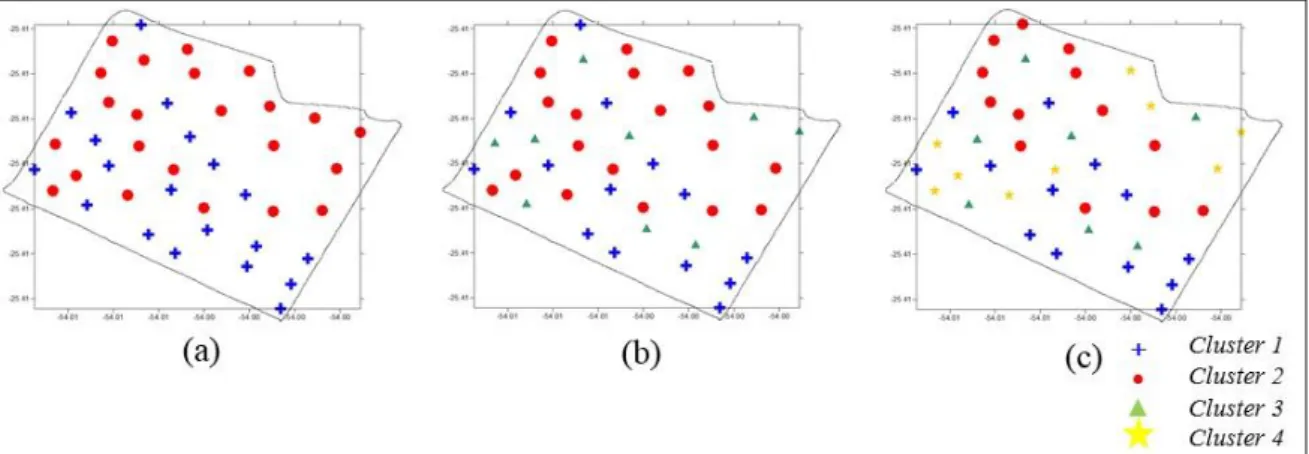
FIGURE 2. Groupings generated by the K-means algorithm - (a) 2 clusters, (b) 3 clusters and (c) 4 clusters.
The classification error rates without conducting PCA were 16%, 14%, and 13% for groupings in two, three, and four clusters, respectively (Table 1). It was observed that the points were categorized into mixed clusters since the geographical location of each point was not considered. Hence, each point was exclusively classified according to the result of the algorithm for input parameters.
TABLE 1. K-means - Points per cluster and error rate.
Number of Clusters Cluster 1 Cluster 2 Cluster 3 Cluster 4 Error Rate
2 45 55 16%
3 33 45 21 14%
4 31 31 17 21 13%
By applying the PCA technique and the criteria by JOLLIFFE (1972), which suggested the exclusion of two attributes (organic matter and sand), the K-means algorithm was newly executed to generate two, three, and four clusters, shown respectively in (a), (b) and (c), in Figure 3.
FIGURE 3. Groupings generated by the K-means algorithm + PCA – (a) 2 clusters, (b) 3 clusters and (c) 4clusters.
TABLE 2. K-means + PCA – Points per cluster and error rate.
Number of Clusters Cluster 1 Cluster 2 Cluster 3 Cluster 4 Error Rate
2 40 60 11%
3 33 36 31 10%
4 36 38 24 2 9%
The results of EM algorithm run after applying PCA with the criteria by JOLLIFFE (1972) for two, three, and four clusters are shown in (a), (b) and (c) of Figure 4, respectively. If compared to the algorithm K-means, EM algorithm results had greater differences for MAs with 3 (Figures 2b and 3b) and 4 (Figures 2c and 3c) clusters. This fact is which is justified by the heuristics used by each grouping algorithm (K-means and EM) to generate the clusters, which had already been observed by Johann et al. (2013). Although Weka does not offer the error rate of the groupings conducted with EM, it enables visualizing the distribution of the points among the clusters (Table 3).
TABLE 3. Error Rate of points by cluster for the EM + PCA algorithm.
Number of Clusters Cluster 1 Cluster 2 Cluster 3 Cluster 4
2 17 83
3 5 12 83
4 21 31 5 43
FIGURE 4. Groupings generated by the EM + PCA algorithm – (a) 2 clusters, (b) 3 clustersand (c) 4clusters.
In SDUM, the interpolation by the Inverse Square Distance and generation of the maps for two, three, and four MAs was conducted using the Fuzzy C-means algorithm, and it was defined as the reference method for this study.
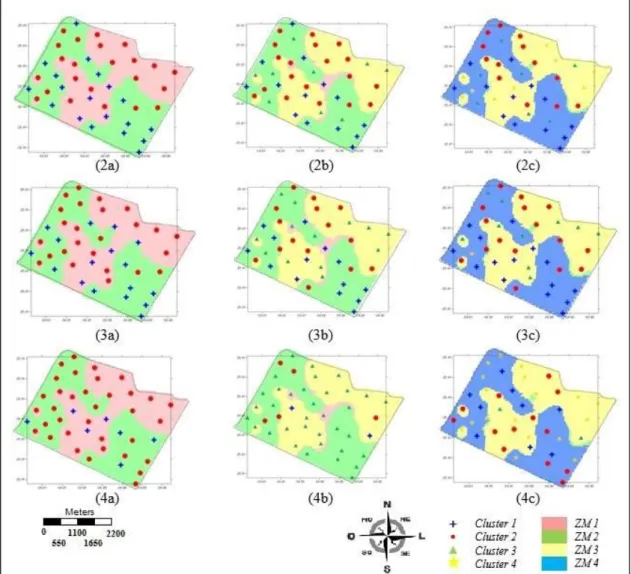
FIGURE 5. Overlap of groupings for 2, 3, and 4 clusters and the map of MAs where (2a), (2b) and (2c) K-means, (3a), (3b) and (3c) PCA + K-means and (4a), (4b) and (4c) PCA + EM.
Based on this overlap (Figure 5), the hits may be quantified for the clusters generated by each grouping algorithm (Table 4) when overlapped with the maps of the reference model.
TABLE 4. Hit rate of K-means and EM groupings on the Reference Method.
Amount of MAs Algorithms MA 1 MA 2 MA 3 MA 4 Hit Rate
2
K-means 10% 17% 27%
PCA + K-means 12% 22% 34%
PCA + EM 8% 42% 50%
3
K-means 3% 12% 10% 25%
PCA + K-means 3% 15% 20% 38%
PCA + EM 0% 10% 34% 44%
4
K-means 0% 3% 5% 3% 11%
PCA + K-means 0% 8% 17% 3% 28%
PCA + EM 0% 0% 5% 20% 25%
The K-means algorithm also had a lower performance than Algorithm EM if compared to the reference method, and its highest hit rate was 38% (K-means with PCA for three MAs).
It was also observed that the application of PCA increased the hit margin with algorithm K-means in 17% at its best performance (Table 4), indicating that, excluding the sand and organic matter attributes, in fact, improved the generation of the clusters.
After generating the MAs with the Fuzzy C-means algorithm for two, three, and four MAs, they were evaluated with the assistance of the SDUM software, in which ANOVA indicated homogeneity between MAs with 3 and 4 clusters for the analyzed data. When considering the Tukey’s test, two MAs made up the best configuration for the study area, being the only non-homogeneous set across the generated classes, indicating that, in fact, there are two different MAs. Therefore, with 5% of significance, the generated MAs with three and four clusters showed at least one pair of classes considered homogeneous in relation to each other.
CONCLUSIONS
Using Data Mining techniques to evaluate Management Areas has proven to be a method providing innovative and conclusive results. In addition, the Principal Component Analysis technique maximized the generation of clusters, showing an increase in hit rate across all executions conducted with the K-means algorithm.
Once a point-point distance analysis was not carried out in EM algorithm structuring, there was an unbalanced distribution of the MAs since in all executions, at least one of the MAs had a number of points near or superior to 50%.
The soil attributes sand and organic matter had no direct influence on the creation of MAs in the study area when considering average productivity, used by the reference method.
The grouping obtained with the EM algorithm and the application of PCA for two MAs were more assertive, while the K-means algorithm without PCA for four MAs had the worst overlapping if compared to the reference method from SDUM.
REFERENCES
BAZZI, C.; SOUZA, E.; URIBE-OPAZO, M.; NÓBREGA, L.; ROCHA, D. Management Zones Definition Using Soil Chemical And Physical Attributes In A Soybean Area. Engenharia Agrícola, Jaboticabal, v.34, n.5, p.952-964, 2013.
CARVALHO, D. R.; MILANI, C. S. Pós-Processamento em KDD. Revista de Engenharia e
Tecnologia, Ponta Grossa, v.5, n.1, p.151-162, 2013.
CARVALHO, D. R.; DALLAGASSA, M. R. Mineração de dados: aplicações, ferramentas, tipos de aprendizado e outros subtemas. AtoZ: novas práticas em informação e conhecimento, Curitiba, v.3, n.2, p.82-86, 2014.
DOERGE, T. A. Management zone concepts. Site-Specific Management Guidelines, 2000.
FAYYAD, U.; PIATETSKY-SHAPIRO, G.; SMYTH, P. From Data Mining to Knowledge
Discovery in Databases. Palo Alto: American Association for Artificial Intelligence, 1996.
LUNARDELLI, R. S. A.; TONELLO, I. M. S.; MOLINA, L. G. A constituição da memória dos procedimentos em saúde no contexto do prontuário eletrônico do paciente. Informação & Informação, Londrina, v.19, n.3, p.107-124, set./dez. 2014.
METZ, J.; MONARD, M. C. Projeto e implementação do módulo de clustering hierárquico do discover. São Carlos: ICMC, USP, 2006. Tech. Rep.
MOLIN, J. P.; AMARAL, L. R.; COLAÇO, A. Agricultura de Precisão. São Paulo: Editora Oficina de Textos, 2015.
MOLIN, J. P.; FAULIN, G. C. Spatial and temporal variability of soil electrical conductivity related to soil moisture. Scientia Agricola, Piracicaba,v.70, n.1, p.1-5, 2013.
ODEH, I. O. A.; CHITTLEBOROUGH, D. J.; MCBRATNEY, A. B. Soil pattern recognition with fuzzy-c-means: Application to classification and soil-landform interrelationships. Soil Science Society of America Journal, Madison, v.56, n.2, p.505-516, 1992.
PEDROSO, M.; TAYLOR, J.; TISSEYRE, B.; CHARNOMORDIC, B.; GUILLAUME, S. A segmentation algorithm for the delineation of agricultural management zones. Computers and Eletronics in Agriculture, Netherlands, v.70, n.1, p.199-208, 2010.
RODRIGUES, M.; CORÁ, J. Management Zones Using Fuzzy Clustering Based On
Spatialtemporal Variability Of Soil And Corn Yield. Engenharia Agrícola, Jaboticabal, v.35, n.3, p.470-483, 2015.
SUSZEK, G.; SOUZA, E. G.; URIBE-OPAZO, M. A.; NÓBREGA, L. H. P. Determination of management zones from normalized and standardized equivalent productivity maps in the soybean culture. Engenharia Agrícola, Jaboticabal, v.32, n.5, p.895-905, 2012.
TAN, P.; STEINBACH, M.; KUMAR, V. Introdução ao datamining: mineração de dados, Rio de