http://www.uem.br/acta ISSN printed: 1679-9275
ISSN on-line: 1807-8621
Doi: 10.4025/actasciagron.v37i3.19474
Micromorphometric analysis of porosity changes in the surface
crusts of three soils in the Piracicaba region, São Paulo State, Brazil
Selene Cristina de Pierri Castilho1, Miguel Cooper2* and Laura Fernandes Simões da Silva1
1
Programa de Pós-graduação em Solos e Nutrição de Plantas, Escola Superior de Agricultura “Luiz de Queiroz”, Universidade de São Paulo, Piracicaba, São Paulo, Brazil. 2
Escola Superior de Agricultura “Luiz de Queiroz”, Universidade de São Paulo, Avenida Pádua Dias, 11, 13418-900, Piracicaba, São Paulo, Brazil. *Author for correspondence. E-mail: [email protected]
ABSTRACT. The aim of this study was to micromorphologically analyze modifications in soil porosity due to the occurrence of erosive rainfall events. Three types of soils, Typic Hapludox, Typic Hapludult and Rhodic Kandiudalf, were analyzed to determine their total porosity and the distribution and number of pores. The soils were tilled with a heavy disk and leveling harrow to ensure homogeneity of surface conditions at the beginning of the trial period and to simulate cropping conditions. The soils were kept
uncovered during the trial period, and rainfall events with intensities greater than 25 mm h-1 were recorded.
The results showed that all of the soils presented crust formation, influenced by the soil texture. NVef showed significant changes in total porosity, pore numbers and pore morphology, while LVAd and PVAd did not display marked modifications in these attributes.
Keywords: pore morphology, erosive rainfall, structural changes.
Análise micromorfométrica da evolução da porosidade em crostas superficiais de três
solos da região de Piracicaba, Estado de São Paulo
RESUMO. O objetivo deste trabalho é analisar micromorfologicamente as modificações na porosidade do solo devido a ocorrência de eventos chuvosos considerados erosivos. Foram avaliadas a porosidade total, distribuição e número de poros de um Latossolo Vermelho – Amarelo distrófico típico (LVAd) de textura média, Argissolo Vermelho – Amarelo distrófico típico (PVAd) de textura arenosa/média e Nitossolo Vermelho Eutroférrico típico (NVef) de textura argilosa. Os solos foram preparados com auxílio de grade pesada e niveladora para garantir condições iniciais homogêneas e para simular as condições de plantio adotada em sistemas convencionais de cultivo. O solo foi mantido descoberto e foram contabilizados
eventos chuvosos erosivos com intensidade superior a 25 mm h-1. Por meio das análises micromorfológicas
conclui-se que os três solos apresentam a formação de crostas superficiais, sendo estas influenciadas pela textura do solo. O NVef apresentou alterações significativas na porosidade total, número e morfologia dos poros, enquanto LVAd e PVAd não sofreram modificações significativas na porosidade total, número e morfologia dos poros.
Palavras-chave: morfologia dos poros, chuvas erosivas, mudanças estruturais.
Introduction
The formation of surface soil crusts has direct consequences for crop development and environmental quality because it reduces water infiltration into the soil and water availability for plant roots, prevents the emergence of seedlings, increases runoff and erosion (ASSOULINE, 2004), reduces agricultural yields and causes environmental impacts (TOUMA et al., 2011). Crusts are cohesive structures of variable thickness, formed by the reorganization and consolidation of soil particles, thereby changing the physical-hydraulic properties of the soil (BRANDÃO et al., 2006).
The susceptibility of aggregates to destruction caused by the impac of raindrops depends on soil
386 Castilho et al.
and continuity of pores in the soil, affecting water infiltration and its redistribution along the profile, thus promoting water erosion and increasing erosion rates (CARMI; BERLINER, 2008).
Evaluation of structural changes caused by management practices and soil crusting and quantification of attributes such as the pore size distribution can be achieved using micromorphometric methods (FOX et al., 2009), which are currently applied in a number of fields as a basis for soil morphology analyses (DALLA ROSA et al., 2012; PAGLIAI et al., 2004).
Based on the knowledge that rain and the intensive tillage practices applied in agricultural areas are the main factors leading to the degradation of soil structure and that soil structure is an important indicator of soil quality, this study aimed to monitor and evaluate porosity modifications in surface crusts in three types of soil under erosive rainfall events. Micromorphometric methods and image analysis were performed to better understand how rainfall events affect the reorientation and redistribution of soil pores.
Material and methods
The experiment was conducted in three soils in the Piracicaba region of São Paulo state, Brazil, in 5 x 5 m plots. The soils were a Typic Hapludox (LVAd) with a loamy texture and a 3% average slope; a Typic Hapludult (PVAd) with a loamy/sandy texture and a 4% average slope; and a Rhodic Kandiudalf (NVef) with a clayey texture and a 10% average slope.
Homogeneity of the initial conditions of each soil surface was achieved by preparing the plots using a leveling harrow, simulating planting conditions. The changes in the formation of surface crusts and soil porosity were monitored during the rainy season between November 2008 and May 2009. To ensure that rain would act directly on the soil surface, the plots remained uncovered during the entire trial period. Samplings were performed in four stages based on the sequence of erosive rainfall events. In this study, events with an intensity exceeding 25 mm h-1 were considered erosive
(GONÇALVES et al., 2006). Thus, four sampling periods were defined: after tillage (T0), after the occurrence of three erosive rainfall events (T3), after the occurrence of five erosive rainfall events (T5) and after the occurrence of ten erosive rainfall events (T10). The samplings were conducted in three replicates at 24 hours after a rainfall event to allow drainage of any excess water.
Rainfall data were provided by the automatic meteorological station of the Department of Biosystems Engineering, ESALQ/USP, College of
Agriculture “Luiz de Queiroz”, municipality of Piracicaba, São Paulo state, Brazil.
To characterize the soil surface layer, a particle size distribution analysis was performed on disturbed samples collected at depths of 0 to 0.05 m and 0.1 to 0.15 m according to the methodology proposed by Camargo et al. (1986).
Micromorphometric analyses were conducted to monitor the formation and evolution of surface crusts and changes in soil porosity caused by crusting and raindrops. Undisturbed soil samples were used for the micromorphometric analyses, which were collected in three replicates using cardboard boxes of 0.12 x 0.07 x 0.05 m. The samples were air dried for 15 days and then dried in an oven at 40°C with ventilation for 48 hours. Impregnation was carried out using polyester resin and the fluorescent pigment Tynopal OB (BASF® -
The Chemical Company, Germany) (MURPHY et al., 1977). Polished blocks were employed to obtain digital images for the analysis and quantification of soil porosity.
The blocks from each treatment (T0, T3, T5, T10) were illuminated with ultraviolet light and photographed using a charged couple device (CCD) digital camera (Sony®, model DFW-X700) attached
to a petrographic microscope for porosity quantification. Images were acquired and processed using Noesis Visilog 5.4 image analysis software (MURPHY et al., 1977). The obtained images were treated via image binarization using the threshold function of the Noesis Visilog 5.4 program, establishing the limits of black and white in each image and transforming it from an RGB (red, green and blue) image to a black and white image. After binarization, the images were filtered using the open and close function, in which the image is opened and closed by 1 pixel, and any object smaller than 4 pixels is erased. This function ensures that all possible noise caused by the threshold is eliminated. After determining the basic and derived variables for the pores, they were classified by size and shape using the macro-functions developed by Juhász et al. (2007) in Visual Basic language in Microsoft Excel®.
From the total porosity data, it is possible to classify the soil according to Pagliai et al. (2004), who categorizes soil as medium dense when it presents a total porosity below 10%; as moderately porous when it shows a total porosity of 10-25%; as porous when the total porosity is 25-40%; and as extremely porous when it displays a total porosity above 40%.
To investigate the differences between the obtained data, a mean comparison analysis was carried out. The experimental design consisted of random blocks, considering the soil types as blocks, and the treatments were represented by the rainfall events. The Duncan test was used at a 5% probability, and statistical analyses were performed using SAS® statistical software.
Results and discussion
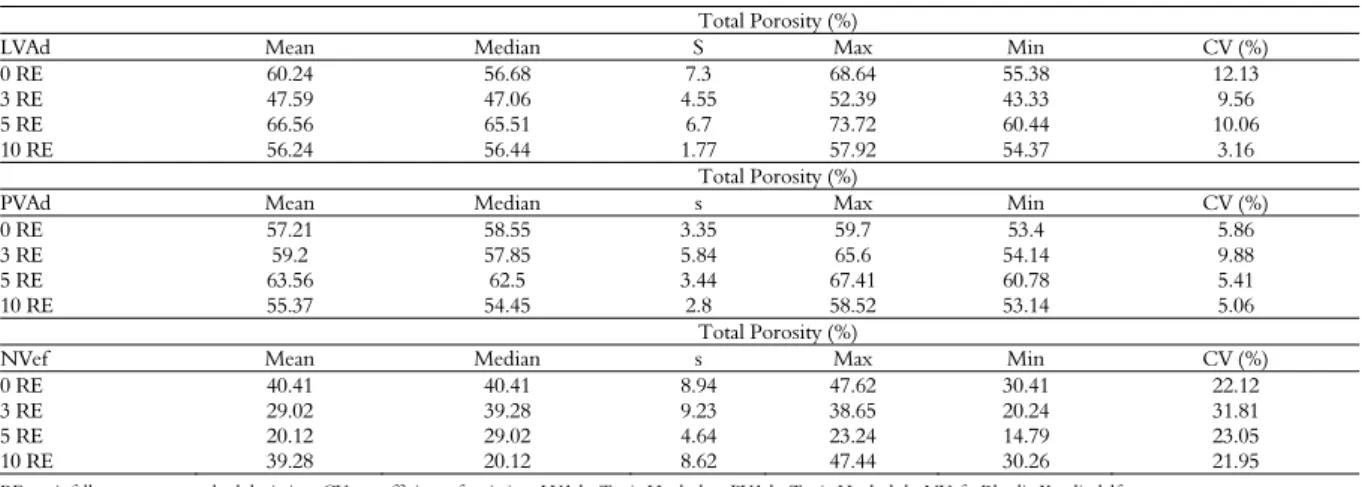
In the descriptive analysis of the total porosity data (Table 1), the variability in the data observed for both LVAd and PVAd was considered low (CV < 12%), while the variability for NVef was considered intermediate (12% < CV < 60%) (WARRICK; NIELSEN, 1980). This analysis also showed that the distribution of the total porosity data was symmetrical, with a variability of 1% being observed between the mean and the median, resulting in a mean that adequately represented the dataset.
The results of the variance analysis of the total porosity data from the three analyzed soils showed that the total porosity of LVAd did not change significantly with the occurrence of rainfall, except at T3, when the average total porosity was reduced from approximately 60% (T0, T5 and T10) to approximately 47% (T3) (Figure 1). For PVAd, at T0, T3 and T5, no statistically significant changes were observed in the total porosity, which remained at approximately 60%. A significant reduction of the total porosity was observed only after T10, when it decreased to 55% (Figure 2). NVef showed the lowest mean total porosity, with
a statistically significant difference being observed at T5, when the total porosity was reduced by half, from approximately 40% (T0) to approximately 20% (T5) (Figure 3).
Although some differences in total porosity were observed with the occurrence of the rainfall events, it is worth noting that throughout the trial period, both LVAd and PVAd were classified as extremely porous, while NVef changed from a porous to a moderately porous condition (PAGLIAI et al., 2004).
When the total soil porosity during the trial period, it is clear that both the LVAd and PVAd have similar porosity evolutions undergoing seemingly random changes that can be explained by the low clay content in the soils. At the beginning of the experiment (T0), the total porosity of LVAd was considered high (60%) reducing after the first three rains, reaching the value of 47% (T3).
Then, after the occurrence of five rainfall events, an increase in porosity to 66% is observed (T5) and a following decrease to approximately 56% after the occurrence of ten rainfall events (T10) (Table 1).
Figure 1. Total porosity of LVAd. Means followed by the same capital letter do not differ at 5% of probability.
Table 1. Descriptive statistical analysis on data of total soil porosity.
Total Porosity (%)
LVAd Mean Median S Max Min CV (%)
0 RE 60.24 56.68 7.3 68.64 55.38 12.13
3 RE 47.59 47.06 4.55 52.39 43.33 9.56
5 RE 66.56 65.51 6.7 73.72 60.44 10.06
10 RE 56.24 56.44 1.77 57.92 54.37 3.16
Total Porosity (%)
PVAd Mean Median s Max Min CV (%)
0 RE 57.21 58.55 3.35 59.7 53.4 5.86
3 RE 59.2 57.85 5.84 65.6 54.14 9.88
5 RE 63.56 62.5 3.44 67.41 60.78 5.41
10 RE 55.37 54.45 2.8 58.52 53.14 5.06
Total Porosity (%)
NVef Mean Median s Max Min CV (%)
0 RE 40.41 40.41 8.94 47.62 30.41 22.12
3 RE 29.02 39.28 9.23 38.65 20.24 31.81
5 RE 20.12 29.02 4.64 23.24 14.79 23.05
10 RE 39.28 20.12 8.62 47.44 30.26 21.95
388 Castilho et al.
Figure 2. Total porosity of PVAd. Means followed by the same capital letter do not differ at 5% of probability.
Figure 3. Total porosity of NVef. Means followed by the same capital letter do not differ at 5% of probability.
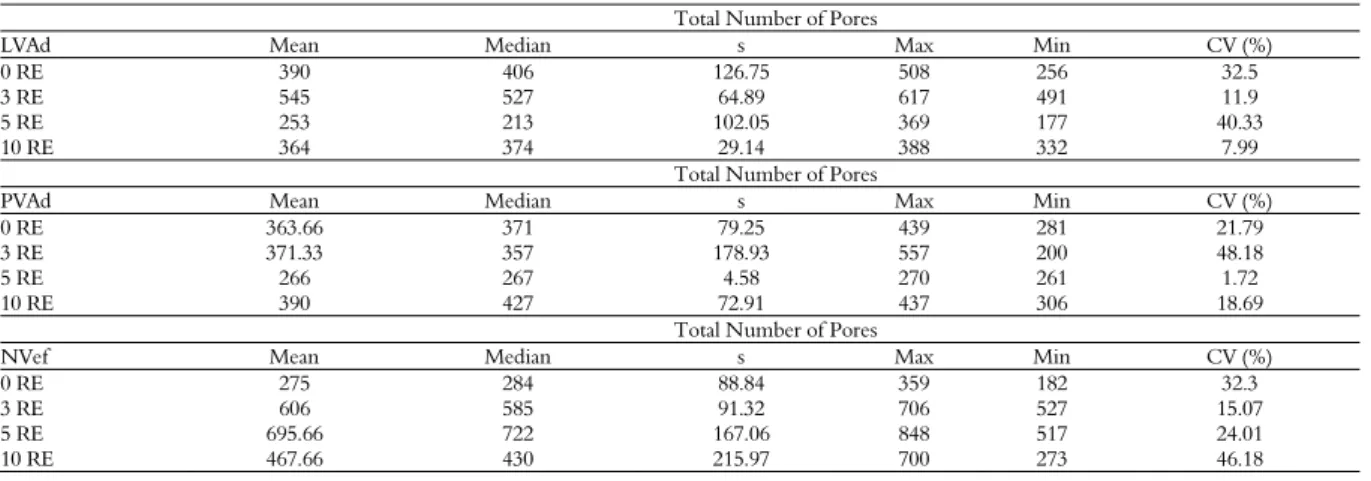
Following the same trend of random changes in total porosity in LVAd , the pore number also changed with the occurrence of rainfall, ranging from 390 pores at T0 to 545 at T3, 253 at T5 and 364 at T10 (Table 2).
In order to better understand the random behavior of soil porosity during the rainfall events, focus was placed on the particle size analysis of the
soils, given that the amount of clay, silt and sand found in the soil can make it more or less susceptible to the action of erosive events (LE BISSONNAIS, 1996). The particle size analysis performed for the topsoil (0 – 0.05 m) and indicated similar clay, silt and sand contents in LVAd and PVAd of 200, 70 and 700 g kg-1, respectively. For
NVef, there was an increase in the clay content to 500 g kg-1 and a reduction of the sand content to
approximately 400 g kg-1.
The soil tillage performed to prepare the plots at the beginning of the trial period, together with the low clay content in the surface layers of LVAd and PVAd (200 g kg-1), favored soil pulverization in the
surface layer, altering its structure and facilitating the detachment and mobilization of particles during the occurrence of rainfall events (BERTOL et al., 2010). Thus, the behavior of soil porosity observed in the micromorphological analysis could be explained by the remobilization of less-structured material due to the impact of raindrops on the soil, which directly affects its structure, sometimes thickening or unpacking the soil matrix.
The difference in the clay content of NVef in relation to the other two soils can explain the differences in total soil porosity behavior associated with the occurrence of rainfall events. The higher clay content found in the surface horizon (500 g kg-1) was responsible for the observed changes in
porosity, as the soil surface undergoes compression and compaction through the impact of raindrops, increasing soil density and reducing its total porosity (FOX et al., 2004). The increase in total porosity observed at T10 was attributed to the appearance of fissures on the surface of NVef (Figure 4), generated by the compression and expansion of the soil material caused by the repeated wetting and drying cycles in the soil (COOPER et al., 2010).
Table 2. Descriptive statistical analysis for data of total number of pores of the soils.
Total Number of Pores
LVAd Mean Median s Max Min CV (%)
0 RE 390 406 126.75 508 256 32.5
3 RE 545 527 64.89 617 491 11.9
5 RE 253 213 102.05 369 177 40.33
10 RE 364 374 29.14 388 332 7.99
Total Number of Pores
PVAd Mean Median s Max Min CV (%)
0 RE 363.66 371 79.25 439 281 21.79
3 RE 371.33 357 178.93 557 200 48.18
5 RE 266 267 4.58 270 261 1.72
10 RE 390 427 72.91 437 306 18.69
Total Number of Pores
NVef Mean Median s Max Min CV (%)
0 RE 275 284 88.84 359 182 32.3
3 RE 606 585 91.32 706 527 15.07
5 RE 695.66 722 167.06 848 517 24.01
10 RE 467.66 430 215.97 700 273 46.18
Figure 4. Fissures on the surface of NVef.
The observed changes in total soil porosity contribute to understanding how the evolution of rainfall events affects soil porosity, especially in soils with a higher clay content. However, analysis of total porosity alone is not sufficient to reveal the effect of rainfall events on the physical quality of the soil, as rain may affect not only total porosity (block area occupied by pores) but also the types of pores that occur in the soil, thus modifying the water dynamics in the soil profile. According to Sun et al.
(2008), the greatest loss of porosity during rainfall events corresponds to the loss of elongated pores, which was not shown in the analysis of total porosity. Therefore, a descriptive analysis of pore size and shape was performed in the studied soils (Figures 5, 6 and 7).
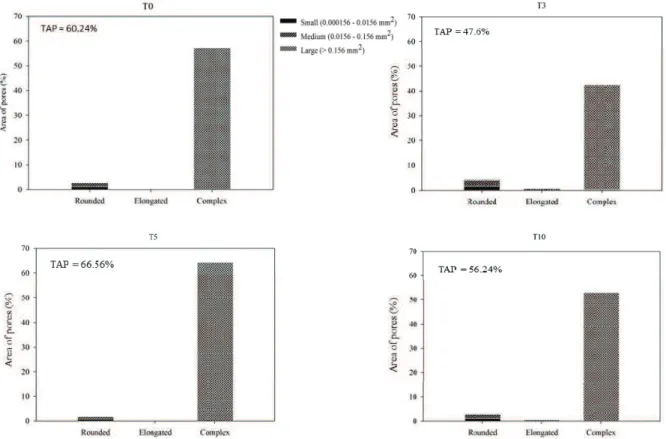
LVAd showed a predominance of large complex pores, with pores larger than 0.156 mm2 and an
absence of elongated pores being observed. The total porosity in this soil was mainly contributed by large complex, medium rounded and small pores. With the occurrence of rainfall events, the complex porosity varied in terms of the occupied area, but without altering the sizes of the complex pores, which generally continued to be large pores (greater than 0.156 mm2).
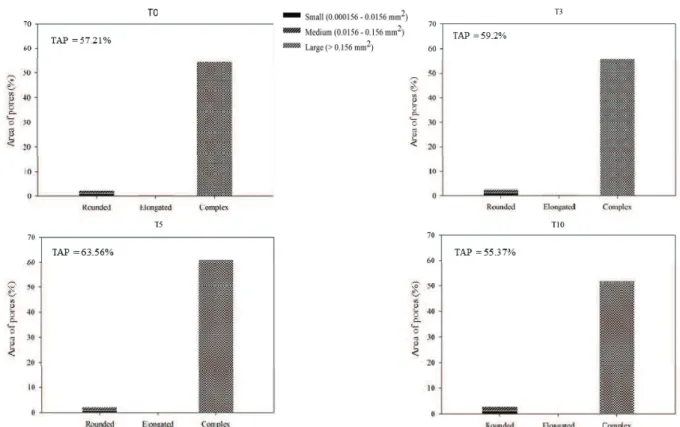
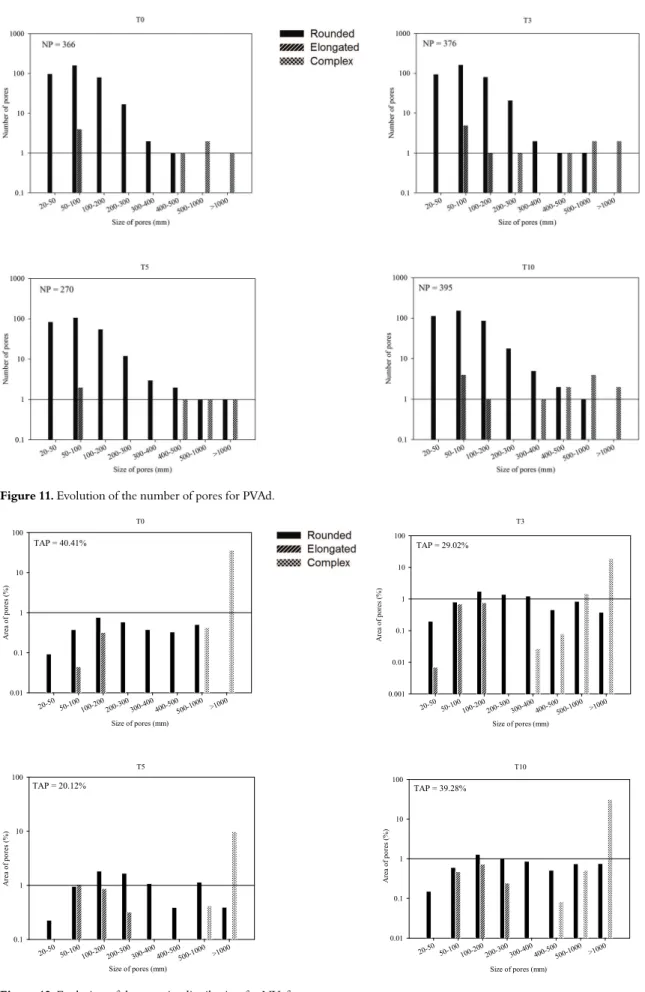
For PVAd, a predominance of large complex pores was observed, with very few effective changes in the area occupied by these pores being recorded. At T10, an increase in the proportion of rounded porosity was detected. The increase in rounded pores associated with ten erosive rainfall events was related to structural degradation and soil compaction (RINGROSE-VOASE; BULLOCK, 1984), which affects water movement in the profile due to the low connectivity between pores of this type.
390 Castilho et al.
Figure 6. Evolution of the size and type of pores with the occurrence of rainfall events (T0, T3, T5 and T10) for PVAd.
Figure 7. Evolution of the size and type of pores with the occurrence of rainfall events (T0, T3, T5 and T10) for NVef.
NVef displayed a predominance of large complex pores at T0, which suffered a decrease in area as rainfall events occurred. In addition to the loss of large complex pores, increases in the number of
became smaller and less interconnected. At T10, an increase in large complex pores was noted due to the occurrence of fissures caused by the contraction and expansion processes associated with the wetting and drying cycles in the soil; as these pores coalesced, the soil classification shifted to complex porosity.
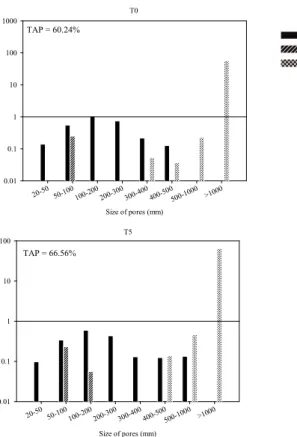
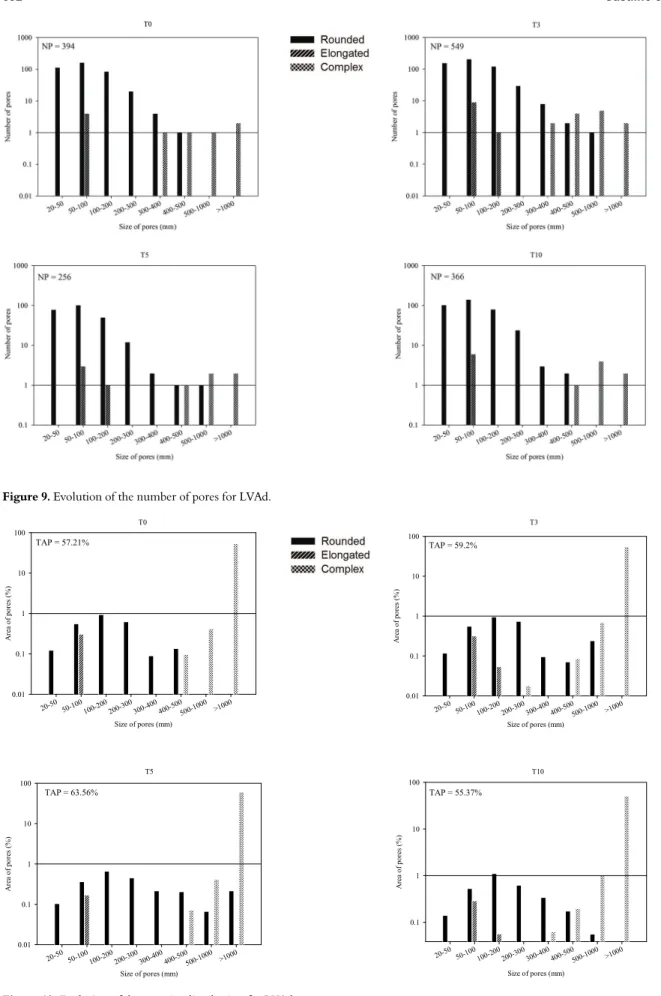
The changes in pore type and morphology due to the impact of erosive rainfall events were best understood based on the pore distribution analysis, which provided data on the area (Figures 8, 10 and 12) and the number of pores (Figures 9, 11 and 13) based on the observed pore shapes (round, elongated or complex).
LVAd showed a high total porosity and large number of pores at T0 (Figure 8 and 9). For all rainfall events, a small number of complex pores was observed to occupy a large area of the blocks of this soil, indicating that these pores are interconnected. After the rainfall events (T3, T5 and T10), slight variations were observed in large complex pores (> 1000 μm) in relation to the total block area. However, this small variation did not represent a significant change in total soil porosity.
The redistribution and remobilization of the soil particles caused by the impact of raindrops on the surface of LVAd were not sufficient to cause significant changes in total soil porosity (Table 2) or in the shape and arrangement of pores (Figures 8 and 9).
PVAd presented high total porosity at T0 (Figure 10), with interconnected pores being observed. Similar to LVAd, the sequence of rainfall events caused minor changes in the morphology, distribution and surface area occupied by pores in this soil (Table 2, Figures 10 and 11).
Among the three analyzed soils, major changes in porosity were observed for NVef, with a reduction of the area occupied by pores and changes in the morphology and distribution of pores being recorded for each sequence of rainfall events, with the exception of T10 (Figures 12 and 13). A reduction in porosity can be explained by the redistribution of detached particles and soil compression due to the impact of raindrops on the surface (FOX et al., 2004), thus reducing the number of complex and elongated pores. At T10, an increase of complex porosity was observed, which could be attributed to the coalescence of elongated pores formed by intense fissuration of the soil matrix due to the wetting and drying cycles that occur during rainfall events (Figure 4). Although the changes in porosity recorded in NVef were greater than in the other soils, no significant differences were detected for this parameter (Table 2).
T0
Size of pores (mm)
20-5050-100100-20 0 200-30 0 300-40 0 400-50 0 500-10 00 >1000
A rea o f po res ( % ) 0.01 0.1 1 10 100 1000
TAP = 60.24%
T3
Size of pores (mm)
20-5050-100100-20 0 200-30 0 300-40 0 400-50 0 500-10 00 >1000 A re a o f p o re s (% ) 0.01 0.1 1 10 100
TAP = 47.59%
T5
Size of pores (mm)
20-5050-100100-20 0 200-30 0 300-40 0 400-50 0 500-10 00 >1000 A rea o f po res ( % ) 0.01 0.1 1 10 100
TAP = 66.56%
T10
Size of pores (mm)
20-5050-100100-20 0 200-30 0 300-40 0 400-50 0 500-10 00 >1000 A rea o f po res (% ) 0.01 0.1 1 10 100
TAP = 56.25%
392 Castilho et al.
Figure 9. Evolution of the number of pores for LVAd.
T0
Size of pores (mm)
20-50 50-100100-20 0
200-30 0
300-40 0
400-50 0
500-10 00
>1000
A
re
a o
f p
o
re
s
(%)
0.01 0.1 1 10 100
TAP = 57.21%
T3
Size of pores (mm)
20-5050-100100-20 0
200-30 0
300-40 0
400-50 0
500-10 00
>1000
A
re
a o
f p
o
res
(%
)
0.01 0.1 1 10 100
TAP = 59.2%
T5
Size of pores (mm)
20-50 50-100100-20 0
200-30 0
300-40 0
400-50 0
500-10 00
>1000
A
re
a o
f p
o
re
s
(%)
0.01 0.1 1 10 100
TAP = 63.56%
T10
Size of pores (mm)
20-5050-100100-20 0
200-30 0
300-40 0
400-50 0
500-10 00
>1000
A
rea
o
f p
o
res
(%)
0.1 1 10 100
TAP = 55.37%
Figure 11. Evolution of the number of pores for PVAd.
T0
Size of pores (mm)
20-5050-100100-20 0
200-30 0
300-40 0
400-50 0
500-10 00
>1000
A
re
a
o
f p
ore
s (%
)
0.01 0.1 1 10 100
TAP = 40.41%
T3
Size of pores (mm)
20-5050-100100-20 0
200-30 0
300-40 0
400-50 0
500-10 00
>1000
A
re
a o
f
p
o
res
(%
)
0.001 0.01 0.1 1 10 100
TAP = 29.02%
T5
Size of pores (mm)
20-50 50-100100-20 0
200-30 0
300-40 0
400-50 0
500-10 00
>1000
A
rea
o
f p
o
re
s (%
)
0.1 1 10 100
TAP = 20.12%
T10
Size of pores (mm)
20-50 50-100100-20 0
200-30 0
300-40 0
400-50 0
500-10 00
>1000
Ar
ea
o
f p
o
re
s (
%
)
0.01 0.1 1 10 100
TAP = 39.28%
394 Castilho et al.
Figure 13. Evolution of the number of pores for NVef.
Conclusion
The three analyzed soils displayed surface crust formation. However, the soil texture was an important factor in differentiating the crust morphology.
NVef showed the most significant changes in total porosity and pore numbers and morphology due to the crust formation caused by erosive rainfall events.
The crust formation observed on the surface of LVAd and PVAd did not significantly alter the total porosity or the number and morphology of pores.
Acknowledgements
The authors wish to thank FAPESP (Foundation for Research Support of São Paulo state) for financing this project (Project 2006/57233-3) and CNPq for providing scholarships. We thank Carlos Eduardo Pinto Juhász (in memoriam), Pedro Lian D. B. Castanho, Lucas P. R. Conte, Raul S. Toma, Jaqueline D. Rosa, João Medeiros, Tatiana Rittl, Ariane Teato, Renata C. Bovi, Gabriela Rabello and Renata S. Momoli for their support of this research.
References
ASSOULINE, S. Rainfall-induced soil surface sealing: a critical review of observations, conceptual models and
solutions. Vadose Zone Journal, v. 3, n. 3, p. 570-591, 2004.
BERTOL, I.; VÁZQUEZ, E. V.; GONZÁLEZ A. P.; COGO, N. P.; LUCIANO, R. V.; FABIAN, E. L. Sedimentos transportados pela enxurrada em eventos de
erosão hídrica em um Nitossolo háplico. Revista Brasileira
de Ciência do Solo, v. 34, n. 1, p. 245-252, 2010.
BRANDÃO, V. S.; SILVA, D. D.; RUIZ, H. A.; PRUSKI, F. F.; SCHAEFER, C. E. G. R.; MARTINEZ, M. A.; MENEZES, S. J. M. C. Resistência hidráulica da crosta
formada em solos submetidos a chuvas simuladas. Revista
Brasileira de Ciência do Solo, v. 30, n. 1, p. 13-21, 2006.
BULLOCK, P.; FEDOROFF, N.; JONGERIUS, A.;
STOOPS, G.; TURSINA, T. Handbook for soil thin
section description. Albrington: Waine Research, 1985. CAMARGO, O. A.; MONIZ, A. C.; JORGE, J. A.;
VALADARES, J. M. A. S. Métodos de análise química,
mineralógica e física de solos do Instituto Agronômico de Campinas. Campinas: IAC, 1986. CARMI, G.; BERLINER, P. The effect of soil crust on the generation of runoff on small plots in an arid
environment. Catena, v. 74, n. 1, p. 37-42, 2008.
COOPER, M.; VIDAL TORRADO, P.; CHAPLOT, V. Origin of microaggregates in soils with ferralic horizons.
Scientia Agricola, v. 62, n. 3, p. 256-263, 2005.
COOPER, M.; VIDAL-TORRADO, P.; GRIMALDI, M. Soil structure transformations from ferralic to nitic horizons on a toposequence in southeastern Brazil.
DALLA ROSA, J.; COOER, M.; DARBOUX, F.; MEDEIROS, J. C. Soil roughness evolution in different tillage systems under simulated rainfall using a
semivariogram-based index. Soil & Tillage Research,
v.124, p. 226–232, 2012.
FOX, D. M.; BRYAN, R. B.; FOX, C. A. Changes in pore characteristics with depth for structural crusts.
Geoderma, v. 120, n. 1-2, p. 109-120, 2004.
FOX, S. C.; MILLS, A. J.; POCH, R. M. Micromorphology of surface crusts in the Knersvlakte,
South Africa. Journal of Mountain Science, v. 6, n. 2,
p. 189-196, 2009.
GONÇALVES, F. A.; DEMETRIUS, D. S.; PRUSKI, F. F.; CARVALHO, D. F.; CRUS, E. F. Índices e especialização da erosividade das chuvas para o Estado do
Rio de Janeiro. Revista Brasileira de Engenharia
Agrícola e Ambiental, v. 10, n. 2, p. 169-276, 2006. HAO, H.; HARTMANN, C.; APICHART, J.; SIWAPORN, S.; PROMSAKHA, S.; RICHARD, G.; BRUAND, A.; DEXTER, A. R. Slumping dynamics in tilled sandy soils under natural rainfall and experimental
flooding. Soil and Tillage Research, v. 114, n. 1,
p. 9-17, 2011.
HILLEL, D. Introduction to environmental soil
physics. New York: Elsevier Academic Press, 2004. JUHÁSZ, C. E. P.; COOPER, M.; CURSI, P. R.; KETZER, A. O.; TOMA, R. S. Savanna woodland soil
micromorphology related to water retention. Scientia
Agricola, v. 64, n. 4, p. 344-354, 2007.
LE BISSONNAIS, Y. Agregate stability and assessment of soils crustability and erodibility: I. Theory and
methodology. European Journal of Soil Science, v. 47,
n. 47, p. 425-437, 1996.
MURPHY, C. P.; BULLOCK, P.; TURNER, R. H. The measurement and characterization of voids in soil thin sections by image analysis. Part I. Principles and
techniques. Journal of Soil Science, v. 28, n. 3,
p. 498-508, 1977.
PAGLIAI, M.; VIGNOZZI, N.; PELLEGRINI, S. Soil
structure and the effect of management practices. Soil
and Tillage Research, v. 79, n. 1, p. 131-143, 2004. RINGROSE-VOASE, A. J.; BULLOCK, P. The automatic recognition and measurement of soil types by
image analysis and computer programs. Journal of Soil
Science, v. 35, n. 4, p. 673-684, 1984.
SUN, Z.; KANG, Y.; JIANG, S. Effects of water application intensity, drop size and water application amount on the characteristics of topsoil pores under
sprinkler irrigation. Agricultural Water Management,
v. 95, n. 7, p. 869-876, 2008.
TOUMA, J.; RACLOT, D.; AL-ALI, Y.; ZANTE, P.; HAMROUNI, H.; DRIDI, B. In situ determination of
the soil surface crust hydraulic resistance. Journal of
Hidrology, v. 403, n. 3, p. 253-260, 2011.
WARRICK, A. W.; NIELSEN, D. R. Spatial variability of soil physical properties in the field. In: HILLEL, D. (Ed.).
Applications of soil physics. Part 2. New York: Academic Press, 1980.
Received on December 18, 2012. Accepted on April 23, 2013.