E-mail: [email protected]
Rev. Ambient. Água vol. 10 n. 3 Taubaté – Jul. / Sep. 2015
Chemical and microbiological analysis of public school water in
Uberaba Municipality
doi: 10.4136/ambi-agua.1464
Received: 15 Jul. 2014; Accepted: 28 Apr. 2015
Sérgio Marcos Sanches1*; Jailda Maria Muniz2; Célia Passos3; Eny Maria Vieira4
1Instituto Federal do Triângulo Mineiro (IFTM), Campus Ituiutaba, Ituiutaba, MG, Brasil 2Instituto Federal do Triângulo Mineiro (IFTM), Campus Uberaba, Uberaba, MG, Brasil
3Universidade Federal de Uberlândia(UFU) Campus Pontal, Ituiutaba, MG, Brasil 4Universidade de São Paulo (USP), São Carlos, SP, Brasil
*Corresponding author: e-mail:[email protected], [email protected], [email protected], [email protected]
ABSTRACT
This study evaluated the quality of water consumed by schoolchildren in the city of Uberaba, relying upon chemical analyzes to determine the levels of free-residual chlorine and levels of chromium, copper, manganese, lead and cadmium. Microbiological analysis was also performed in order to determine total coliforms and Escherichia coli, using the values established by Ordinance n0. 2914 of 2011 of the Ministry of Health as parameters for safe drinking water. Water samples were analyzed from the drinking fountains and kitchen faucets of eight public schools that serve children aged 0-5 years. Sampling was conducted quarterly from December 2011 to September 2012, resulting in four collections. The results revealed the presence of Escherichia coli and total coliforms above the valued permitted by legislation in more than 50% of the samples. It was also observed that concentrations of free-residual chlorine were below the minimum value required by law in nearly half of the samples analyzed. In relation to the concentration of metals, some samples had water contents of copper, cadmium, chromium, manganese and lead above the permissible levels. Statistical tests revealed that when analyzing the period of sampling, only the values for the concentrations of free-residual chlorine, chromium and lead showed no significant difference (p> 0.05). The results show the need for corrective actions at the water supply point for the school population, in addition to monitoring and controlling the quality of water for human consumption.
Keywords: chemical analysis, drinking water, microbiological analyzes.
Análise química e microbiológica da água de escolas públicas
municipais de Uberaba
RESUMO
das análises microbiológicas para determinação de coliformes totais e Escherichia coli, tomando-se como parâmetro para água potável, os valores estabelecidos pela Portaria nº 2.914 de 2011 do Ministério da Saúde (Brasil, 2011). Foram analisadas amostras de água provenientes de bebedouros e torneiras da cozinha de oito instituições de ensino infantil da rede pública municipal que atendem crianças com a faixa etária de 0 - 5 anos. As amostragens foram realizadas em períodos trimestrais compreendidos entre dezembro de 2011 e setembro de 2012, resultando em quatro coletas. Os resultados obtidos revelaram a presença de Escherichia coli e coliformes totais, acima dos valores permissíveis pela legislação em mais de 50% das amostras analisadas. Foi verificado ainda, teor de cloro residual livre abaixo do valor mínimo exigido pela legislação vigente em quase metade das amostras analisadas. No que se refere à concentração de metais, algumas amostras de água apresentaram teores de cobre, cádmio, cromo, manganês e chumbo acima do permitido. Os testes estatísticos revelaram que, quando analisado o período de realização das amostragens, apenas os valores referentes à concentração de cloro residual livre, cromo e chumbo não apresentaram diferença significativa (p>0,05). Os resultados obtidos revelam a necessidade de ações corretivas nos pontos de fornecimento de água para a população escolar, além do monitoramento e controle da qualidade da água para consumo humano, tanto pelos gestores escolares como pelas autoridades sanitárias.
Palavras-chave: água potável, análises microbiológicas, análises químicas.
1. INTRODUCTION
Drinking water is vital to the survival of all living organisms and the functioning of ecosystems, communities and economies. However, in the last decade, water quality worldwide is being threatened due to population increases, agricultural and industrial activities (Khan et al., 2013; Baird, 2002). These changes resulted in climate change, directly affecting the global hydrological cycle.
A supply of good quality water that is adequate, reliable and affordable to the population is closely linked to human health. However, according to the Environmental Company of São Paulo (2008), part of the available fresh water on the planet is in some stage of contamination (Cetesb, 2008).
According to the World Health Organization - WHO, at present, 1.2 billion people do not have drinking water, and 80% of diseases and 30% of deaths worldwide are caused by contaminated water (Hênio, 2011). Already, as a result of poor water quality, the study by the UN shows that at least 1.8 billion children under five years old have died to date (Giraldi, 2010).
In several educational institutions, waterborne diseases have become common. This may be related to contamination in water tanks or infiltration in pipes. Therefore, the monitoring and further analysis of the quality of waters originating from faucets and drinking fountains for school consumption becomes important.
2. MATERIAL AND METHODS
2.1. Collection of water samples for chemical analysis
Rev. Ambient. Água vol. 10 n. 3 Taubaté – Jul. / Sep. 2015
2.2. Collection of water for microbiological analysis
The collection site was sanitized with 70% ethanol and then flamed to avoid interference with the results due to external contamination. Then, the water samples used for microbiological analyzes were collected from the schools’ drinking fountains and kitchen faucets in amber bottles, previously autoclaved, containing 0.1 mL of sodium thiosulfate to 10% for every 100 mL of water collected.
2.3. Analysis of free residual chlorine
The determination of free-residual chlorine was taken by the direct method using a hand photometer checker chlorine-free, ranging from 0.00 to 2.50 mg L-1 - Model HI 701 at the collection site.
2.4. Metals analysis
The samples passed through the digestion process by Method 3005A of the Environmental Protection Agency for the analysis of metals (USEPA, 1992; Nikaido et al., 2010). Fifty mL aliquots of a water sample tube were added to the digester block to which was added 2 mL of HNO3 and 5 mL of HCl. The temperature was then raised to 110ºC and
maintained until the sample volume was reduced to 15 mL under reflux. After cooling, the samples were transferred to a 50 mL volumetric flask, and the volume was then supplemented with Mille-Q water. The sample was filtered and kept at 4 0 C until further analysis.
Analyses of BP, Man, Cr, Cu and Cod metals were performed at the Institute of Chemistry of São Carlos - IQSC / USP of São Carlos, in an inductively coupled plasma spectrometer (ICP-OES).
2.5. Analysis of bacteria
Laboratory analyses of water samples collected for the assessment of total and thermos-tolerant coliforms were made by the Technical Membrane Filtering in accordance
with the procedures of "Standard Methods for the Examination of Water and Wastewater'' and of the Company of Environmental Sanitation Technology (APHA et al., 2005; Cetesb, 2006).
Samples were filtered through a suitable membrane filter and sterile with porosity (porosity 0.45 µm and 47 mm in diameter). The filtration was performed on a device contained in a filter funnel with lid, membrane and receiver flask.
2.6. Analysis of results
As a reference guide for analysis of the results, we used the 2914 Ordinance of the Ministry of Health, which establishes the procedures and responsibilities relating to the control and supervision of water quality for human consumption and its potability standards and other provisions (Brasil, 2011).
2.7. Statistics
For the statistical analysis of the final results, the resulting values for all analyses were copied into a database in Microsoft Excel 2003 version program and transferred to the software ASSISTAT 7.6-beta version 2008 for testing normality and homogeneity of data. The results obtained for each of the variables analyzed showed no homogeneity among themselves checked when the period to measurements, so these values were subjected to non-parametric Kruskal-Wallis test (ANOVA), ASSISTAT software - 7.6-beta version in
3. RESULTS AND DISCUSSION
3.1. Free residual chlorine
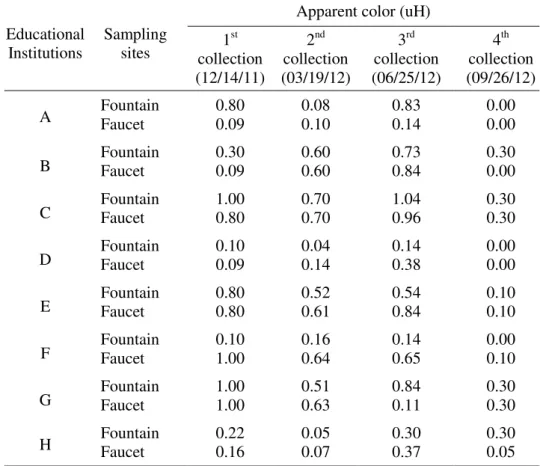
The values of free residual chlorine obtained in the analysis of water sampled from the fountains of the schools in the four stages of data collection ranged from 0.00 to 1.04 mg L-1, while levels of free residual chlorine in water samples from faucets of the eight schools ranged from 0.00 to 1.00 mg L-1, as showed in Table 1.
Table 1. Values of free residual chlorine obtained from the analyses of water samples used for consumption by schoolchildren in eight schools in Uberaba, Minas Gerais.
Educational Institutions
Sampling sites
Apparent color (uH) 1st
collection (12/14/11)
2nd collection (03/19/12)
3rd collection (06/25/12)
4th collection (09/26/12)
A Fountain Faucet 0.80 0.09 0.08 0.10 0.83 0.14 0.00 0.00
B Fountain Faucet 0.30 0.09 0.60 0.60 0.73 0.84 0.30 0.00
C Fountain Faucet 1.00 0.80 0.70 0.70 1.04 0.96 0.30 0.30
D Fountain Faucet 0.10 0.09 0.04 0.14 0.14 0.38 0.00 0.00
E Fountain Faucet 0.80 0.80 0.52 0.61 0.54 0.84 0.10 0.10
F Fountain Faucet 0.10 1.00 0.16 0.64 0.14 0.65 0.00 0.10
G Fountain Faucet 1.00 1.00 0.51 0.63 0.84 0.11 0.30 0.30
H Fountain Faucet 0.22 0.16 0.05 0.07 0.30 0.37 0.30 0.05
The results obtained in this study revealed that 100% of the water samples collected in water fountains and kitchen faucets conformed to the standards required by Ordinance no. 2914 of 2011 of the Ministry of Health, 2.0 mg L-1, for free residual chlorine variable (Brasil, 2011). However, with respect to the legal minimum value of 0.2 mg L-1 regarding the concentration of free residual chlorine, 40.62% of the samples from the kitchen taps and 31.25% of samples from the water fountains failed to meet the recommended standard.
Also, regarding the concentration of free residual chlorine, no significant difference (p> 0.05) was found between the sampling periods for the water fountains and kitchen faucets of the eight schools selected for the study; therefore, no statistical analysis was performed for this variable.
3.2. Metals
Rev. Ambient. Água vol. 10 n. 3 Taubaté – Jul. / Sep. 2015
Humans can be exposed to metals from several sources, and water is a main pathway of contamination, so there is a natural concern about the good quality water from the spring to the point of consumption (Chakrabarty and Sarma, 2010).
This study examined the levels of lead (Pb), manganese (Mn), chromium (Cr), copper (Cu) and cadmium (Cd) present in the water samples analyzed. The results revealed copper concentrations above those permitted by legislation in 3.125% of the samples analyzed. In 51.56% of the samples analyzed, the levels of cadmium exceeded the recommendations of the Ministry of Health. Further, 12.5%, 7.82% and 45.31% of the samples did not conform to the recommendations of Ordinance 2914 / MS for concentrations of Mn, Pb and Cr, respectively (Brasil, 2011).
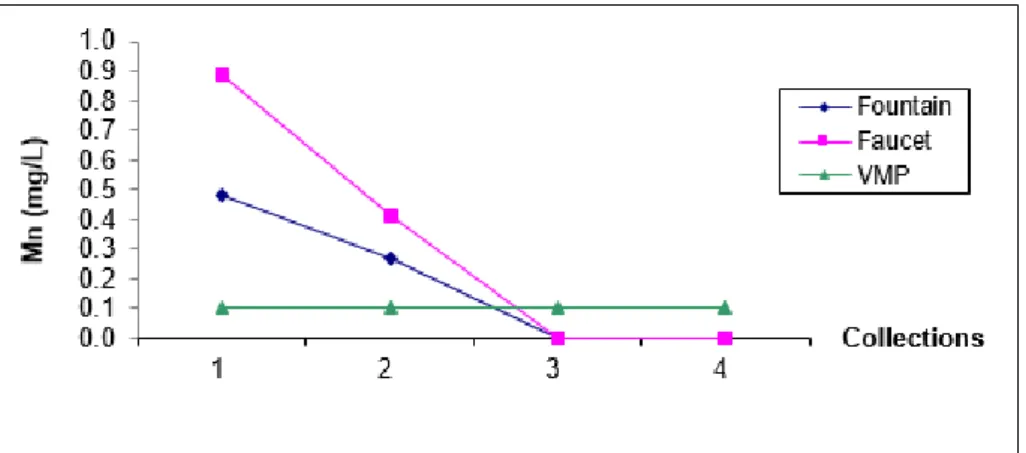
Figure 1 shows the average rating of Mn present in the water samples from drinking fountains and kitchen faucets from the schools selected for this research over the four collection periods. The values exceed the maximum allowable value (MAV) of 0.1 mg L-1 for drinking water.
Figure 1. Variation of Mn concentrations in water samples from drinking fountains and kitchen faucets from eight institutions of child education throughout the four collections undertaken from December 2011 to September 2012.
It was found that, in relation to samples of water from the drinking fountains and kitchen faucets from the eight schools selected for the survey, the values for the concentration of manganese in the first collection differed statistically from the other collections, and presented a higher average value. The third and fourth collections did not differ significantly from each other; however, the first and the second collections found smaller average concentrations of Mn than those previously mentioned. In relation to the variation of the concentrations of Cu present in water samples from drinking fountains and kitchen faucets from the eight schools, it was observed that, when analyzing water samples from drinking fountains, there was no significant difference with respect to the sampling period. However, when analyzing water samples from the taps in the kitchen, it was observed that the copper concentrations differed among them (p <0.05).
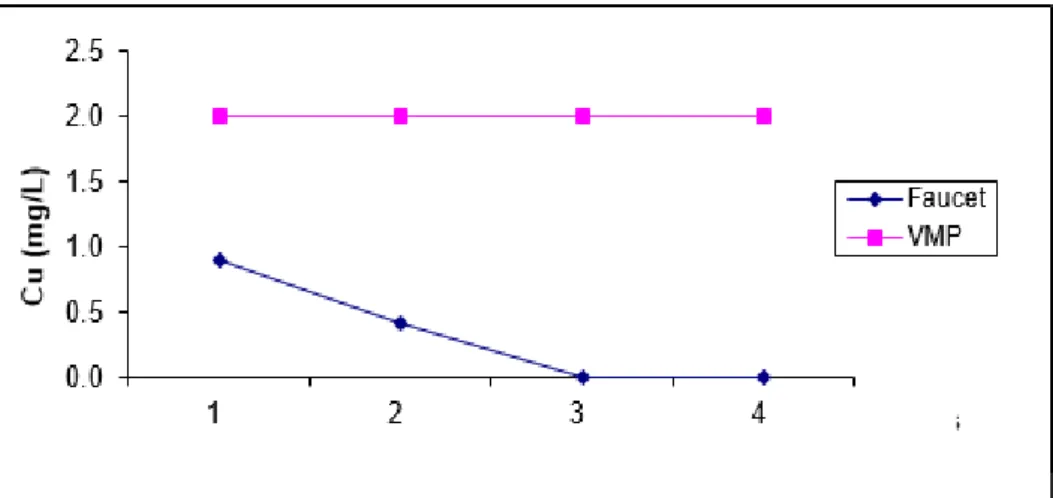
Figure 2 shows the medium values of the concentration of Cu present in water samples from kitchen taps from the eight schools selected for the research, beyond the maximum allowed value (2 mg L-1) established by current legislation for drinking water.
When analyzing water samples from the kitchen faucets of primary schools selected for the survey, it was observed that the third sample showed a significant difference in the variation of Cd concentrations from the other samples, with an average value higher than the other collections. On the other hand, the first and the second collections did not differ significantly from each other, but differed from the other collections, presenting a lower average concentration of Cd.
Figure 2. Variation of Cu concentration in water samples from faucets from eight schools during the four collections.
Figure 3 shows the values of the variations of Cd concentrations in water samples from the drinking fountains and kitchen faucets of the eight schools selected for the research during four collections, beyond the default value of 0.005 mg L-1 recommended by the Ministry of Health for drinking water.
Figure 3. Variation of Cd concentration in water samples from drinking fountains and kitchen faucets from the eight schools studied during the four collections.
Rev. Ambient. Água vol. 10 n. 3 Taubaté – Jul. / Sep. 2015
3.3. Coliforms
The presence of coliforms in water indicates contamination, pointing to a potential risk of the presence of pathogenic organisms. The absence of coliforms is evidence of bacteriologically safe drinking water, since coliforms are more resistant in water than the pathogenic bacteria of intestinal origin (Oliveira et al., 2012).
Ordinance n0. 518 of the Ministry Health of 2004 suggests that, when verifying the presence of total coliforms even in the absence of fecal coliforms, it is necessary to take immediate corrective and preventive action, such as cleaning water tanks and cisterns. The Ordinance of the Ministry of Health n0. 2914 of 2011 considers the maximum value allowed for Escherichia coli and total coliforms in water for human consumption in systems that analyze 40 or more samples per month to be the absence of Escherichia coli and total coliforms in 95% of the 100 mL samples examined in the month. In systems that analyze less than 40 samples per month, only one sample can have a positive monthly result (Brasil, 2011).
3.4. Total coliforms
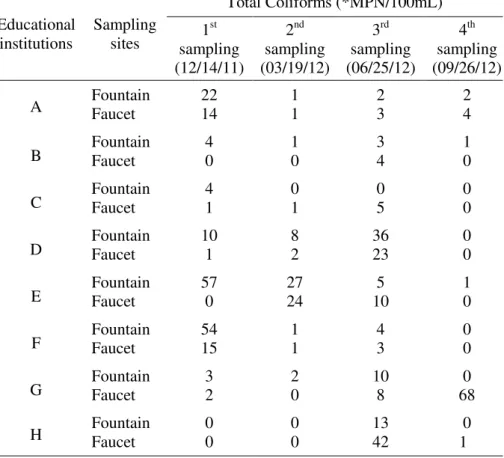
The values of total coliforms obtained from the analyses of water samples collected in the drinking fountains of the eight schools selected for the research were in the range of 0 to 57 MPN/100 mL, while the values of total coliforms for samples coming from the kitchen faucets were in the range of 0 to 68 MPN / 100 mL, as shown in Table 2.
Table 2. Results of analyses of water samples from drinking fountains and kitchen faucets from eight schools selected for research regarding the presence of total coliforms.
Educational institutions
Sampling sites
Total Coliforms (*MPN/100mL) 1st
sampling (12/14/11)
2nd sampling (03/19/12)
3rd sampling (06/25/12)
4th sampling (09/26/12)
A Fountain Faucet 22 14 1 1 2 3 2 4
B Fountain Faucet 4 0 1 0 3 4 1 0
C Fountain Faucet 4 1 0 1 0 5 0 0
D Fountain Faucet 10 1 8 2 36 23 0 0
E Fountain Faucet 57 0 27 24 10 5 1 0
F Fountain Faucet 54 15 1 1 4 3 0 0
G Fountain Faucet 3 2 2 0 10 8 68 0
H Fountain Faucet 0 0 0 0 13 42 1 0
* MPN/100mL most probable number in 100 mL.
by Ordinance No. 2914 of the Ministry of Health, 2011. Of the 32 water samples collected from the kitchen faucets, 65.625% (21 samples) did not comply with legislation, with values above those established by current legislation for drinking water.
It was observed that the water samples taken during the four collections showed significant differences (p <0.05) among themselves regarding the presence of total coliforms. It was also observed that the samples of water from drinking fountains during the fourth collection had a lower average value than the other collections.
Also, in relation to water samples from the drinking fountains, the first collection presented a higher average value for the presence of total coliforms, differing from the other collections. The water samples from the third collection differed significantly from the other collections, showing a higher average only compared to the second collection’s value with regard to the presence of total coliforms. When analyzing samples of water from the kitchen faucets, it was found that all of the samples differed among themselves during the sampling period. It was observed that the samples from the third collection showed higher average of total coliforms than the other collections. The second collection’s samples showed an average lower than all of the other collections. The first collection also differed from the other collections in that the most probable number of coliforms presented a higher average value only in relation to the second collection. It was also found that water samples from the fourth collection had a lower average value only when compared to the third collection.
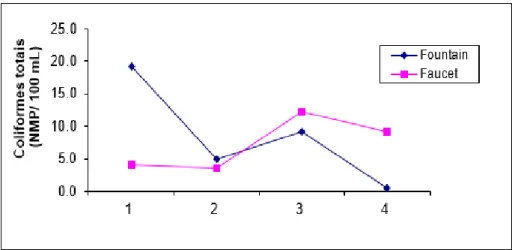
Figure 4 is illustrated the variation in the number of total coliforms present in the water samples from drinking fountains and kitchen faucets in schools selected for the survey during the four collection periods.
Figure 4. Variation of total coliforms in samples of water from drinking fountains and kitchen faucets from eight schools during the four collections.
3.5. Escherichia coli
Ordinance no. 2914 of the Ministry of Health, 2011, establishes the absence of bacteria of the thermo tolerant coliforms group, formerly fecal coliforms as a potability standard for water intended for human consumption. Waterborne diseases are transmitted through the ingestion of water contaminated with pathogenic microorganisms eliminated in the feces of humans and / or animals. One can safely say that waterborne diseases are one of the most serious threats to the child population, since this group of diseases is among the five leading causes of death in individuals between one to four years-old. (Germano and Germano, 2001).
Rev. Ambient. Água vol. 10 n. 3 Taubaté – Jul. / Sep. 2015
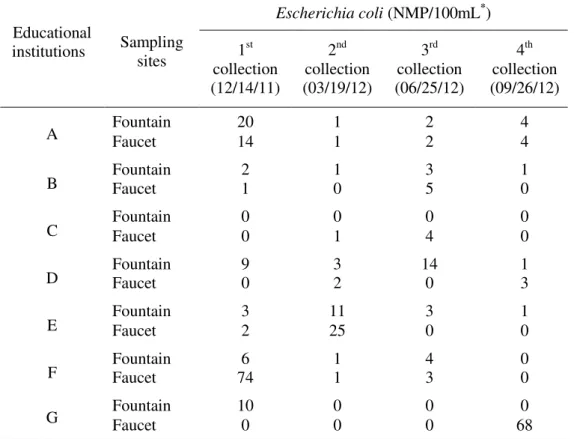
As shown in Table 3, of the 32 water samples (100%) from the fountains, 22 (68.75%) did not conform to the standards recommended by Ordinance n0 2914 of 2011 of the Ministry of Health for drinking water. In relation to the 32 samples of water from the faucets, 18 (56.250%) did not conform to the parameters established by the current law. The Kruskal-Wallis Test was performed with a 5% significance level with the objective of
identifying a significant difference in relation to the presence of Escherichia coli in different water sampling periods. The samples from the kitchen faucets showed no significant difference in the presence of E. coli during the different sampling periods.
Table 3. Results of analySES of water samples from drinking fountains and faucets of eight schools selected for the survey, in relation to the number of Escherichia coli.
Educational
institutions Sampling sites
Escherichia coli (NMP/100mL*)
1st collection (12/14/11)
2nd collection (03/19/12)
3rd collection (06/25/12)
4th collection (09/26/12)
A Fountain Faucet 20 14 1 1 2 2 4 4
B Fountain Faucet 2 1 1 0 3 5 1 0
C Fountain Faucet 0 0 0 1 0 4 0 0
D Fountain Faucet 9 0 3 2 14 0 1 3
E Fountain Faucet 3 2 11 25 3 0 1 0
F Fountain Faucet 74 6 1 1 4 3 0 0
G Fountain Faucet 10 0 0 0 0 0 68 0
*MPN/100mL most probable number in 100 mL.
However, the water samples collected in the schools’ drinking fountains differed significantly with regard to the presence of Escherichia coli depending upon the collection period.
It was also observed that the water samples from the first collection differed significantly from the other samples taken and showed a higher average value of the most probable number of E. coli when compared with the values from other collections. The water samples from the fourth collection showed significant differences in relation to the other collections, showing a lower average value with regard to the presence of E. coli.
number of thermo tolerant coliforms in water samples collected in drinking fountains of the schools during the different sampling periods.
Figure. 5. Variation of thermo tolerant coliforms present in water samples from drinking fountains of eight schools selected for research during the four collections.
4. CONCLUSION
Public schools use water, among other purposes, for cleaning, personal hygiene and for drinking. To ensure the maintenance of quality and purity of water used in schools, it is necessary that it be stored in clean containers that are disinfected at least twice a year.
In several educational institutions, the index of waterborne diseases has become increasingly common, in addition to physical changes related to the water’s odor, color and taste. This may be due to contamination in water tanks or infiltration in pipes. For this reason, it becomes important to monitor and further analyze the quality of waters from faucets and drinking fountains and consumed by the school community.
The results of this study show that, in relation to the concentration of free residual chlorine, all the samples were below the maximum value allowed by law (2.0 mg L-1). However, 40.625% of water samples did not meet the minimum required value of 0.2 mg L-1. The most worrisome results were found at School A, where all of the samples collected did not meet the minimum values recommended by Ordinance 2914, 2011, Ministry of Health.
When analyzing metal concentration, 68.75% of water samples from the first collection (12/14/2011) showed levels of chromium above those permitted by Ordinance n0. 2914 of the Ministry of Health, 2011. With regard to the second collection (03/19/12), 50% of the samples drawn showed concentrations of chromium and manganese above the permissible level and 25% had lead content above that recommended for drinking water. During the third collection (06/25/12), 31.25% of the water samples were outside of the established standard for chromium concentrations. The cadmium results were even more worrisome, as all of the samples had values above those recommended by the Ministry of Health. Of the water samples from the fourth collection (09/26/12), 50% did not meet the permitted standards for concentrations of Cr and all of the samples were above the maximum value allowed for concentrations of Cd.
Rev. Ambient. Água vol. 10 n. 3 Taubaté – Jul. / Sep. 2015
Regarding the microbiological quality of water used by the schools, the presence of total coliforms was observed in 68.75% of the water samples analyzed, although all samples of water from the drinking fountains and faucets in school A showed unacceptable levels of total coliforms that did not conform to the recommendations of the Ministry of Health.
Another important fact was observed in relation to the variation of the most probable number of total coliforms in samples analyzed during the four collections: 75% of the samples from the first collection showed the presence of total coliforms. This value changed to 93.75% in the second collection, decreased to 68.75% in the third collection, and reached 37.5% in the fourth. This decrease in the value of the number of total coliforms can be explained by the fact that the fourth collection occurred on 09/26/2012, just after the cleaning of the water reservoirs which occurred during a school recess period (July/2012).
Regarding the presence of Escherichia coli, 65.625% of the samples did not conform to the recommendations of the legislation for drinking water. In the first collection (12/14/11) and the third collection (06/25/12), E. coli were identified in 68.75% of the water samples analyzed. The value increased to 75% in the second collection, reducing to 50% in the fourth collection.
Still regarding the presence of thermo tolerant coliforms, it is important to emphasize the poor quality of the water samples coming from School A. This can be explained by the fact that these samples present values of free residual chlorine below the minimum value required by law.
This study was conducted on children's schools, whose commitment is to provide, in addition to education, security for the students through an appropriate infrastructure, with proper cleanliness, hygiene and nutrition.
The evaluation of water quality should be conducted in an integrated manner which considers all of the physical, chemical and microbiological information available. The different parameters presented here are assessment tools that can be grouped to assess the most relevant characteristics of the quality of the public water supply. In general, these studies show the need to maintain a system of monitoring and control in order to ensure the appropriate oversight of the quality of water intended for school consumption.
5. ACKNOWLEDGMENT
CAPES for their support for the implementation of this work.
6. REFERENCES
AMERICAN PUBLIC HELTH ASSOCIATON – APHA; AMERICAN WATER WORKS ASSOCIATION – AWWA; WATER ENVIRONMENT FEDERATON - WEF.
Standard methods for the examination of water and wastewater. 21st ed. Washington, 2005.
BAIRD, C. Química ambiental. 2. ed. Porto Alegre: Bookman, 2002. 607p.
BRASIL. Ministério da Saúde. Secretaria de Vigilância em Saúde. Portaria n0 2.914 do Ministério da Saúde. Estabelece os procedimentos e responsabilidades relativos ao controle e vigilância da qualidade da água para consumo humano e seu padrão de potabilidade. Diário Oficial [da] União, Brasília, DF, 12 dez. de 2011.
COMPANHIA DE TECNOLOGIA E SANEAMENTO AMBIENTAL – CETESB. Índice de qualidade das águas. 2008. Disponível em:<http://www.cetesb.sp.gov>. Acesso em 02 Março de 2012.
CHAKRABARTY, S.; SARMA, H. P. Heavy metal contamination of drinking water in Kamrup district, Assam India. Environmental Monitoring and Assessment, New York, v. 179, n. 1, p. 479-486, 2010. http://dx.doi.org/10.1007/s10661-010-1750-7 GERMANO, P. M. L.; GERMANO, M. I. S. A água: um problema de segurança nacional.
Revista Higiene Alimentar, v. 15, p. 15-18, 2001.
HÊNIO, M. A importância da água. Gazetaweb.com, Alagoas, 20 mar. 2011. Available in: <http://gazetaweb.globo.com/noticia.php?c=227602&e=19>. Access in: November 26th 2012.
GIRALDI, R. Relatório da ONU alerta que água poluída mata mais do que todos os tipos de violência. Revista Cidadania & Meio Ambiente, Rio de Janeiro, v.1, n. 26, mar. 2010. Available in: <http//:http://www.ecodebate.com.br/2010/03/23/relatorio-da-onu-alerta-que-agua-poluida-mata-mais-do-que-todos-os-tipos-de-violencia/>. Access in: October 20th, 2012
KHAN, S.; SHALNAZ, M.; JEHAN, N.; REHMAN, S.; SHAH, M .I.; DIN, I. Drinking water quality and human health risk in Charsadda district, PakistanDrinking water quality and human health risk in Charsadda district, Pakistan. Journal of cleaner production, v. 60, p. 93-101, 2013. http://dx.doi.org/10.1016/j.jclepro.2012.02.016 NIKAIDO, M.; TONANI, K. A. A.; JULIÃO, F. C.; TREVILATO, T. M. B.;
TAKAYANAGUI, A. M. M.; SANCHES, S. M. et al.. Analysis of bacteria, parasites, and heavy metals in lettuce (Lactuca sativa) and rocket salad (Eruca sativaL.) irrigated with treated effluent from a biological wastewater treatment plant. Biological Trace Element Reserch, v. 3, p. 342–351, 2010. http://dx.doi.org/10.1007/s12011-009-8477-8
OLIVEIRA, A. S.; SANTOS, D. C.; OLIVEIRA, E.; BRITO, J. G. Qualidade da água para consumo humano distribuída pelo sistema de abastecimento público em Guarabira- PB.
Revista Verde de Agroecologia e Desenvolvimento Sustável, v. 7, n. 2, 199-205, 2012.