17th European Advanced Studies Institute in Regional Science
Jorge Ricardo da Costa Ferreira
Geography and Regional Planning Department / e-Geo – Research Centre Faculdade de Ciências Sociais e Humanas
Universidade Nova de Lisboa
Av. de Berna 26 C - 1069-061 Lisboa, Portugal
jr.ferreira@fcsh.unl.pt
INTERNET GEOGRAPHY: SPACES OF INOVATION
ABSTRACT
Information Society plays an important role in all kinds of human activity, inducing new forms of economic and social organization and creating knowledge.
Over the last twenty years of the 20th century, large investments in telecommunication networks were made to approach economies and put an end to the asymmetries. The most isolated regions were the beneficiaries of this new technological investment’s wave disseminating trough the territories. The new economic scenarios created by globalisation make high capacity backbones and coherent information society polity, two instruments that could change regions fate and launch them in to an economic development context. Technology could bring international projection to services, products and could be the differentiating element between a national and an international economic strategy. So, the networks and its fluxes are becoming two of the most important variables to the economies.
In the physical/real space, location is defined by two or three geographical co-ordinates. In the network/virtual space or in cyberspace, geography seems incapable to define location, because it doesn’t have a good model. Trying to solve the problem and based on geographical theories and concepts, new fields of study came to light. Internet Geography is one example.
In this paper and using Internet Geography and informational cartography, it was possible to observe and analyse the spacialisation of the Internet phenomenon trough the distribution of the IP addresses in the Portuguese territory. This work shows the great potential and applicability of this indicator to regional development studies, and at the same time.
The IP address distribution of Country Code Top Level Domains (.pt for Portugal) could show the same economic patterns, reflecting territorial inflexibility or, by opposition, new regional hierarchies. The spatial concentration or dispersion of top level domains seems to be a good instrument to analyse the info-structural dynamic and economic development of a territory, especially at regional level. At the same time it shows that information technologies are essential to innovation and competitive advantage.
KEYWORDS:
Introduction
Information Society (IS) represents a group of interactions whose inputs are images, sounds, attitudes and information that flows in physical space. Society is formed by flows. They represent, not only an element of social organization, but they determine the economical, political and symbolic processes of life itself.
Information Society generates a new developing model. ‘Information Highways’ (IH), constant innovation in the productive processes and the use of ‘Information and Communication Technologies’ (ICT) are some of the crucial elements to achieve competitiveness in the globalized economy.
But ICT and IH are still a luxury of the rich and developed countries and its global diffusion is far from being equally distributed. As for Innovation, it usually comes with the first two.
It seems that ICT is strongly related with mature economic development; new technologies like Internet are ‘on-line’ with development and seem incapable of starting a developing environment that could attract investment and trigger a growing cycle. But the studies are beginning to appear. The use of new indicators based, not on virtual, but on real variables, could be used to show phenomenon that until recent years were completely unknown and should be taken in consideration.
1. Information Society and Innovation
The concept of Information Society has its roots in the ‘post-industrialism’ literature, a very common notion in the 60’s and in the 70’s. The idea proclaims the end of ‘industrial capitalism’ and the emergence of a ‘services society’ or a ‘recreational society’. But only in the 80’s the concept began its wide spreading.
characteristics’. T. STONIER (1983) saw the end of wars and P. DRUCKER (1993) considered the actual information revolutions as the ideal scenery for the Information Society. W. HALAL (1993) e W.J. MARTIN (1995), with a more pessimistic approach, consider IS as a phenomenon without maturity and difficult to quantify and qualify.
R. LINDLEY (2000) goes a little bit further and differentiates ‘information society’ from ‘learning society’. The first one, says the author, refers to information diffusion stimulated by microelectronics and by its social and economic impact. And the second one, includes the potential of people’s participation in long life learning. He also talks about ‘knowledge society’ that takes into consideration the long term structural change in economy, and the production and use of knowledge in the process of wealth creation.
The creation of new knowledge is innovation. This concept has a double significance because it refers to the ‘process’ and at the same time to the ‘result’.
According to the European Commission (1996), ‘innovation’ means transformation of scientific and technological knowledge in products and services; and in this sense, it describes a process. But when innovation is applied to a new product, it describes a result. This duality between the factors that promote innovation and its result in the form of new products generates some confusion in the innovation theories. “…Innovative knowledge could lead to the introduction of innovative processes…” (FELDMAN M. P. 1994:2 and 2000:373-375). And “…it could be seen as a good that serves as an input, creating an output that might be considered (again) as knowledge…” (OCDE, 2000:13).
2. Networks of Knowledge and the Geography of Innovation
answer to different programming languages. The convergence of all this high-tech products led to an evolution of the network concept.
Networks should be seen as communities of relations, not only has a group of nodes. They could be economic, financial, social, cultural, of innovation or simply recreative. The benefit of being connected would be increasingly proportional to the size of the network. In the end, we could say that information society depends on well distributed networks and its nodes, but territorial dissemination is far from being homogeneous. Wireless technologies could be the answer to the problem, but for now, the future remains uncertain.
With the globalization of local economies and new business organizational structures, the circulation of goods, capital and work have been suffering considerable mutations. As for the territories, the constant transformations caused a rearrange of social and economical spaces. The involvement of local agents in a global market as changed the physical organization of territorial units. Administrative boundaries loose their importance and at the same time regions and cities increase its influence.
This kind of organization is based on a strong geographical dispersion, in which mobility is a crucial element. And nowadays, maps that represent social and economical variables almost ignore administrative boundaries. The networks, mainly cities and regions responsible for their hierarchy in the global context, are the major elements.
What characterizes technological revolution is not the use of information and knowledge for itself, but the application of that knowledge to generate even more and better knowledge in a continuous cycle of innovation (DIZARD W.P. 1982; FORESTER T. 1985; HALL, P. and PRESTON, P. 1988; e SAXBY S. 1990)1. Or the idea, that the best output is the one who serves as an input on other process.
Spread over physical space and mainly in territories with high degree of technological and inovacional potential, networks represent constraining elements to cultural, social and economic development. Every country has different development strategies, but two
1
of them are usually coincident: the reach of its network must be the largest possible and broadband should be broad enough to permit a well dimensioned use, adapted to daily needs.
These technological networks are based in hierarchical models, according to its speed and capacity. All of them have the so called backbone that supports all the branches. It’s over these networks that the milieux d’Inovation, information seedbeds, intelligent cities and other figures responsible for creating innovation potential, are located.
The considerable amount of information that flow trough a network obliges to constant upgrades. New services and new technologies require more sophisticated resources and the networks grow far beyond the most optimistic survey. That’s the story of the Internet.
Considered as the most advanced technological platform amongst all networks, Internet has a structuring role in the innovation process and it’s very important in defining territorial hierarchies. It’s easy to prove that the activities that contribute the most to the development potential and R&D of a nation are always concentrated in very important network nodes. This is true to all economic sectors. If we analyse more carefully, we could see that those nodes are always very high in Internet hierarchy.
The progress of mankind depends upon the creation of knowledge and it’s related (also) with the creation and use of innovation, in its several forms. Digital contents and its Internet diffusion might be considered as two of these (new) forms of innovation. For example, the “Human Development Report” from the United Nations Development Program uses the number of Internet domains, to quantify the diffusion of recent innovations.
3. The Distribution of Top Level Domains in Portugal – A reliable Innovation Indicator?
web page, it was created the Domain Name System (DNS), which makes possible the association between the numerical address and a certain number. For example fcsh.unl.pt is the correspondent DNS of the IP 193.136.113.4.
Due to the global reach of an Internet address, as well as its economical and social impact, the combined use of geographical top level domains (Country Code or CC) and organisational top level domains (CONE) could be one of the best indicators to quantify the Internet potential of a country or region. This could correspond to an informational productive potential. That’s, in general, the reflex of a dynamic productive base.
In Portugal the Fundação para a Computação Científica Nacional (FCCN) allocates Internet space of geographical top level domain (CC) .pt. The organizational top level domains (CONE) could be registered in one of the 32 Internet Service Providers operating in Portugal but due to confidentiality and market reasons, it wasn’t possible to obtain data related to the territorial distribution of CONE domains.
The growth of top level domains since 1997 has been remarkable. This is related to the number of Internet subscribers (fig. 1). The number‘s also influenced by the growth of DSL and cable access.
0 1000 2000 3000 4000 5000 6000
1991 1992 1993 1994 1995 1996 1997 1998 1999 2000 2001 2002
(M
ilhar
es)
N
.º de
S
ubs
cr
itor
es
0 5 10 15 20 25
(M
ilhar
es
)
D
omí
nios
de
Topo .
pt
N.º de Subscritores de Acesso à Internet
Domínios de Topo .pt
Fonte estatística: FCCN, 2003 e ANACOM, 2003.
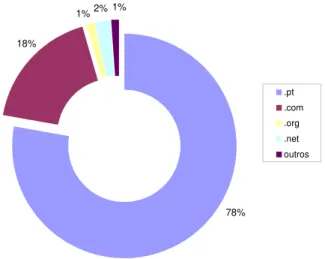
In February of 2003 there were approximately 25.500 top level domains (geographical and organisational) in Portugal. (Fig. 2) If we analyse the type of top level domains, only 22% are CONE domains (.com, .net and .org), the other 78% are geographical (CC) domains. This means that per each CONE domain there are 4 CC domains. One of the reasons to this difference was the late liberalisation of the telecommunication sector. Only then, Internet service providers (ISP) began to operate and the registration of CONE domains could be done. But this also reflects that Internet in Portugal is (still) turned to internal market. This value also reflects the true importance of Portugal in foreign markets, even in a European context. In other international studies (Zook, 2001) the number of CONE domains was much more near to the CC number.
78% 18%
1% 2%1%
.pt .com .org .net outros
Fonte estatística: Domínios Organizacionais: ISP's (Dezembro 2002) Domínios geográficos: FCCN (Fev. 2003)
Fig. 2 - Percentage of Top Level Domains (according to its type), 2002 and 2003.
# # # # ## ### # # # ### ## # ### ##### # ## #### # ######### # # ## ## ##### # # # # ## # # # # # # # # # # # # # # # # # # ## # # # ## # ### # # # # # # # # # # ### ## # # # # # # # # # # #### # ## # # ## # # # ## ###### ## # # # # # # # ## # # # ## # # # # # # # # ## # ## # # # # # # # # # # # # # # # # # # # # # # # # # # # # # # # # ## # # # # # # # # # # ## # # # # # # ## # ### # ## ## # # # # # ## # ### # # # # # # # # # # ## # # # # # # # # ## # # # # # # # # # # # # # # # # # # # # # # # # # # # ### # # # ## # # # # # ## # # # # # # # # # # # # # # # # # # # ## # # ### # # # # ##### # # # # # ## # # # ## # # # # # # # # # # # ## ### # # ## # # ## # # # # # # # # # # # # # # # # # # # # # # # # # # # # # ###### ## # ## ### # # # ##### # ## # ## # # # # # # ## ## # # # # # #### # # # # # # # # # # # # # # # # # # # # # # # # # # # # # ## # # # # # # # # # ## # ## ### ## # # # # # # ## ## # # # # # # # # # # # # # # # # # # #### ## ###### # # # ### # # # ##### ## # # # # # # # # # # # # # ## ######## ### ## ## # # # # # # # # # # # # # # # # # ########## # ## ## ## # # # # # # # # # # # ## # # # # # ######## # # ### ## # # ## # # ## # ## # # ## # # ## # ## # # # # # # # # # # # # # # # # # # # # # # # # # # # # # # ## # # # # # # # # # # # #### # # # ## # # # # # # # # # # ## ## # # # # ## # # # # # ## # # # # # # ## # # # # # # #### # # # ## ## # # # # # # # # # # # # # # # # # # # ##### ##### # # # # # # ## # ## # # # # ## # # ### ### ### # # # # # # # # # # ## # # # # # # # ## # # # # # # # # # # # # ###### # # # # # # # # # # # # # # ########### ##### # # # # # # # # # # # #### # # # # ####### # # ## # # # # # # # # # # # # ## # # # # ## ### # # # # # # # ## ### # # # # # # ## # # # # ## # # # #### ## # # # # # # # ## # ### # # # # # # # # # # ### #### # # ## ## # ## # # # # # # # # # # # # # # # # # ### # # # # # # # # # # # ## ## # # ## # # # # ## # # # # # # # ## ##### ######## ### ## ## # # # ### # # # # # # ### # # # ##### # # # # # # # # # # # # #### # # # # # # # # # # # #### # # ## ## # # # ## # # # # # ## ## # # # # # # # # # # ## # # # # # # ## # ### ## # ## # # # # # # # # # # # # # # # ##### # # # ########## # # # # ## # # ## # # # # # ## # ## # # # # # # # # # # ### # ## # # # # # ## # ## # # # # # # # # # # ## # # # # # # # # # # # # # # # # # # ## # # # # # ## ## # ## # # # ############## ###### # ### ## # # ### # # # # # # # # # # ### ### ### ### ## # ### # # # ### # # # # # # # # # # # # # ## # # ## # # ## # # # # # ## # # # # # # # # # # # # # ## # # # # # ## # # # # ### # # # # # # #### # ## # #### ## ## # # ### # # # # # # # # # # # # # ##### # # # # # # # # # # # # # # # ## # # # # # # # # # # # # # # ### ### # # # # # # # # # ## # # ## ####### # # # # # # # # # # # # ## # # # # # # # # ## # # # # # ## # # # # # # # # # # # # # # # # # ## ### # # # # # # # # # # # # # # # ## # ## # # # # # # # # # # ## ### # # # #### ##### # ### ## # # # # # # #### # ######## # ## # # # ## # # # # # # #### # ## # # # # # # ## # # # # # # ### # # # # # # # # # # # # # # # # # # # ## # # # # # # # # ##### # ############ ############## # # # # # # ## # # #### ####### # ## # # # # # # ### ## ######## # # ## # # # # # # # # ## # # ##### # #### # # ## # # # # # # # # # # ## # # # # # # # # # # ## # # # # # # # # # # # # # ## # # ## # # # ## # # # ### # # ##### ## ## # ## # ## # ##### # # # ## # # # # # # # ## # # # # # # # # # # # ## # # # # # # # # # ## # # # # # ## ## #### # # # # # # # # ## # # ## # # # # # # # # ### # # # ### # # # # ## # # #### ## # # # # # # # # # ## # # # ## # # # # # # # # #### # # ## ## # # # # # # # # # # # # # # # # # # # # # # # # # # ### # # # # # # # # # # # # # # # # # # # # # # # # # # # # # # # # # # # # # ### # ### # ## ###### # # # # # # ## # # ### ## # # # # # # # # #### # # ### ### ## # # # # ### # # # # # ## ## # ## # ##### # # # # # # ## ## # # ### # # # # # # # # ### ## # # # # # # # # # # # # ## # # # # # # # # # # # # # # # # # # ## # # # # ## #### ### # # # # # # # # # ### # # # # # # # # # # # # # # # # # # # # # # # # # # # # # # # # # # # # # # # # ## # # # # # ## # # # # # # # # # # ### ###### # #### ####### # # # # # # # # # # # # # # # ### # # # # # # # # # ## ###### ##### ### ## # # # ## ## # ## # ### # # # # # # # # # # ## # # # # # # # # # # # # # # # # # # # ## # # # # # ## # # ### # # # # # # ### # # ### ## ## # # ## # # ## ## # # # # # # # # # # # # # # # # # # # # # # # # # # # # # # # # # # ### # ## # # # # # # ### # # # # # # # # # # # # ## # # ## # # # # # # # # # # # # # ## # ##### # # # # # # # # #### #### ## # # # # # # # # # ## ## # ##### # #### # # # # # # # # ## ### # # ### ## # # # # # # # # # # # # # # # # ### # ## # # # # # # # # # # # # # # # # # # # # # # # # ## # # # # # #### # # # ## # # # # # # # # # # # # # # # # # # #### # # # # # ## # # # # # # # # # # ## # # # # # # # ## # # # # # ## # # # # # # # # # # # # # # # # # # # ### # # # ## # # # # # #### # # ### # # # # # ## # ### ## # # # ## # # # # ## # # # # # # # # # # # # ## # # # # # # # ### # ## # # # # # # # ## # # ## ##### # # ## # # # # # # # # # # # ### ## # # # # # # # # # # # # # # # # # # # # # # # # # # # # # # ## # # # # # # # # # # # # # # # # # # # # # # # # # # # # ## ## # # # # # # # # # # # # # # # # # # # # # # ## # # # # # # # # # # # ## # # # ## # # # ## # # # # # # # # # # ## # # # # # # # ## # ## # # # # # # # # ## # # # # # # # # # # # # # # # # # # # # # # # # # # # # # ## # # # # # # # # # # # # # # # # # # # # # # # # # # # # # # # # # # # # # # # # ##### ## # # # ## # # # # # # # # # # # # # # # # # # ## # # # ## # # # # # # # # # # # # # ## # # # # # # # # # # ## # # # # # # # # # # # # # # # # # # # # # # # # ## # # # # # # # # # # # # # # # # # # # ## # ## # ## # # # # # # # ## # # # # # # # # # # # # # # ## # # # # # # # # # ### # ## ## #### # # # # ## # # # # # # # # ## # # # # # # # # # # # # # # # # # # # # # # # # # ## # # # # # # # # # # # # # # # # # # # # # #### # # # # ## # # ### ## # # # # # ## # # # # # # # # # # # #### # ## # # # # # # # # # # # ### # # # # ## # # # # ## # # # # # # # # # # # ## ## # # # # # # # # # # # # # # # # # # # # # ## ## # # # # # # # # # # # # # # # # # # # # # # # # # # # ## # ### # # # # # # # # # ## # # # # # # # # # # ## ## # # ## # # # # # # # # # # # # # # # # # # # # # # # # # # # # # # # # # # # # # # # # # # ### # # # # # # # # # # # # # # # # # # # # # # # # # # # # # # # # # # # ## ## # # # # # # # # # # ##### # # # #### # # ## # ### # # # # # # # # # ## # ## # # # #### # # # # # # # # # # # # # ### ## # # # # # # # # ### # # # # # ### # # # # # # ## #### # # # # ### ######## # # #### # # # ### # # # # # # # ### # # # # # # # # # ###### # # # # # # # # # # ### #### # # # # # # # # # # # # # # # ## # # # #### # # # # # # # # ## # # # # # # # # # # # # # # # # # # # ## # # # # # # # # # # # # # # # # # # # # # # # # # # # # # # # # # # # # # # # # # # # # # # # ## # # ### # # # # # # # # # ## # # # # # # # # # # # # # # # # # # # # # # # # # # # # # # # # # # # # # # # # # # # # # # # # # # # # # # # # # # # # # # # # # # # # # # # # # # # # # # # # # # # ## # # # # # # # ## # # # # # # # # ## # # # # # # # # # # # # # # # # # # # # # # ## ## ## # # # # # # # ###
Fonte estatística: FCCN (2003)
# 1 Dominio de topo .pt
0 50 KilKm s
N A ut o r: J o rge F e rr e ira ( 20 03) ometer
Fonte estatística: FCCN (2003)
0 50 Kilom
_
> 5 000 2 500 - 4 999 750 - 2 499 100 - 749 1 - 99
Km N A ut o r: J o rg e F e rre ira ( 20 03 ) eters
Fig. 3 – Distribution of TLDs, 2003. Fig. 4 - Distribution of TLDs (NUTs), 2003.
Using the last demographic census of 2001, the regions were compared according to the number of domains and population and the results were very interesting. Then it was calculated the correlation value between the two variables and the result was 0,937 to an interval of confidence of 99%.
Fonte estatística: INE (2001) e FCCN (2003)
[Domínios .pt/1000 Hab.
0 50 Kilom
>1.50_ 1.00 - 1.49 0.70 - 0.99 0.50 - 0.69 0.00 - 0.49
Km
N
A
ut
o
r:
J
o
rg
e
F
e
rre
ira
(
20
03
)
eters
Fig. 5 – Number of domains per 1000 habitants.
Analysing TLDs for the 278 ‘concelhos’ of Portugal, it’s possible to see that its distribution
across the territory favours the ones with higher population values, in particular, the two major
metropolitan areas, Lisbon and oPorto. The correlation between the distributions is (in general)
very high. And the exceptions go to the concelhos with more investment in R&D or high tech
industries (to be analysed in future works); or with Universities or another higher education
5200
1300 2600 Domínios .pt
600.000
150.000 300.000 População Residente
A
u
tor
: J
o
rge F
er
rei
ra,
200
3.
Fonte estatística: INE 2001, FCCN 2003.
0 50 100 Km
Fig. 6 – Domains and population distribution in the ‘concelhos’ of Portugal, 2003, 2001.
The next step was a brief analysis of the 48 Portuguese cities with more than 25.000 habitants
according to the last census of 2001. The only 3 cities with values above 6 domains were Lisbon,
Maia and Leiria. Values above 6 are considered a good reference value, indicating high TLD
densities. Between 6 and 4 domains there were 5 Portuguese cities: Porto, Matosinhos, Vila
Nova de Famalicão and Aveiro. But considering the medium value of the 28 Portuguese regions
(1,17 domains/1000Hab.), this cities have a good overall performance in content production.
Between 4 and 3 domains, another 4 cities: Guimarães, Figueira da Foz, Braga and Faro. So, at
the end, 37 from the 48 studied cities had values below 3 domains per 1000 habitants, which is
in fact, a very low value.
From the 20 cities with more than 2 domains per 1000 habitants, 15 are located in the littoral.
The interior concelhos with higher values are the ones with Universities. The fact that the
Portuguese territory doesn’t have medium size cities reflects itself on the small number of TLDs
9.
1
8.
3
6.
8
5.
6
5.
1
4.
9
4.
0
3.
9
3.
7
3.
5
3.
1
2.
8
2.
8
2.
7
2.
6
2.
5
2.
5
2.
4
2.
1
2.
0
2.
0
1.9 1.9 1.9 1.9 1.9 1.7
1.
6
1.
6
1.4 1.4
1.
2
1.
2
1.
1
0.
9
0.
9
0.
9
0.
1
0 1 2 3 4 5 6 7 8 9 10
Li
sboa Ma
ia
Leir
ia
Por
to
Mat
os
in
hos
Vil
a No
va
de
F
amali
cã
o
Av
eiro
G
ui
m
ar
ãe
s
F
igue
ira da F
oz
Br
aga Faro
Coimbr
a
Vis
eu
Vil
a do
Co
nde
Sant
ar
ém
G
uar
da
Al
ve
rc
a do
R
iba
te
jo
Caldas
d
a
Rainha
Ama
dor
a
Set
úb
al
Vila N
ova
d
e G
aia
Po
rt
imão
Pó
voa
de
V
arzi
m
Év
ora
Se
ix
al
G
on
doma
r
Mont
ijo
V
ian
a do Cas
te
lo
Ca
st
elo Bra
nc
o
B
arre
iro
Al
ma
da
Qu
el
uz
Ri
o T
into
O
div
elas
Er
mes
in
de
Amor
a
Cov
ilh
ã
Ag
ualv
a-Ca
cem
Fonte estatísitica: INE, 2001; FCCN, 2003.
Elevada Média Baixa Densidade de Domínios
t
Fig. 7 – TLDs in the cities (with more than 25.000 habitants)
0 50 Kilometers
> 15.0
_
12.5 - 14.9 10.0 - 12.4 7.50 - 9.9 0.0 - 7.4
[€ x 1 000]
N
A
ut
o
r:
J
o
rg
e
F
e
rr
e
ira
(
20
03
)
Fonte estatística: INE (2004) Km
Fig. 8 – Distribution of GDP, 2001.
[Média do País = 10
0 50 Kilom
Fonte estatística: INE (2001) Km
N
A
ut
o
r:
J
o
rg
e
F
e
rr
e
ira
(
20
03
)
_
> 125.0 100.0 - 124.9 75.0 - 99.9 50.0 - 74.9 0.0 - 49.9
eters
Fig. 9 – Distribution of IpC, 2001.
Conclusions
Innovation is an essential element to economic growth and social wellbeing. Access to innovation is as important as access to education. Innovation and knowledge dissemination are considered to be elements of competitive advantage in regional development. Information technologies could be a crucial element to launch regions in the global market.
Internet is where its users are. In Portugal, the most populated regions have more registered domains and Internet it’s clearly an urban phenomenon. The Lisbon and OPorto Metropolitan Areas are clearly ahead and the difference between regions with higher and lower values is huge.
It seems that Internet reflects an economical and social regional dynamic. But, Internet is also an element that reinforces economic and social dynamics, especially when related to the new information and telecommunication sector. In different regions of the globe there are some case studies where Internet seems to induce a new information potential, giving to people the necessary tools to leap across the digital divide: Africa and India are only two successful examples.
Technological variables and its territorial behaviour should be analysed to understand the differences between regions. The top level domains number (organisational or geographical) is one of these variables. It’s important however to use another indicators and variables besides traditional ones to quantify and qualify the physical space and its asymmetries. Only then we can extract information that continues to be ignored in today’s research.
This methodology could be used in other regions and it would be very interesting to compare the dissemination of this phenomenon in other countries.
References:
DIZARD, W.P. (1982) – The Coming Information Age, New York: Longman.
DRUCKER, P. (1993) – Post-capitalism society. Oxford: Butterworth-Heinemann.
EUROPEAN COMMISSION (1996) - Green Paper on Innovation, Luxembourg, DGXIII, The Innovation Programme.
FELDMAN, M.P. (1994) – The Geography of Innovation, Dordrecht: Kluwer.
― (2000) – Location and Innovation: The new economic geography of innovation, spillovers, and agglomeration. In Clark G.L., et al. (eds.), The Oxford Handbook of Economic Geography, New York: Oxford University Press, pp. 373-94.
FERREIRA, J. (2001) – “A Sociedade da Informação e as Redes de Ciência e Tecnologia no Ensino Superior em Portugal”, Actas do IV Congresso da Geografia, Lisboa.
FERREIRA, J. (2002) – “The Impact of the Information Society on the Change of Communities”, European Science Foundation: EURESCO Conference, Seefeld: Austria.
FERREIRA, J. (2003) – “Internet Geography: New Spaces of Information”, IADIS International Conference, Algarve, 2003.
FORESTER, T. (ed.) (1985) – The Information Technology Revolution, Oxford: Blackwell.
HALAL, W.E., (1993) – “The Information technology revolution: Computer hardware, software, and services into the 21 st century”, Technological Forecasting and Social Change 44, p. 69-86
MARTIN, J. (1978) – The Wired Society, Englewood Cliffs: Prentise Hall.
MARTIN, W.J., (1995) – The Global Information Society, Aldershot: Aslib Gower.
OCDE - Organização para a Cooperação e Desenvolvimento Económico (2000) – Knowledge Management in the Learning Society, Paris: Centre for Education and Research and Innovation.
SAXBY, S. (1990) – The Age of Information, London: Macmillan.