INTERNET GEOGRAPHY: NEW SPACES OF INFORMATION
Jorge Ricardo da Costa Ferreira
e-Geo - Centro de Estudos de Geografia e Planeamento Regional
Faculdade de Ciências Sociais e Humanas
Universidade Nova de Lisboa
Av. de Berna 26 C - 1069-061 Lisboa
Tel. 217933519 Fax. 217977759
Este artigo foi elaborado, no âmbito do Programa Plurianual de Financiamento da Fundação para a Ciência e a
Tecnologia, co-financiado pelo POCTI (vertente FEDER) do III Quadro da Comunidade Europeia.
ABSTRACT
The objective of great investments in telecommunication networks is to approach economies and put an end to
the asymmetries. The most isolated regions could be the beneficiaries of this new technological investments wave
disseminating trough the territories. The new economic scenarios created by globalisation make high capacity backbones
and coherent information society polity, two instruments that could change regions fate and launch them in to an
economic development context. Technology could bring international projection to services or products and could be the
differentiating element between a national and an international economic strategy. So, the networks and its fluxes are
becoming two of the most important variables to the economies.
Measuring and representing this new informational accessibility, mapping new communities, finding new
patterns and localisation models, could be today’s challenge. In the physical and real space, location is defined by two or
three geographical co-ordinates. In the network virtual space or in cyberspace, geography seems incapable to define
location, because it doesn’t have a good model. Trying to solve the problem and based on geographical theories and
concepts, new fields of study came to light. The Internet Geography, Cybergeography or Geography of Cyberspace are
only three examples.
In this paper and using Internet Geography and informational cartography, it was possible to observe and
analyse the spacialisation of the Internet phenomenon trough the distribution of the IP addresses in the Portuguese
territory. This work shows the great potential and applicability of this indicator to Internet dissemination and regional
development studies.
The Portuguese territory is seen in a completely new form: the IP address distribution of Country Code Top
Level Domains (.pt) could show new regional hierarchies. The spatial concentration or dispersion of top level domains seems to be a good instrument to reflect the info-structural dynamic and economic development of a territory, especially
at regional level.
KEYWORDS:
INTRODUCTION
Information Society and knowledge economy create a new developing model and at the same time
influences human behaviour. Information and innovation highways are the bases of national and regional
competitiveness and the only way to be known in the global economy. But in general, the information and
communication technologies (ICT) seem to be concentrated in regions or countries that have already dynamic
economies. The ICT evolution and the development of global networks, namely the Internet, transform the
world of business and change the way knowledge is disseminated.
The use of new and innovating indicators based not on virtual but on real variables, could be used to
show phenomenons that until recent years were completely unknown and should be taken in consideration.
1. NETWORKS OF INNOVATION
Over the last thirty years we’ve seen an unprecedented evolution in the CPU capacity. In the eighties,
besides processing, memory and disk capacity, the resources began to be shared in networks. But also the
telecommunications sector with the development of products and applications in transmission and routing,
became a reality. Fibre optics increased transfer speeds and laser technologies with more stable protocols
were the answer to different programming languages. The convergence of all this high-tech products led to
an evolution of the network concept.
Networks should be seen as communities of relations, not only has a group of nodes. They could be
economic, financial, social, cultural, of innovation or simply recreative. The benefit of being connected
would be increasingly proportional to the size of the network. In the end we could say that information
society depends on well distributed networks and its nodes, but territorial dissemination is far from being
homogeneous. Wireless technologies could be the answer to the problem, but for now, the future is uncertain.
Internet is considered to be the Network of Networks and it has changed the usual channels of
communication. And communication influences culture, “We do not see reality as it is, but as our languages
are. And our languages are our media. Our media are our metaphors. Our metaphors create the content of our
culture (Postman, 1985). The development rhythm and its geography continue to be dominated by
expectations, speculations and futurology.
2. INNOVATION AND ECONOMIC DEVELOPMENT
Information society only makes sense if truly global. But the Global Village is not so global has we
would like. Networks of telecommunications by cable or satellite are far from being global and if we took the
military, economic and political interests, the global village looses its meaning. In the future we could expect
that people with access to higher education levels, higher knowledge and technological skills, could maintain
his place in society. Unfortunately, for those without access to elements of knowledge, the future is uncertain.
Spread all over the economic and social developed territories, modern networks represent vital
Every country has its own development strategy but two identical objectives. The network must reach the
highest number possible of connected people and its capacity should be adapted to the needs.
Internet is the most important technological platform amongst all networks and it has a structural role in
the definition of hierarchies between territories. It’s easy to prove that the activities that contribute the most
to the development potential and R&D of a nation are always concentrated in very important network nodes
of all kinds. This is true to all economic sectors. If we analyse more carefully, we could see that those nodes
are always very high in Internet hierarchy.
3. INTERNET GEOGRAPHY
As a result of markets’ liberalisation and global economy, goods, capital and labour have suffered
enormous mutations. So, the territories are submitted to constant transformations and to a rearrange of social
and economic spaces. More than countries, we see maps with international firms, markets, economic circuits,
regions and cities. These elements define the new frontiers.
In the beginning, Internet announces the death of distance and the rise of places without identity. But for
now, the Internet is mainly a physical network that connects millions of computers around the world. These
computers have a geographical location. So we could say that Internet disseminates in space and it’s physical,
real and not virtual. Technological evolution has showed that Internet is clearly a spacialised phenomenon.
‘Internet is where its users are’ (Kolko, 1991:1).
To understand Internet technology and dissemination it’s necessary to apply theories, concepts,
methodologies and instruments of geographical research. The fact that analysed elements could be
telecommunication networks, web pages, hosts1, domains or other variables, do not prevent, but rather
compel, the use of Internet Geography. ‘Web sites are a form of geography - geography of the screen’
(Dodge, 2001b: 173).
The lack of reliable indicators to assure identification, quantification and qualification of the Internet,
raises some doubts about its dissemination over the territories:
- What are the most important factors in Internet dissemination along the territories?
- Is Internet an urban phenomenon or is it homogeneously distributed in physical space?
- Is Internet a reflex of regional economic dynamic or is it responsible for creating that dynamic?
Although without general consensus, indicators like volume of information, infrastructure capacity (in
bytes), transfer speeds (in mbits/s), location or number of domains or hosts, as well as the location or
quantification of e-mail addresses or web pages, have been used by some authors (Kitchin, 1998; Moss,
1998; Anon, 1999 and Zook, 1998, 2001).
1
4. THE GEOGRAPHY OF TOP LEVEL DOMAINS AND ITS DISSEMINATION IN PORTUGAL
All systems connected to Internet have a unique number, the IP address, for example 193.136.113.4. But
due to the difficulty of memorising that number to open a certain web page, it was created the Domain Name
System (DNS), which makes possible the association between the numerical address and a certain number.
For example fcsh.unl.pt is the correspondent DNS of the IP 193.136.113.4.
Due to the global reach of an Internet address, as well as its economical and social impact, the combined
use of geographical top level domains (Country Code or CC) and organisational top level domains (CONE)
could be one of the best indicators to quantify the Internet potential of a country or region. To this potential
could correspond an informational productive potential. That’s, in general, the reflex of a dynamic productive
base.
In Portugal is the Fundação para a Computação Científica Nacional (FCCN) that allocates the Internet
space of geographical top level domain (CC) .pt. The organizational top level domains (CONE) could be
registered in one of the 32 Internet Service Providers operating in Portugal but due to confidentiality and
market reasons, it wasn’t possible to obtain data related to the territorial distribution of CONE domains.
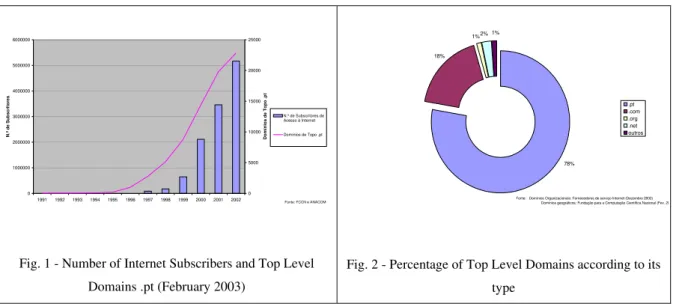
The growth of top level domains since 1997 has been remarkable. This is related to the number of
Internet subscribers (fig. 1). The number ‘s also influenced by the growth of DSL and cable access.
In February of 2003 there were approximately 25.500 top level domains (geographical and
organisational) in Portugal. (Fig. 2) If we analyse the type of top level domains, only 22% are CONE
domains (.com, .net and .org), the other 78% are geographical (CC) domains. This means that per each
CONE domain there are 4 CC domains. One of the reasons to this difference was the late liberalisation of the
telecommunication sector. Only then, Internet service providers (ISP) began to operate and the registration of
CONE domains could be done. But this also reflects that Internet in Portugal is (still) turned to internal
market. This value also reflects the true importance of Portugal in foreign markets, even in an European
context. In other international studies (Zook, 2001) the number of CONE domains was much more near to
the CC number.
In the beginning of 2003 the distribution of the 19.794 geographical top level domains .pt in the twenty
eight regions of Portugal (NUT III) showed a divided country. (Fig. 3). The dissemination of CC domains
reveal that urban and coastal regions continue to be determinant to ITC variables. Lisboa and OPorto regions
(the two bigger metropolitan areas of Portugal) could be, in a so called first group, with 8.393 and 3.351 CC
domains, followed by Setúbal Peninsula and the Cávado region with 900 and 700 domains. In a third group,
below the 700 domains, Ave, Pinhal Litoral and Baixo Vouga. The regions of Serra da Estrela and
Dão-Lafões have less than 50 domains. The urban regions with more population have a higher number of
domains.
Using the last demographic census of 2001, the regions were compared according to the number of
domains and population and the results were very interesting. Then it was calculated the correlation value
between the two variables and the result was 0,937 to an interval of confidence of 99%. The use of domains
value is below 6 domains per 1000 habitants (reference value) which mean a very low density of CC domains
(fig. 4). From the twenty eight analysed regions, sixteen had a value of domains per 1000 habitants below 1.
Even if we add the CONE domains number (only available for all the country) the total number of CONE
plus the CC domains, the value would be 2,5760 domains per 1000 habitants, which remains a very low
number.
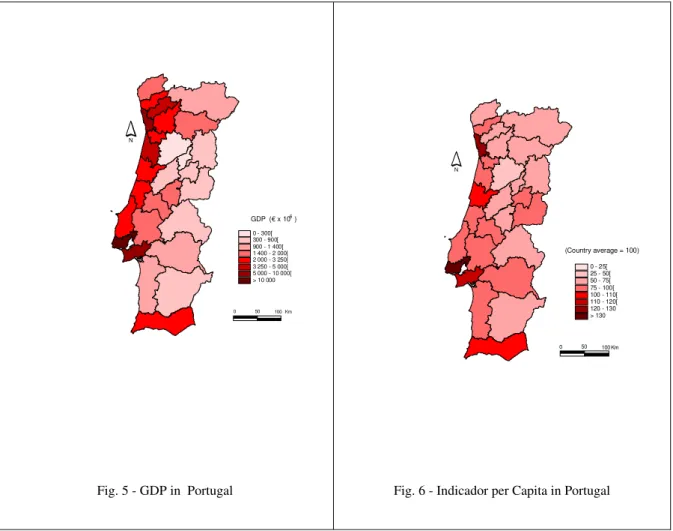
Internet is obviously related with a country or region production capacity. So, the next step was compare
the number of domains with GDP. The last numbers of GDP dated from 1997. The results were once more
very interesting. Amongst the ten regions with more registered domains, eight were also amongst the ten with
higher values of GDP. From the five regions with lower values in domains and in GDP, three were
coincident. Once more Lisboa, OPorto and Setúbal Península presented the higher values and Serra da
Estrela e Cova da Beira regions were at the bottom (Fig. 5). Once again we calculate the correlation between
domains and GDP for all the regions and for an interval of confidence of 99%, the value was 0,991.
Indicador per Capita (IpC) is an indicator that is used by the Statistics Portuguese Institute, to evaluate
people’s buying power. Once again, the list of the ten regions with more domains was compared with the list
of the ten regions with an higher IpC value. The result was clear, seven regions were coincident in the two
lists. In the table with the five lower values, two were coincident (Fig 6). The correlation analysis value was
0,799. The Ipc indicator doesn’t reflect regional development or economic productivity, but at the end shows
the welfare of populations and represents in a certain way the quality of life.
CONCLUSIONS
Innovation is an essential element to economic growth and social wellbeing. Access to innovation is
so important as access to education. Innovation and knowledge dissemination are considered to be elements
of competitive advantage in regional development. Information technologies could be a crucial element to
launch regions in the global market.
After analysing the three variables - population, GDP and IpC - confronting them with the
geographical top level domains dissemination in Portuguese territory, it’s easy to answer the questions that
we’ve made in the beginning. One of the most significant elements in the territorial dissemination of domains
seems to be population. In fact, Internet is where its user are. In Portugal, the most populated regions have
more registered domains and Internet it’s clearly an urban phenomenon. The Lisbon and OPorto
Metropolitan Areas are clearly ahead and the difference between regions with higher and lower values is
huge.
Seems obvious that Internet reflects a regional dynamic, economical and socially speaking. But,
Internet is also an element that reinforces economic and social dynamics, especially when related to the new
information and telecommunication sector. In different regions of the globe there are some case studies
where Internet seems to induce a new information potential, giving to people the necessary tools to leap
Technological variables and its territorial behaviour should be analysed to understand the
differences between regions. The top level domains number (organisational or geographical) is one of this
variables. It’s important however to use another indicators and variables besides traditional ones to quantify
and qualify the physical space and its asymmetries. Only then we can extract information that continues to be
ignored in today’s research.
This methodology could be used in other regions and it would be very interesting to compare the
dissemination of this phenomenon in other countries.
The wireless revolution, as I said earlier, could be the missing element or the answer to a real
FIGURES:
Fig. 1 - Number of Internet Subscribers and Top Level
Domains .pt (February 2003)
Fig. 2 - Percentage of Top Level Domains according to its
type 0 1000000 2000000 3000000 4000000 5000000 6000000
1991 1992 1993 1994 1995 1996 1997 1998 1999 2000 2001 2002
N .º de S ubs c ri tor e s 0 5000 10000 15000 20000 25000 D om íni os de Topo . pt
N.º de Subscritores de Acesso à Internet Domínios de Topo .pt
Fonte: FCCN e ANACOM
78% 18%
1%2% 1%
.pt .com .org .net outros
Fonte: Domínios Organizacionais: Fornecedores de serviço Internet (Dezembro 2002) Domínios geográficos: Fundação para a Computação Científica Nacional (Fev. 20
Fig.3 - Dissemination of Country Code Top Level
Domains in Portugal
Fig. 4 - CC Top Level Domains per 1000 Habitants
0 - 0.4[ 0.4 - 0.5[ 0.5 - 0.7[ 0.7 - 1[ 1 - 1.5[ 1.5 - 3[ 3 - 4 >4
N
0 50 100 Km
CC Top Level Domains per 1000 Hab.
N
0 - 50[ 50 - 100[ 100 - 250[ 250 - 500[ 500 - 1000[ 1000 - 1500[ 1500 - 5000[ + 5000
Fig. 5 - GDP in Portugal Fig. 6 - Indicador per Capita in Portugal
0 50 100 Km 0 - 300[ 300 - 900[ 900 - 1 400[ 1 400 - 2 000[ 2 000 - 3 250[ 3 250 - 5 000[ 5 000 - 10 000[ > 10 000
GDP (€ x 10 )6 N
N
0 - 25[ 25 - 50[ 50 - 75[ 75 - 100[ 100 - 110[ 110 - 120[ 120 - 130 > 130
0 50 100 Km
(Country average = 100)
REFERENCES:
Branscomb, Anne Wells, Who Owns Information ? From Privacy to Public Access, Basic Books, New York, 1994.
Castells, Manuel, The Rise of The Network Society, The Information Age: Economy, Society and Culture, Vol. I,
Blackwell Publishers, Oxford, 2000.
Dodge, Martin and Kitchin, Robin, Mapping Cyberspace, Routledge, London, 2001.
Everard, Jerry, Virtual States, The Internet and the Boundaries of the Nation State, Routledge, London and New
York, 2000.
Ferreira, Jorge, A Sociedade da Informação e as Redes de Ciência e Tecnologia no Ensino Superior em Portugal,
Paper presented in Congresso da Geografia, Portugal 2001.
Ferreira, Jorge, The Impact of the Information Society on the Change of Communities, European Science Foundation
- Paper presented in EURESCO Conference, Tirol, Austria 2002.
Grieves, Maureen, Information Policy in the Electronic Age, Bowker Sauer, London, 1998.
Hesselbein, Frances, Goldsmith, Marshall, Beckhard, Richard, Shubert, Richard F. editors, The Community of The
Future, The Drucker Foundation, Future Series,Jossey Bass Publishers, New York, 1998.