Received 21/12/2009 Accepted 9/7/2010 (004594)
1 Faculdade de Medicina Veterinária e Zootecnia, Universidade Estadual Paulista – UNESP, Distr. Rubião Jr, s/n, Botucatu, SP, Brasil, e-mail: victor_tagliacollo@yahoo.com.br *Corresponding author
Quality of propolis commercialized in the informal market
Qualidade da própolis comercializada no mercado informal
Victor Alberto TAGLIACOLLO1*, Ricardo de Oliveira ORSI1
1 Introduction
Propolis, also known as bee glue, is a resin-like product collected and elaborated by bees from vegetable exudates to maintain and repair the beehives. It is a complex resinous mixture which contains approximately 50% resin and balsam, 30% wax, 10% essential and aromatic oils, 5% pollen, and 5% impurities (THOMSON, 1990). Propolis is a relatively non-toxic substance (JASPRICA et al., 2007) and, due to its versatile biological and pharmacological effects, it has been considered an adjuvant in the treatment or prevention of many infectious diseases (DOBROWOLSKI et al., 1991; BANKOVA et al., 1995; FREITAS et al., 2006; BUFALO et al., 2009; CAMPANA et al., 2009).
The chemical composition of propolis is highly variable mainly due to the variability of plant species growing around the hive, from which the bees collect the exudates (BANKOVA et al., 1999; KUJUMGIEV et al., 1999; KUMAZAWA; HAMASAKA; NAKAYAMA, 2004; KATIRCIOGLU; MERCAN, 2006).
Consequently, some important biological compounds such as flavonoids, derivatives from aromatic acids and esters, terpenoids, and waxy acids can be present in different concentrations (BANKOVA et al., 1999; KATIRCIOGLU; MERCAN, 2006). Funari, Ferro and Mathor (2007) reported that, Baccharis dracunculifolia (“vassourinha” or “alecrim-do-campo”), vegetable source of the propolis from the São Paulo State, is the main source to collect the resin; however, according to Bankova et al. (1999), there are species such as Araucaria angustifolia (“pinheiro do Paraná”) and
Eucalyptus citriodora (“eucalipto”) which also provide the exudates for propolis collection.
Additionally, propolis composition can vary depending on the seasonality, illumination, altitude, collector type, and food availability and activity developed during propolis exploitation (BANKOVA et al., 1998; SFORCIN; NOVELLI; FUNARI, 2000; SILICI; KUTLUCA, 2005; CASTRO et al., 2007; SOUZA et al., 2010). Therefore, controlling the production, collection, and Resumo
O propósito desta pesquisa foi avaliar a qualidade da própolis produzida e comercializada informalmente no Estado de São Paulo através de análises físico-químicas dos extratos alcoólicos de própolis (EAP). Assim, foram analisadas 40 amostras de própolis in natura fornecidas por apicultores provenientes de 32 cidades. Os respectivos EAP foram elaborados na proporção de 30% (m/v) e as análises, realizadas segundo as normas presentes no Regulamento Técnico de Identidade e Qualidade da Própolis. Avaliou-se também o pH de cada amostra de EAP. Com relação ao extrato seco, verificou-se que 80% das amostras enquadraram-se no mínimo estabelecido pela legislação brasileira. Para a propriedade oxidante, 67,5% dos EAP estavam abaixo do tempo máximo de oxidação permitido. Para a solubilidade ao acetato de chumbo, 97,5% das amostras apresentaram resultados positivos enquanto que nenhuma das amostras mostrou-se negativa para solubilidade ao hidróxido de sódio. Para o teor de flavonoides, 95% das amostras apresentaram valores condizentes com o mínimo permitido. Para os compostos fenólicos, todas as amostras estavam de acordo com a legislação. Com relação ao pH, este apresentou-se ligeiramente ácido. Portanto, pode-se concluir que a maioria dos EAP está condizente com a legislação brasileira, sugerindo que a própolis produzida pelos apicultores é de boa qualidade.
Palavras-chave: própolis; análises físico-químicas; inspeção; apicultores. Abstract
The purpose of this research was to evaluate the quality of propolis produced and commercialized informally in São Paulo State through physicochemical analyses of ethanolic extracts of propolis (EEP). Thus, 40 samples of in nature propolis, provided by beekeepers from 32 towns, were analyzed. The EEP were prepared in a proportion of 30% (w/v), and the physicochemical tests were performed according to the Technical Regulation of Propolis Identity and Quality. The pH of each EEP sample was also evaluated. Regarding the dry extract, it was observed that 80% of the samples meet the minimum requirements established by the Brazilian legislation. With regard to the oxidizing property, 67.5% of EEP were below the maximum time allowed for oxidation. With regard to the solubility in lead acetate, 97.5% of the samples showed positive results, whereas no sample produced a negative result in terms of solubility in sodium hydroxide. Regarding the concentration of flavonoids, 95% of the samples produced results consistent with the minimum value allowed, and regarding the phenolic compounds, all samples were in accordance with the legislation. The EEP pH was slightly acidic. Therefore, it can be concluded that most EEP is consistently in accordance with the Brazilian legislation, which suggests that good quality propolis is produced by those beekeepers.
Keywords: bee glue; physicochemical analyses; inspection; beekeepers.
a Griffin´s glass which was filled up to 100 mL of 70% ethyl alcohol. This preparation was stored in an amber glass to protect from the effects of light, under frequent stirring, for seven days for the EEP preparation. Then, it was filtered through a 0.5 mm filter in order to obtain the alcoholic solution of propolis (ORSI et al., 2000).
2.3 Physicochemical analysis
Dry extract (%)
To determine the amount of dry extract in each sample, 20 mL of EEP was kept under refrigeration for 24 hours at 4 °C. The next step was to filter the EEP, and 5 mL of the filtered solution was withdrawn using a graduated pipette and placed in a previously weighed (P1) Griffin´s glass. The Griffin’s glass was dried in an oven at 105 °C for two hours. Next, it was placed in a dissector to reach room temperature to be weighed once again (P2). Finally, the percentage of dry extract was determined using the following Equation 1 (MELLO; PETROVICK, 2000):
P2 – P1 % Dry extract × 100
P1
= (1)
Oxidizing property (seconds)
To determine the oxidant activity of propolis, 2 mL of EEP were placed in a Griffin´s glass containing 48 mL of distilled water. Then, 0.5 mL of this solution was transferred to a 15 mL test tube. 0.5 mL of distilled water and 1 mL of 20% sulfuric acid were added to the same test tube. This mixture was cooled in an ice bath at 18-20 °C and 0.5 mL of potassium permanganate (KMnO4) 0.1 N was added to it. As a result, a violet color was observed. The oxidant activity was determined with a digital stopwatch. The necessary time for the violet color to disappear was considered an oxidant activity (FARMACOPÉIA BRASILEIRA, 1988).
Solubility in lead acetate
To determine the solubility in lead acetate, 0.5 mL of EEP were put in a test tube containing 0.5 mL of 10% lead acetate. The solution was stirred and set aside for a resting period of three minutes. A yellow homogeneous precipitated settled at the bottom of the test tube confirmed the solubility result (ASSOCIATION..., 1995).
Solubility in sodium hydroxide
To determine the solubility in sodium hydroxide, 0.5 mL of EEP were put in a test tube containing 0.5 mL of 50% sodium hydroxide. The solution was stirred and set aside for a resting period of 3 minutes. A white homogeneous precipitated settled at the bottom of the test tube confirmed the solubility result (ASSOCIATION..., 1995).
Amount of flavonoids in quercetin (%)
To determine the amount of flavonoids in quercetin, 0.4 mL of EEP sample was removed and transferred to a 25 mL improvement of the ethanolic extracts of propolis (EEP) is
essential to ensure quality for the commercialization of propolis. In Brazil, the Technical Regulation of Propolis Identity and Quality (TRPIQ) from the Ministry of Agriculture, Livestock, and Food Supply (BRASIL, 2001) seeks to regulate and maintain EEP quality in the national market. However, the EEP commercialization through the Brazilian informal market, without supervision and quality control, is still a fairly common trade. Thus, since the demand for propolis is increasing, especially due to the growth of the population´s interest for natural products, this study was aimed at evaluating the quality of the propolis commercialized in the informal market of São Paulo State.
2 Materials and methods
2.1 Origin of propolis samples
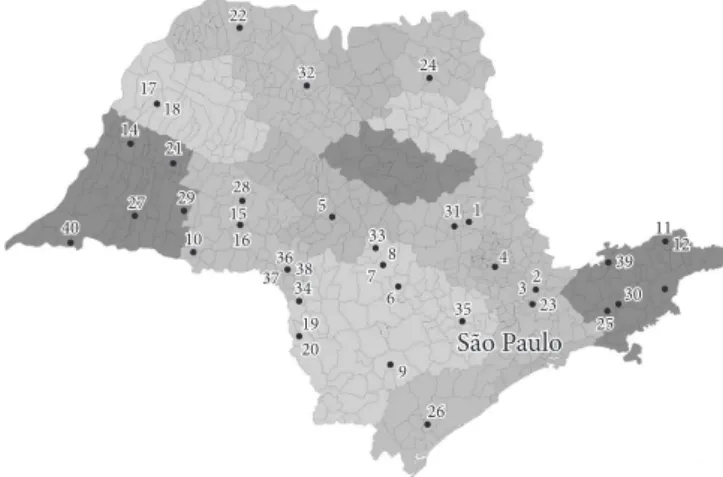
The propolis studied was acquired with the cooperation of producers from São Paulo, who provided 40 different in nature propolis samples from 32 different towns in São Paulo State (Figure 1). The contact with these beekeepers was established with the help of Office for the Rural Development of Regional Agriculture-Coordinating Office for General Technical Assistance (CATI).
2.2 Preparation of ethanolic extracts of propolis (EEP)
Each propolis sample was crushed individually using a kitchen blender. After that, 30 grams of in nature propolis powder, which were weighed on a scale, were transferred to
also influences the final concentration of dissolved compounds (PARK; IKEGAKI; ALENCAR, 2000) since the substances identified in propolis are also present in plant exudates (VILLANUEVA et al., 1970), which, in turn, vary from species to species (KUMAZAWA; HAMASAKA; NAKAYAMA, 2004).
3.2 Oxidizing property (seconds)
With regard to the oxidizing property of the EEP, it was verified that the analyzed samples ranged from 3 to 53 seconds (Table 1). The TRPIQ suggests a maximum time reaction of 22 seconds for the oxidizing property (BRASIL, 2001). Therefore, 67.5% (27 samples) of EEP are consistent according to the legislation, and 32.5% (13 samples) of EEP presented results over 22 seconds. Gonsales et al. (2005) detected levels of oxidant activity for alcoholic extracts of propolis, from different Brazilian states, ranging from 5.1 to 250.0 seconds. Sousa et al. (2007) reported values of 52.75 ±1.07 seconds for samples of propolis from São Paulo State (region of Franca) and variations from 9.58 to 54.75 seconds for propolis samples from Minas Gerais State (region of Passos). Rates of oxidation higher than 22 seconds, as detected in some samples of propolis, can be related to relative humidity levels, which could encourage the natural oxidation of the product during its production (BASTOS, 2001). When it comes to the oxidizing property, probably, the high percentage of sample values that are higher than the maximum limits set by the legislation is due to the bad stocking of the product.
3.3 Solubility of EEP particles in lead acetate and sodium hydroxide
Solubility in lead acetate aims at verifying the homogeneity of EEP particles in a saline solution. According to the results, only one sample (Sample 18 - Guaraçaí B) of EEP presented negative results, and therefore it is not compatible with the national current legislation (Table 1).
Regarding solubility in sodium hydroxide, whose objective is to verify the homogeneity of the EEP particles in a base solution, all samples were tested positively and are therefore in accordance with the legislation.
3.4 Amounts of flavonoid in quercetin (%)
Regarding the amount of Flavonoids in Quercetin (%) of EEP, it was verified that the analyzed samples ranged from 0.03% to 1.02% (Table 1). The amount of flavonoids in quecertin (%) of the samples 10 (from Cruzália) and 33 (from São Manoel) were not analyzed due to the insufficient quantity of propolis in nature provided by the beekeepers for the EEP production.
According to the current Brazilian Legislation (BRASIL, 2001), the minimum percentage of flavonoids in the EEP should be 0.25%. As a result, two samples (Sample 18 - Guaraçaí B and Sample 29 - Rancharia) presented values below the limit set. These samples in natureappeared atypical, probably as a consequence of a bad stocking process which influenced all parameters of quality, except for solubility in sodium hydroxide (see Table 1).
volumetric balloon. Then, 0.5 mL of aluminum chloride was added to 5% in absolute methanol completing the balloon volume with absolute methanol. The solution was shaken and protected from the light in order to rest for 30 minutes. After 30 minutes, readings were made in a UV spectrophotometer at 425 nm. Absolute methanol was used to reset the equipment. For the preparation of the standard solution, 0.2 mg of quercetin was inserted in a 25 mL volumetric balloon, and 0.5 mL of aluminum chloride was added to 5% methanol. The balloon was filled up to 25 mL with methanol. The solution was stirred and then protected from light in order to rest for the next 30 minutes. The amount of flavonoids in quercetin was determined according to the Equation 2 (POPOVA et al., 2005):
(
–1)
sample readings × standard massAmount of flavonoids mg.mL
standard readings × sample volume
= (2)
Phenolic compounds (%)
To determine the percentage of phenolic compounds, 2.5 mL of EEP was weighed (P1). Next, 7 mL of ethylic alcohol and 0.5 mL of 10% lead acetate were added. The solution was shaken and set aside to rest for 24 hours at room temperature. After this time, the mixture was filtered through a 0.5 mm previously weighed (P2) paper filter and kept at room temperature for 12 hours. Then, the paper filter was placed in a constant temperature oven at 50 °C for one hour and was weighed again (P3). The percentage of phenolic compounds was determined by using the following Equation 3 (ASSOCIATION..., 1995, with adaptations):
( ) P3 – P2
Phenolics % × 100 P1
= (3)
pH
To determine the pH of the EEP, a digital pH meter model Tecnopon MPA 210 was used. 50 mL of EEP was put into a Griffin´s glass and brought in contact with the machine’s reader. The pH value was registered after stabilization. To standardize the pH meter readings, two solutions were used: pH 4.0 and pH 7.0 (FARMACOPÉIA BRASILEIRA, 1988).
3 Results and discussion
3.1 Dry extract (%)
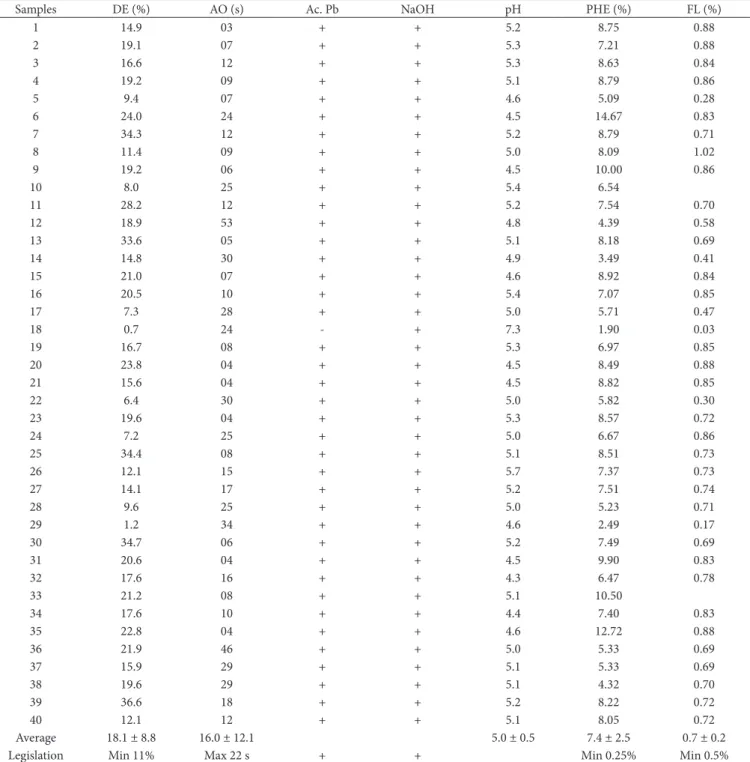
Table 1. Results for physicochemical analyses of 40 ethanolic extracts of propolis (EEP) samples produced and commercialized in the informal market of São Paulo State.
Samples DE (%) AO (s) Ac. Pb NaOH pH PHE (%) FL (%)
1 14.9 03 + + 5.2 8.75 0.88
2 19.1 07 + + 5.3 7.21 0.88
3 16.6 12 + + 5.3 8.63 0.84
4 19.2 09 + + 5.1 8.79 0.86
5 9.4 07 + + 4.6 5.09 0.28
6 24.0 24 + + 4.5 14.67 0.83
7 34.3 12 + + 5.2 8.79 0.71
8 11.4 09 + + 5.0 8.09 1.02
9 19.2 06 + + 4.5 10.00 0.86
10 8.0 25 + + 5.4 6.54
11 28.2 12 + + 5.2 7.54 0.70
12 18.9 53 + + 4.8 4.39 0.58
13 33.6 05 + + 5.1 8.18 0.69
14 14.8 30 + + 4.9 3.49 0.41
15 21.0 07 + + 4.6 8.92 0.84
16 20.5 10 + + 5.4 7.07 0.85
17 7.3 28 + + 5.0 5.71 0.47
18 0.7 24 - + 7.3 1.90 0.03
19 16.7 08 + + 5.3 6.97 0.85
20 23.8 04 + + 4.5 8.49 0.88
21 15.6 04 + + 4.5 8.82 0.85
22 6.4 30 + + 5.0 5.82 0.30
23 19.6 04 + + 5.3 8.57 0.72
24 7.2 25 + + 5.0 6.67 0.86
25 34.4 08 + + 5.1 8.51 0.73
26 12.1 15 + + 5.7 7.37 0.73
27 14.1 17 + + 5.2 7.51 0.74
28 9.6 25 + + 5.0 5.23 0.71
29 1.2 34 + + 4.6 2.49 0.17
30 34.7 06 + + 5.2 7.49 0.69
31 20.6 04 + + 4.5 9.90 0.83
32 17.6 16 + + 4.3 6.47 0.78
33 21.2 08 + + 5.1 10.50
34 17.6 10 + + 4.4 7.40 0.83
35 22.8 04 + + 4.6 12.72 0.88
36 21.9 46 + + 5.0 5.33 0.69
37 15.9 29 + + 5.1 5.33 0.69
38 19.6 29 + + 5.1 4.32 0.70
39 36.6 18 + + 5.2 8.22 0.72
40 12.1 12 + + 5.1 8.05 0.72
Average 18.1 ± 8.8 16.0 ± 12.1 5.0 ± 0.5 7.4 ± 2.5 0.7 ± 0.2
Legislation Min 11% Max 22 s + + Min 0.25% Min 0.5%
Average following by standard deviation. The symbol (+) means positive result and (–) means negative result. Dry extract (% DE), Oxidizing property (OA seconds), Solubility in lead acetate (Ac. Pb), Solubility in sodium hydroxide (NaOH), pH, Phenolic compounds (% PHE), and Amount of flavonoids in quercetin (% FL).
Woisky and Salatino (1996), Marcucci et al. (1998) and Kumazawa, Hamasaka and Nakayama (2004) reported low values of flavonoids (0.83%, 0.84% and 0.05% respectively) in Brazilian propolis. On the other hand, Kujumgiev et al. (1999) reported high amounts of flavonoids (42.0%) in Bulgarian propolis. These results indicate that the propolis produced in the tropics contain lower levels of flavonoids in comparison with that from the temperate tropics.
3.5 Phenolic compounds (%)
República Federativa do Brasil, Brasília, DF, 23 jan. 2001. Seção 1, p. 18-23. Available from: <http://www.extranet.agricultura.com. br>. Access in: 12 jul. 2010.
BUFALO, M. et al. Anti-poliovirus activity of Baccharis dracunculifolia
and propolis by cell viability determination and real-time PCR. Journal of Applied Microbiology, v. 107, p. 1669-1680, 2009. PMid:19457040. http://dx.doi.org/10.1111/j.1365-2672.2009.04354.x
CASTRO, M. L. et al. Própolis do sudeste e nordeste do Brasil: influência da sazonalidade na atividade antibacteriana e composição fenólica. Quimica Nova, v. 30, p.1512-1521, 2007. http://dx.doi. org/10.1590/S0100-40422007000700003
CAMPANA, R. et al. Antimicrobial activity of two propolis samples against human Campylobacter jejuni. Journal of Medicinal Food, v. 12, p. 1050-1056, 2009. PMid:19857069. http://dx.doi.org/10.1089/ jmf.2008.0173
DOBROWOLSKI, J. W. et al. Antibacterial, antifungal, antiamoebic, anti-inflammatory and antipyretic studies on propolis bee products.
Journal of Ethnopharmacology, v. 35, p.77-82, 1991. http://dx.doi. org/10.1016/0378-8741(91)90135-Z
FARMACOPÉIA Brasileira. 4th ed. São Paulo: Atheneu, 1988. FREITAS, S. F. et al. In vitro effects of propolis on Giardia
duodenalis trophozoites. Phytomedicine, v. 13, p. 170-175, 2006. PMid:16428024. http://dx.doi.org/10.1016/j.phymed.2004.07.008 FUNARI, C. S.; FERRO, V. O.; MATHOR, M. B. Analysis of propolis
from Baccharis dracunculifolia DC. and its effects on mouse fibroblasts. Journal Ethnopharmacology, v. 111, p. 206-212, 2007. PMid:17207952. http://dx.doi.org/10.1016/j.jep.2006.11.032 GONSALES, G. Z. et al. Análises físico-químicas de extrato alcoólico
de própolis. Boletim de Industria Animal, v. 62, p. 215-219, 2005. JASPRICA, I. et al. In vivo study of propolis supplementation
effects on anti-oxidative status and red blood cells. Journal of Ethnopharmacology, v. 110, p. 548-554, 2007. PMid:17113741. http://dx.doi.org/10.1016/j.jep.2006.10.023
KATIRCIOGLU, H.; MERCAN, N. Antimicrobial activity and chemical compositions of Turkish propolis from different regions.
African Journal of Biotechnology, v. 5, p. 1151-1153, 2006. KROL, W. et al. Synergistic effect of ethanolic extract of propolis and
antibiotics on the growth of Staphylococcus aureus. Arzneinmittel Forschung Drug Research, v. 43, p. 607-609, 1993.
KUJUMGIEV, A. et al. Antibacterial, antifungal and antiviral activity of propolis of different geographic origin. Journal of Enthonopharmacology, v. 64, p. 235-240, 1999. http://dx.doi. org/10.1016/S0378-8741(98)00131-7
KUMAZAWA, S.; HAMASAKA, T.; NAKAYAMA, T. Antioxidant activity of propolis of various geographic origins. Food Chemistry, v. 84, p. 329-339, 2004. http://dx.doi.org/10.1016/S0308-8146(03)00216-4
MARCUCCI, M. C. et al. Chemical Composition of Brazilian from São Paulo State. Zeitschrift für Naturforschung, v. 53, p. 117-119, 1998. MARCUCCI, M. C. et al. Phenolic compounds from Brazilian propolis with pharmacological activities. Journal of Ethnopharmacology, v. 74, p. 105-112, 2001. http://dx.doi.org/10.1016/S0378-8741(00)00326-3
MELLO, J. C. P.; PETROVICK, P. R. Quality control of Baccharis trimera (Less.) DC. (Asteraceae) hydroalcoholic extracts. Acta Farma Bonaerense, v. 19, p. 211-215, 2000.
ORSI, R. O. et al. Immunomodulatory action of propolis on macrophage activation. Journal of Venomous Animals and Toxins including around 10.1% for Brazilian propolis, a value that is higher than
the average value was found in this study (Table 1).
Brazilian propolis is worldwide known for its unusual chemical composition, especially for the abundance of phenolic compounds (MARCUCCI et al., 2001). Moreover, the presence of phenolic compounds in high quantity has increased the value of apitherapy in the international market since its antimicrobial effect has been attributed to the synergism of phenolic compounds as well as other substances present in the resin (KROL et al., 1993).
3.6 pH
With regard to the pH of EEP, it was verified that the analyzed samples ranged from 4.35 to a maximum of 7.30 (Table 1). The TRPIQ (BRASIL, 2001) has not established a quality limit value for this variable. However, Gonsales et al. (2005) reported pH values close to 5.0, similar to those found in this study. For that reason, it can be presumed the pH of EEP tends to be somewhat acidic.
4 Conclusions
Most of ethanolic extracts of propolis is in accordance with the Brazilian Legislation, which suggests that the propolis commercialized in the informal market of São Paulo State is of good quality.
Acknowledgements
The authors are grateful for the support provided by the Office for the Rural Development of Regional Agriculture-Coordinating Office for General Technical Assistance (CATI). The first author was financially supported by FAPESP (process 06/53890-0).
References
ASSOCIATION OF OFFICIAL ANALYTICAL CHEMISTRY - AOAC.
Association of Official Analytical Chemist Official Methods of Analysis. 16th ed. Washington: AOAC, 1995.
BANKOVA, V. et al. Seasonal variations of the chemical composition of Brazilian propolis. Apidologie, v. 29, p. 361-367, 1998. http:// dx.doi.org/10.1051/apido:19980406
BANKOVA, V. et al. Phytochemical evidence for the plant origin of Brazilian propolis from São Paulo State. Zeitschrift für Naturforschung, v. 54, p. 401-405, 1999.
BANKOVA, V. et al. Chemical composition and antibacterial activity of Brazilian propolis. Zeitschrift für Naturforschung, v. 50, p. 167-172, 1995.
BASTOS, E. M. Origem botânica e indicadores de qualidade da “própolis verde” produzida no Estado de Minas Gerais, Brasil. 2001. Tese (Doutorado em Entomologia)-Faculdade de Filosofia, Ciências e Letras de Ribeirão Preto, Universidade de São Paulo, Ribeirão Preto, 2001.
BONVEHI, J. S.; COLL, F. V. V. Phenolic composition of propolis from China and South America. Zeitschrift für Naturforschung, v. 49, p. 712-718, 1994.
SOUSA, P. B. et al. Perfis fisicoquimico e cromatográfico de amostras de própolis produzidas nas microrregiões de Franca (SP) e Passos (MG), Brasil. Brazilian Journal of Pharmacognosy, v. 17, p. 85-93, 2007.
SOUZA, E. A. et al. Seasonality and production method influence on the physical-chemical properties of propolis. Archivos de Zootecnia, 2010. In press.
THOMSON, W. Propolis. Medical Journal of Australia, v. 153, p. 654, 1990.
VILLANUEVA, V. R. et al. Les flavonoids de la propolis. Isolement d’une novelle substance bacteriostatique: la pinicembrine (dihydroxy 5,7 flavonone). Annales de Insitut Pasteur, v. 118, p.84-87, 1970. WOISKY, R. G.; SALATINO, A. Analysis of propolis: some parameters
and procedures for chemical quality control. Journal of Apicultural Research, v. 37, p. 99-105, 1996.
Tropical Diseases, v. 6, p. 205-219, 2000. http://dx.doi.org/10.1590/ S0104-79302000000200006
PARK, Y. K.; IKEGAKI, M.; ALENCAR, S. M. Classificação das própolis brasileiras a partir de suas características físico-químicas e propriedades biológicas. Mensagem doce, v. 58, p. 2-7, 2000. POPOVA, M. et al. Antibacterial activity of Turkish propolis and its
qualitative and quantitative chemical composition. Phytomedicine, v. 12, p. 221-228, 2005. PMid:15830845. http://dx.doi.org/10.1016/j. phymed.2003.09.007
SFORCIN, J. M.; NOVELLI, E. L. B.; FUNARI, S. R. C. Seasonal effect of Brazilian propolis on seric biochemical variables. Journal of Venomous Animals and Toxins including Tropical Diseases, v. 8, p. 244-254, 2000.