http://dx.doi.org/10.1590/1806-9061-2015-0080
in Goose Hepatocytes
Author(s)
Xiong XPI
Song QI
Han CCI
Gan WI
He FI
Wei SHI
Liu HHI
Xu HYI
I Institute of Animal breeding & Genetic,
Sichuan Agricultural University, Chengdu, Sichuan 611130, P.R. China
Mail Address
Corresponding author e-mail address Chun-Chun Han
Associate Researcher, Institute of Animal breeding & Genetic, Sichuan Agricultural University, Chengdu, Sichuan 625014, P.R. China
Phone: 86-2886290985 Fax: 86-2886291010
Email: chunchunhai_510@163.com
Keywords
G6Pase; insulin; PEPCK; PI3k/Akt/mTOR.
Submitted: November/2015 Approved: January/2016
ABSTRACT
To identify what makes insulin have an activating or inhibiting role in gluconeogenesis in goose hepatocytes and whether insulin regulates PEPCK and G6Pase through the PI3k/Akt/mTOR pathway
or not, goose primary hepatocytes were isolated and cultured in
vitro. After 12h cultured in serum-free medium, hepatocytes were
incubated for 24 h in the medium with no addition (control) or with the addition of50, 100, and 150 nM of insulin, 1000 nM NVP-BEZ235, or co-addition of 150nM insulin and 1000nM NVP-BEZ235. Glucose concentration and PEPCK and G6Pase expression were determined. The results showed that PEPCK and G6Pase mRNA levels and activities were up regulated in the 50, 100, and 150nM insulin treatments, while glucose concentration was not significantly altered
(p>0.05). Compared with the activation role of 150nM insulin alone,
the co-treatment with1000nM NVP-BEZ235 and 150nM insulin significantly down regulated PEPCK mRNA level and G6Pase protein activity (p<0.05). However, there is a different result on mRNA level of G6Pase. In conclusion, G6Pase and PEPCK are up regulated by insulin through PI3k/Akt/mTOR pathway in goose hepatocytes. However, G6Pase mRNA and protein levels may be regulated by insulin through different signaling pathways.
INTRODUCTION
Insulin, secreted from pancreatic β cells, is a known primary regulator
of glucose metabolism, by counter regulatory glucagon and growth hormone (Cryer,1993; Saltiel & Kahn,2001). As the only hormone that
lowers blood glucose in vivo, insulin plays an important role in hepatic
glucose production. In diabetic individuals, insulin action is impaired,
resulting in increased hepatic glucose production (Prasad et al., 2005).
Many studies indicated that insulin has a close relationship with gluconeogenesis. Donkin & Armentano (1995) showed that insulin reduced gluconeogenesis and increased glycogenesis from propionate and lactate in hepatocytes of pre-ruminating calves, but had no effect
on the hepatocytes of ruminating calves. Edgerton et al. (2009) proved
that the gluconeogenic flux can be rapidly inhibited by high insulin levels in dogs. A study showed that modulated gluconeogenesis by
inhibiting of the coactivator TORC2 (Dentin et al., 2007).
Phosphoenolpyruvate carboxykinase (PEPCK) and glucose 6-phosphatase (G6Pase) are enzymes that limit gluconeogenesis rate
(Sato et al., 2011). In addition, G6Pase is a critical enzyme in the last
step of the glycogenolytic pathway (Podolin et al., 1999). It was shown
that insulin inhibits gluconeogenesis by suppressing the expression of PEPCK and G6Pase (O’Brien & Granner, 1996). And in the fed state,
al., 2009). Interestingly, Ziv et al. (1996) showed that insulin failed to inhibit PEPCK and G6Pase activity even during the pre-diabetic (A) state. Recent data also suggest that insulin glargine (a long-acting insulin
analogue) has no effect on G6Pase or PEPCK (Xu et
al., 2015).
The PI3k/Akt/mTOR pathway has a primary role in many crucial cellular processes, including periodic cell proliferation, differentiation, survival, protein synthesis, and glucose metabolism (Westin, 2014; Wu & Hu, 2010; Engelman, 2009). NVP-BEZ235, an inhibitor of both PI3K and mTOR, inhibits tumor cell proliferation and induces cell cycle arrest in the G1
phase (Serra et al., 2008). Previous studies have shown
that the glucose metabolism can be regulated by insulin through the PI3K signal transduction cascade (Saltiel & Kahn, 2001). When this pathway is activated, the expression of G6Pase and PEPCK is reduced, thereby
decreasing hepatic glucose production (O’Brien et al.,
2001; Yabaluri & Bashyam, 2010). Akt, as a major cellular transduction element downstream PI3K, is a member of the insulin signaling pathway (Saltiel & Kahn, 2001). The activation of mTOR by insulin is relayed through the insulin receptor/insulin receptor substrate-1 (IRS-1)/PI3K/Akt pathway (Fisher & White, 2004).
Our previous study showed that the inhibition of PI3k/Akt/mTOR pathway can reduce of lipid deposition induced by insulin in goose hepatocytes, and therefore, we hypothesized that the regulation of gluconeogenesis by insulin may be mediated by PI3k/Akt/mTOR pathway in goose hepatocytes. In the present study, two key enzymes that limit gluconeogenesis rate, PEPCK and G6Pase, were used to study the gluconeogenesis regulation by insulin in goose primary hepatocytes. The results will help to investigate the regulation mechanism of gluconeogenesis by insulin in goose hepatocytes.
MATERIALS AND METHODS
Isolation and culture of primary hepatocytes
Hepatocytes were isolated from three 10-day-old Tianfu meat-typegeese from the Experimental Farm of Sichuan Agricultural University using a modification of the “two-step procedure” described by Seglen (Seglen, 1976). Differently from Seglen, the goose liver was removed before the pre-perfusion step. Cell viability was greater than 90%, as assessed by the try pan blue dye exclusion test. Freshly isolated
hepatocytes were diluted to 1×10⁶ cells/mL. The
culture medium was composed of DMEM (containing 1.0 g/L glucose; GIBCO, USA) with 100 IU/mL penicillin (Sigma, USA), 100 μg/mL streptomycin (Sigma, USA), 2 mM glutamine (Sigma, USA), and 100 mL/L fetal bovine serum (Clark, Australia). The hepatocytes were
then plated in 60-mm culture dishes at 3×10⁶ cells per
dish for total RNA and intracellular proteins isolation. Cultures were incubated at 40ºC in a humidified
atmosphere containing 5% CO2. The media were
renewed after 3h, and after 12h, the media was replaced with serum-free media for another 12h. Next, the cells were separately treated with serum-free media supplemented with 50, 100, or 150 nM of insulin (Sellcek, USA) and incubated for 24 h, while the control cells were cultured with serum-free medium for 24 h. In addition, some cells were treated with serum-free medium supplemented with 1000 nM NVP-BEZ235 (Sellcek, USA) for 24 h or first treated with serum-free medium supplemented with1000 nM NVP-BEZ235for 1h and then 150 nM insulin were added, and incubated for 24h.
cDNA synthesis and quantitative Real-Time PCR
RNA was extracted using the TRIzol (Invitrogen, USA), and reverse-transcribed using the Primer Script TM RT system kit for real-time PCR (TaKaRa, Japan) method, according to the manufacturer’s protocol. The quantitative real-time PCR reaction contained the newly-generated cDNA template, SYBR Premix Ex Taq TM (TaKaRa, Japan), sterile water, and primers of target genes. Real-time PCR was performed on the Cycler system (one cycle of 95°C for 10 s, followed by 40 cycles of 95°C for 5 s, and 60°C for 40 s). For each experimental sample, a normalized target gene level, corresponding to the target gene expression level relative to the expression levels of the housekeeping
genes β-actin and 18S, was determined by the 2-∆∆Ct
method as described (Livak & Schmittgen, 2001). The following primer sequences were used:
β-actin Upstream5’-CAACGAGCGGTTCAGGTGT-3’,
Downstream5’-TGGAGTTGAAGGTGGTCTCG-3’; 18s Upstream5’-TTGGTGGAGCGATTTGTC-3’,
Downstream5’-ATCTCGGGTGGCTGAACG-3’; PEPCK Upstream5’-CAGCTACGTTGGTAAAGATGGTT-3’, Downstream5’-GGGCAATCAATCCAGAAAATG-3’; G6PaseUpstream5’-CTCTTGCCCGACACGATGGA-3’,
Intracellular protein isolation and measurement of G6Pase activity
After 24h treatment of the hepatocytes, intracellular proteins were isolated according to the following steps: first, the medium was aspirated, then a pre-cooled PBS solution was used to wash the dish three times; second, a protein lysate was added, and every dish was placed on the ice 30S, then the cells repeatedly aspirated using a pipette until all cells were suspended in the buffer; last, the cell suspension was collected by centrifugation at 4 ºC, 10000 r/min for 5 min, and the supernatant was collected. The enzyme activity of G6Pase was measured using an ELISA kit (GBD, San Diego, CA, USA), according to the manufacturer’s instructions.
Determination of glucose concentration in the culture medium
The culture medium was collected to determine glucose concentration. The concentration of glucose in the culture medium is considered an indicator of glucose production, which may be regulated by liver through the mobilization of glycogen and
hepatic gluconeogenesis (Liang et al., 2013). Glucose
concentration of every treatment was detected in triplicate using Blood Glucose Meter (Sinocare Inc, China), according to the manufacturer’s instruction.
Statistical Analysis
The results are presented as the mean ± standard deviation (SD). Statistical analyses were conducted
using a two-tailed t-test of SAS Proprietary Software Release 8.1 (SAS Institute Inc., Cary, NC). A significance
level of p<0.05 was accepted. Every experiment was
repeated with three biological samples, and each sample was run in triplicate.
RESULTS
The effects of insulin treatment on expression of PEPCK and G6Pase
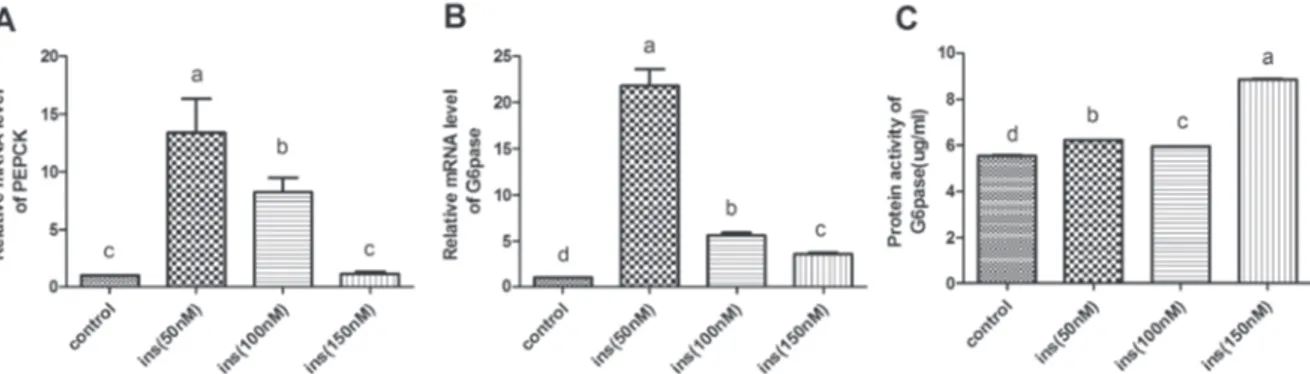
As shown in the Figure 1, compared with control group, the mRNA expression of G6Pase and PEPCK were significantly up-regulated in the 50nM and 100nM
insulin treatment groups (p<0.05); Moreover, the
protein activity of G6Pase was significantly increased
by all three concentrations of insulin (p<0.05). The
concentration of 50 nM insulin showed maximum up regulation of mRNA expression of G6Pase and PEPCK, and the 150nM insulin treatment group has the strongest effect on the increase of G6Paseprotein activity.
Effects of insulin and NVP-BEZ235 co-treatment on expression of PEPCK and G6Pase
Figure 2 summarizes the effect of insulin and NVP-BEZ235 on the enzyme activity of G6Pase and on the mRNA expression of G6Pase and PEPCK. After 24h treatment, compared with the activation role of 150nM insulin alone, 1000nM NVP-BEZ235 and 150nM insulin co-treatment had an inhibitory effect on the mRNA
Table 1 – Primer sequences for real-time PCR
Gene Name Upstream (5’-3’) Downstream (5’-3’) Product size (bp) PEPCK CAGCTACGTTGGTAAAGATGGTT GGGCAATCAATCCAGAAAATG 114 G6Pase CTCTTGCCCGACACGATGGA TGCACGAGACGGACTACTACAGC 269
β-actin CAACGAGCGGTTCAGGTGT TGGAGTTGAAGGTGGTCTCG 92
18S TTGGTGGAGCGATTTGTC ATCTCGGGTGGCTGAACG 129
level of PEPCK and on the protein activity of G6Pase. However, mRNA levels of G6Pase were different. Compared with the control group, both1000nM NVP-BEZ235 and 150nM insulin significantly up regulated
G6Pase mRNA level (p<0.05), and the treatment of
1000 nM NVP-BEZ235 and 150 nM insulin together up regulated G6Pase mRNA expression more significantly (p<0.05).
Effects of insulin and NVP-BEZ235 co-treatment or alone on glucose concentration of goose hepatocytes
Compared with the control group, Figure 3 shows that 100 and 150 nM insulin can increase hepatocyte glucose concentration, despite not significantly
(p>0.05). Compared with the control group, both
the co-treatment with 150 nM insulin and 1000 nM BEZ235 and the treatment of 1000 nM NVP-BEZ235 alone significantly down regulated glucose
concentrations (p<0.05). As expected, compared with
150 nM insulin alone, the treatment with both 1000nM NVP-BEZ235 and 150 nM insulin reduced glucose concentration, despite not significantly (p>0.05).
DISCUSSION
Since the geese are likely to show non-pathological hepatic steatosis when overfeeding, like the starling
(Sturnus roseus), as a result of energy storage before
migration (Pilo & George, 1983), goose primary hepatocytes were used to study the regulating mechanism of insulin on gluconeogenesis. Many previous studies have shown that insulin strongly inhibited the expression of G6Pase and PEPCK (O’Brien
& Granner, 1996; Argaud et al., 1996), however,
another study showed that insulin failed to inhibit PEPCK and G6Pase activity in the pre-diabetic (A)
state (Zivet al., 1996). In recent years, the effects of
insulin on the enzymes PEPCK and G6Pase are still
not fully elucidated. Ropelle et al. (2009) believed
that the activities of the enzymes PEPCK and G6Pase were suppressed by insulin in the fed state. In the rat H4IIE hepatoma cell line, the gene expression of G6Pase and PEPCK were also down regulated by 10
nM insulin (Kong et al., 2013). The study on heap 1-6
cells indicated that the treatment with 100nM insulin significantly down regulated the expression of G6Pase
and PEPCK (Yuan et al., 2015). However, Xu
et al. (2015) suggested that insulin glargine
(a long-acting insulin analogue) had no effect on G6Pase or PEPCK. In extremely low birth weight infants receiving total parenteral nutrition, insulin is not able to regulate gluconeogenesis, indicating that insulin has
no effect on PEPCK or G6Pase (Chacko et al.,
2011).
One of our aims in the present study was to identify that makes insulin have an activating or inhibiting role on the gluconeogenesis in goose hepatocytes. We found that both the mRNA expression and protein level
Figure 2 – Effects of insulin and NVP-BEZ235 on the expression of PEPCK and G6Pase. Different uppercase letters in the same set indicate difference among treatments at p<0.05. After 12h in serum-free medium, hepatocytes were incubated for 24 h with no addition (control) or with 150 nM insulin, 1000 nM NVP-BEZ235, or co-addition of 150 nM insulin and 1000 nM NVP-BEZ235. “NVP” indicates NVP-BEZ235; “NVP+ins” indicates 1000 nM NVP-BEZ235 and 150 nM insulin.
of G6Pase and PEPCK were up regulated in all the insulin-treated groups The highest up regulation of mRNA levels of G6Pase and PEPCK were observed at the insulin concentration of 50nM,whereasthe highest protein activity of G6Pase was detected at the insulin concentration of 150 nM (Figure 1). On the other hand, glucose concentration increases after insulin treatments were not significantly different (Figure 3A). These results indicate that insulin has an activating effect on the gluconeogenesis in goose hepatocytes at a low concentration (less than 150 nM).
The PI3k/Akt/mTOR pathway, as many studies reported, plays an essential role in multiple critical cellular activities (Westin, 2014; Yuan & Cantley, 2008). After the activation of PI3k/Akt/mTOR pathway, the expression of G6Pase and PEPCK is reduced, thereby decreasing hepatic glucose production (Yabaluri & Bashyam, 2010). Akt and mTOR (mTORC1 and mTORC2 subtypes) are the downstream genes of PI3k, but their relation is complex. The PI3K pathway was activated when mTORC1 was suppressed due to mTORC2 negative feedback, resulting in Akt phosphorylation
(O’Reilly et al., 2006). However, Akt activity was
reduced when mTORC1 was inhibited by rapamycin for
a long time (Sarbassov et al., 2006). It was suggested
that the inhibition of glucose production by insulin is
PI3k/Akt-dependent (Kong et al., 2013). When insulin
was added with either PI3k inhibitor LY294002 or Akt inhibitor A6730 in H4IIE cells, the inhibition of glucose
production by insulin was reversed. Eckert et al.(2007)
demonstrated that at least two pathways are required for glucose signaling inHL1C hepatomas, one of which is dependent on a non-Pl3-kinase intermediary, which is inhibited by LY294002 and LY303511. Another work suggested that treatment of L6 myotubes with 100nM insulin can increase Akt and mTOR phosphorylation
(Hwang et al., 2012). Saltiel & Kahn (2001) showed
that glucose metabolism can be regulated by insulin through the PI3K signal transduction cascade. In our study, the results showed that the expression levels of the PEPCK gene and of the G6Pase protein were significantly lower in the co-treatment with 1000 nM NVP-BEZ235 and 150 nM insulin (Figure 2A,2C) than in the treatment with 150 nM insulin alone (Figure 2B). A similar result was obtained for glucose concentration (Figure 3B). However, to our surprise, the mRNA level of G6Pase was higher in the 150nM insulin treatment. Similarly, compared with control group, the co-treatment with NVP-BEZ235 and insulin revealed lower expression levels of the two enzymes and of glucose concentration (Figure 2A, 2C). Considering that the results of protein and mRNA levels of G6Pase were
different in our study, we hypothesize that insulin regulates mRNA and protein expression of G6Pase through different pathways. The results of present study also indicate that insulin-promotion of G6Pase and PEPCK are reduced when the PI3k/Akt/mTOR pathway is suppressed by NVP-BEZ235.
Taken together, G6Pase and PEPCK, the enzymes that limit gluconeogenesis rate, are up regulated by insulin through the PI3k/Akt/mTOR pathway in goose hepatocytes. However, the regulation of mRNA and protein levels of G6Pase by insulin may be mediated by different signaling pathways.
ACKNOWLEDGEMENTS
The work was supported by the National Natural Science Funds of China (No. 31101712), and the Research Fund for the Doctoral Program of Higher Education of China (No. 20115103120006).
REFERENCES
Argaud D, Zhang Q, Pan W, Maitra S, Pilkis SJ, Lange AL. Regulation of rat liver glucose-6-phosphatase gene expression in different nutritional and hormonal states: gene structure and 50-flanking sequence. Diabetes 1996;45(11):1563–1571.
Chacko SK, Ordonez J, Sauer PJ, Sunehaq AL. Gluconeogenesis is not regulated by either glucose or insulin in extremely low birth weight infants receiving total parenteral nutrition. The Journal of Pediatrics 2011;158(6):891-896.
Cryer PE. Glucose counterregulation: prevention and correction of hypoglycemia in humans. American Journal of Physiology 1993;264:149-155.
Dentin R, Liu Y, Koo SH, Hedrick S, Vargas T, Heredia J, et al. Insulin modulates gluconeogenesis by inhibition of the coactivator TORC2. Nature 2007;449(7160):366-369.
Donkin SS, Armentano LE. Insulin and glucagon regulation of gluconeogenesis in preruminating and ruminating bovine. Journal of Animal Science 1995;73(2):546-551.
Eckert DT, Collier JJ, Scott DK. The Glucose-Mediated Induction of Pyruvate Kinase, but not Glucose-6-Phosphatase, Is Inhibited by Ly294002 and Ly303511 via a PI3Kinase-Independent Mechanism in HL1C Hepatomas. Diabetes 2007;56(1):518
Edgerton DS, Ramnanan CJ, Grueter CA, Johnson KM, Lautz M, Neal DW, et al. Effects of insulin on the metabolic control of hepatic gluconeogenesis in vivo. Diabetes 2009;58(12):2766-2775.
Engelman JA. Targeting PI3K signalling in cancer: opportunities, challenges and limitations.Nature Reviews Cancer 2009;9(8):550-562.
Fisher TL, White MF. Signaling pathways: the benefits of good communication.Current biology 2004;14(23):1005–1007.
Kong LJ, Feng W, Wright M, Chen Y, Dallas-yang Q, Zhou YP, et al.
FGF21 suppresses hepatic glucose production through the activation of atypical protein kinase Cι/λ. European Journal of Pharmacology 2013;702(1-3):302-308.
Liang J, Liu C, Qiao A, Cui Y, Zhang H, Cui A, et al. MicroRNA-29a-c decrease fasting blood glucose levels by negatively regulating hepatic gluconeogenesis. Journal of hepatology 2013;58(3):535-542.
Livak KJ, Schmittgen TD. Analysis of relative gene expression data using real-time quantitative PCR and the 2-∆∆Ct Method. Methods 2001;25(4):402-408.
O’Brien RM, Granner DK. Regulation of gene expression by insulin. Physiological Reviews 1996;76(4):1109 –1161
O’Brien RM, Streeper RS, Ayala JE, Stadelmaier BT, Hornbuckle LA. Insulin-regulated gene expression. Biochemical Society transactions 2001;29(4): 552–558.
O’Reilly KE, Rojo F, She QB, Solit D, Mills GB, Smith D, et al. mTOR inhibition induces upstream receptor tyrosine kinase signaling and activates Akt. Cancer Research 2006;66(3):1500-8.
Pilo B, George JC. Diurnal and seasonal variations in liver glycogen and fat in relation to metabolic status of liver and m. pectoralis in the migratory starling, Sturnus roseus, wintering in India. Comparative Biochemistry and Physiology. A Comparative Physiology 1983;74(3):601-604
Podolin DA, Wei Y, Pagliassotti MJ. Effects of high fat diet and voluntary wheel running on gluconeogenesis and lipolysis in rats. Journal of Applied Physiology 1999;86(4):1374-1380.
Prasad RC, Herzog B, Boone B, Sims L, Waltner-Law M. An extract of Syzygium aromaticum represses genes encoding hepatic gluconeogenic enzymes. Journal of Ethnopharmacology 2005;96(1-2):295–301
Ropelle ER, Pauli JR, Cintra DE, Frederico MJ, de Pinho RA, Velloso LA, et al.
Acute exercise modulates the Foxo1/PGC-1alpha pathway in the liver of diet-induced obesity rats. Journal of Physiology 2009 587(9):2069– 2076.
Saltiel AR, Kahn CR. Insulin signalling and the regulation of glucose and lipid metabolism. Nature 2001;414(6865):799–806.
Sarbassov DD, Ali SM, Sengupta S, Sheen JH, Hsu PP, Baqley AF, et al.
Prolonged rapamycin treatment inhibits mTORC2 assembly and Akt/ PKB. Molecular Cell 2006;22(2):159-168.
Sato T, Toyoshima A, Hiraki T, Ohta Y, Katayama K, Arai T, et al. Effects of metformin on plasma concentrations of glucose and mannose, G6Pase and PEPCK activity, and mRNA expression in the liver and kidney of chickens. British Poultry Science 2011;52(2):273–277.
Seglen PO. Preparation of isolated rat liver cells. Methods in Cell Biology 1976;13:29-83.
Serra V, Markman B, Scaltriti M, Eichhorn PJ, Valero V, Guzman M, et al. NVP-BEZ235, a dual PI3K/mTOR inhibitorprevents PI3K signaling and inhibits the growth of cancer cells with activating PI3K mutations. Cancer Research 2008;68(19):8022-8030.
Westin JR. Status of PI3K/Akt/mTOR Pathway Inhibitors in Lymphoma. Clinical Lymphoma, Myeloma & Leukemia 2014;14(5):335-342.
Wu P, Hu YZ. PI3K/Akt/mTOR pathway inhibitors in cancer: a perspective on clinical progress. Current Medicinal Chemistry 2010;17(35):4326-4341.
Xu P, Ye X, Zhang Y, Yuan Q, Liu M, Wu Q, et al. Long-acting hypoglycemic effects of PEGylated FGF21 and insulin glargine in mice with type 1 diabetes. Journal of Diabetes and its Complications 2015;29(1):5-12.
Yabaluri N, Bashyam MD. Hormonal regulation of gluconeogenic gene transcription in the liver. Journal of Biosciences 2010;35(3):473–484.
Yuan L, Luo X, Zeng M, Zhang Y, Yang M, Zhang L, et al. Transcription factor TIP27 regulates glucose homeostasis and insulin sensitivity in a PI3-kinase/Akt-dependent manner in mice. International Journal of Obesity 2015;39(6):949-58.
Yuan TL, Cantley LC. PI3K pathway alterations in cancer: variations on a theme. Oncogene 2008;27(41):5497-5510.